Key points:
-
- 2024-5 was the third straight year of solid double-digit returns for diversified ‘passive’ ETF investors.
- A standard 70/30 (‘balanced’) fund or ETF portfolio should have returned near 12% after fees. Did yours?
- Problem is – most industry, corporate, retail super funds returned less than this. Why? Most have big holdings of opaque, illiquid assets, and/or pilfer your life savings to spend on marketing, sponsorships, and political donations.
- Even small amounts of under-performance can compound into very large differences in your future wealth and lifestyle.
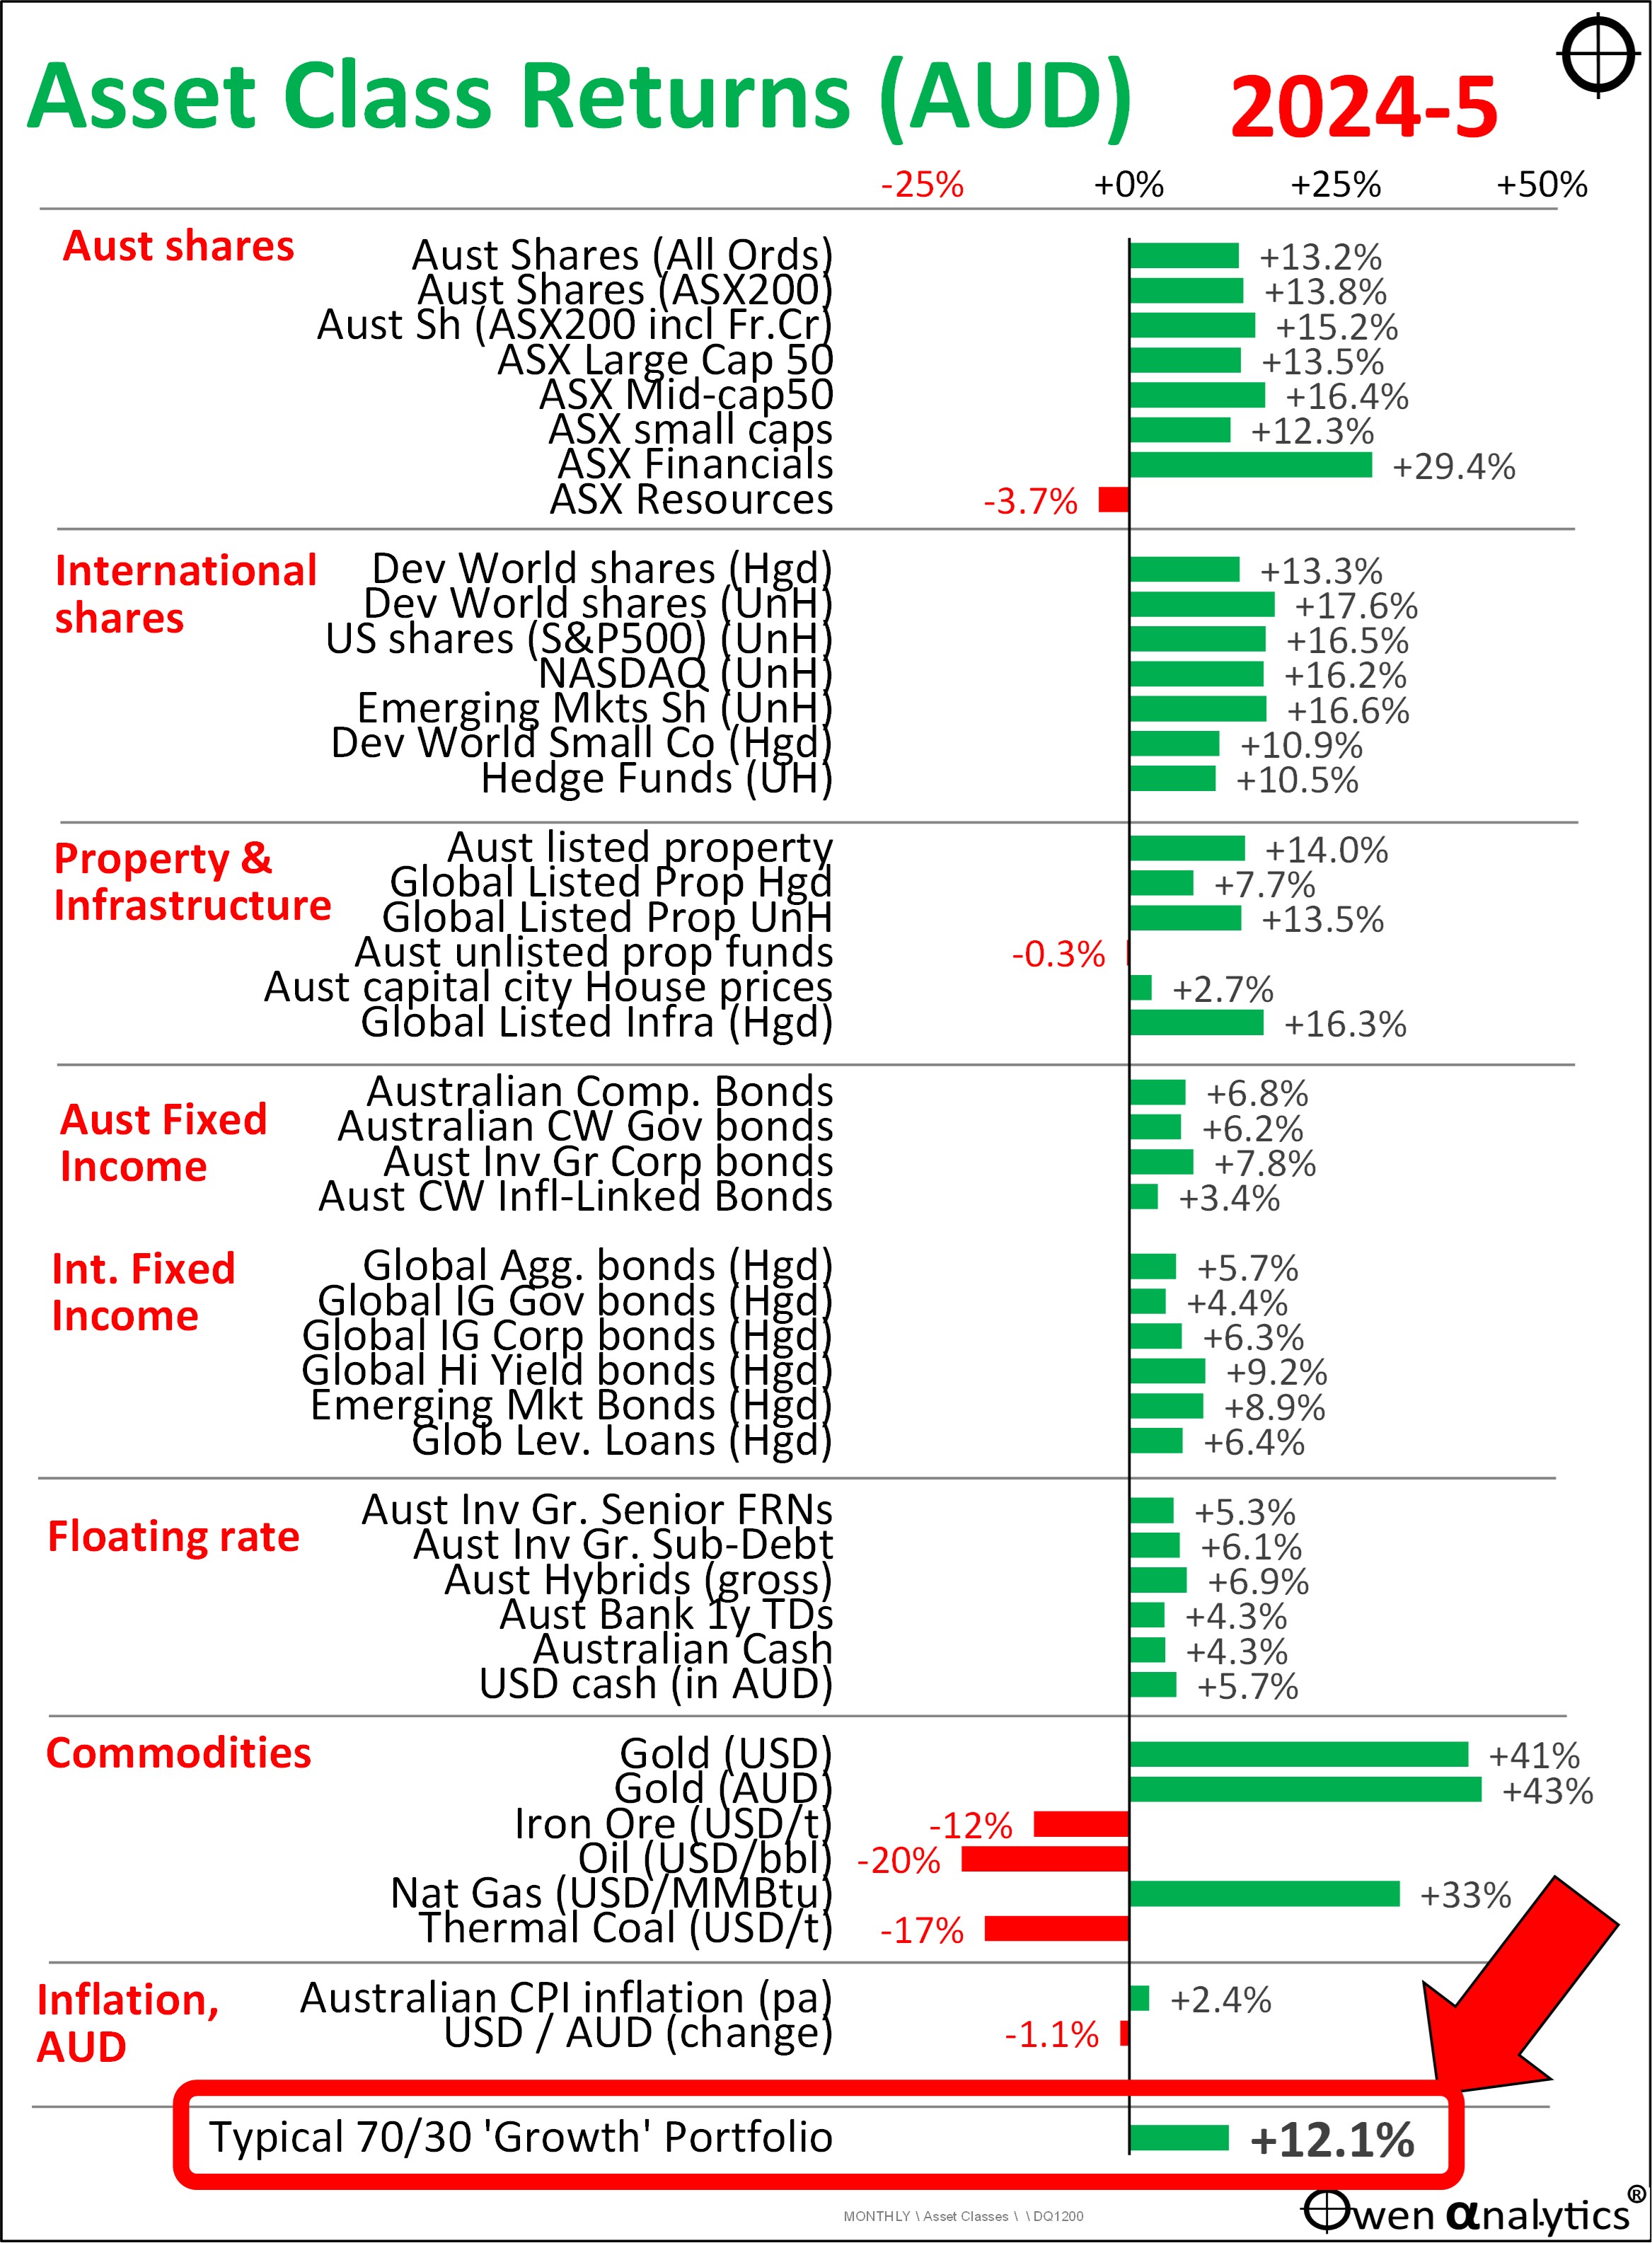
- Here are the returns of major asset classes for 2024-5 and a 70/30 pro-forma portfolio mix.
Here are total returns in Australian dollars for the major asset classes for the 2024-5 June financial/tax year:
All asset class returns are before fees. All are investable via low-cost ETFs on the ASX, at fees often as low as 0.05%, or about 0.10% for a simple diversified portfolio of ETFs (see below).
Looking briefly at the major asset class categories:
Australian shares
Banks led the way – driven by the mysterious rise and rise of CBA. Its price surge has not been underpinned by growth in profits or dividends or book value or return on equity. Just a flood of money looking for a ‘safe’ home, regardless of fundaments or price. That happens sometimes!
The big miners (mainly iron ore) were hit by a -12% fall in iron ore prices due to weak Chinese demand and looming global over-supply fears.
Overall, another year of above-average nominal and real (after inflation) returns on the broad local market.
For more details, see my latest monthly report for returns to the end June 2025:
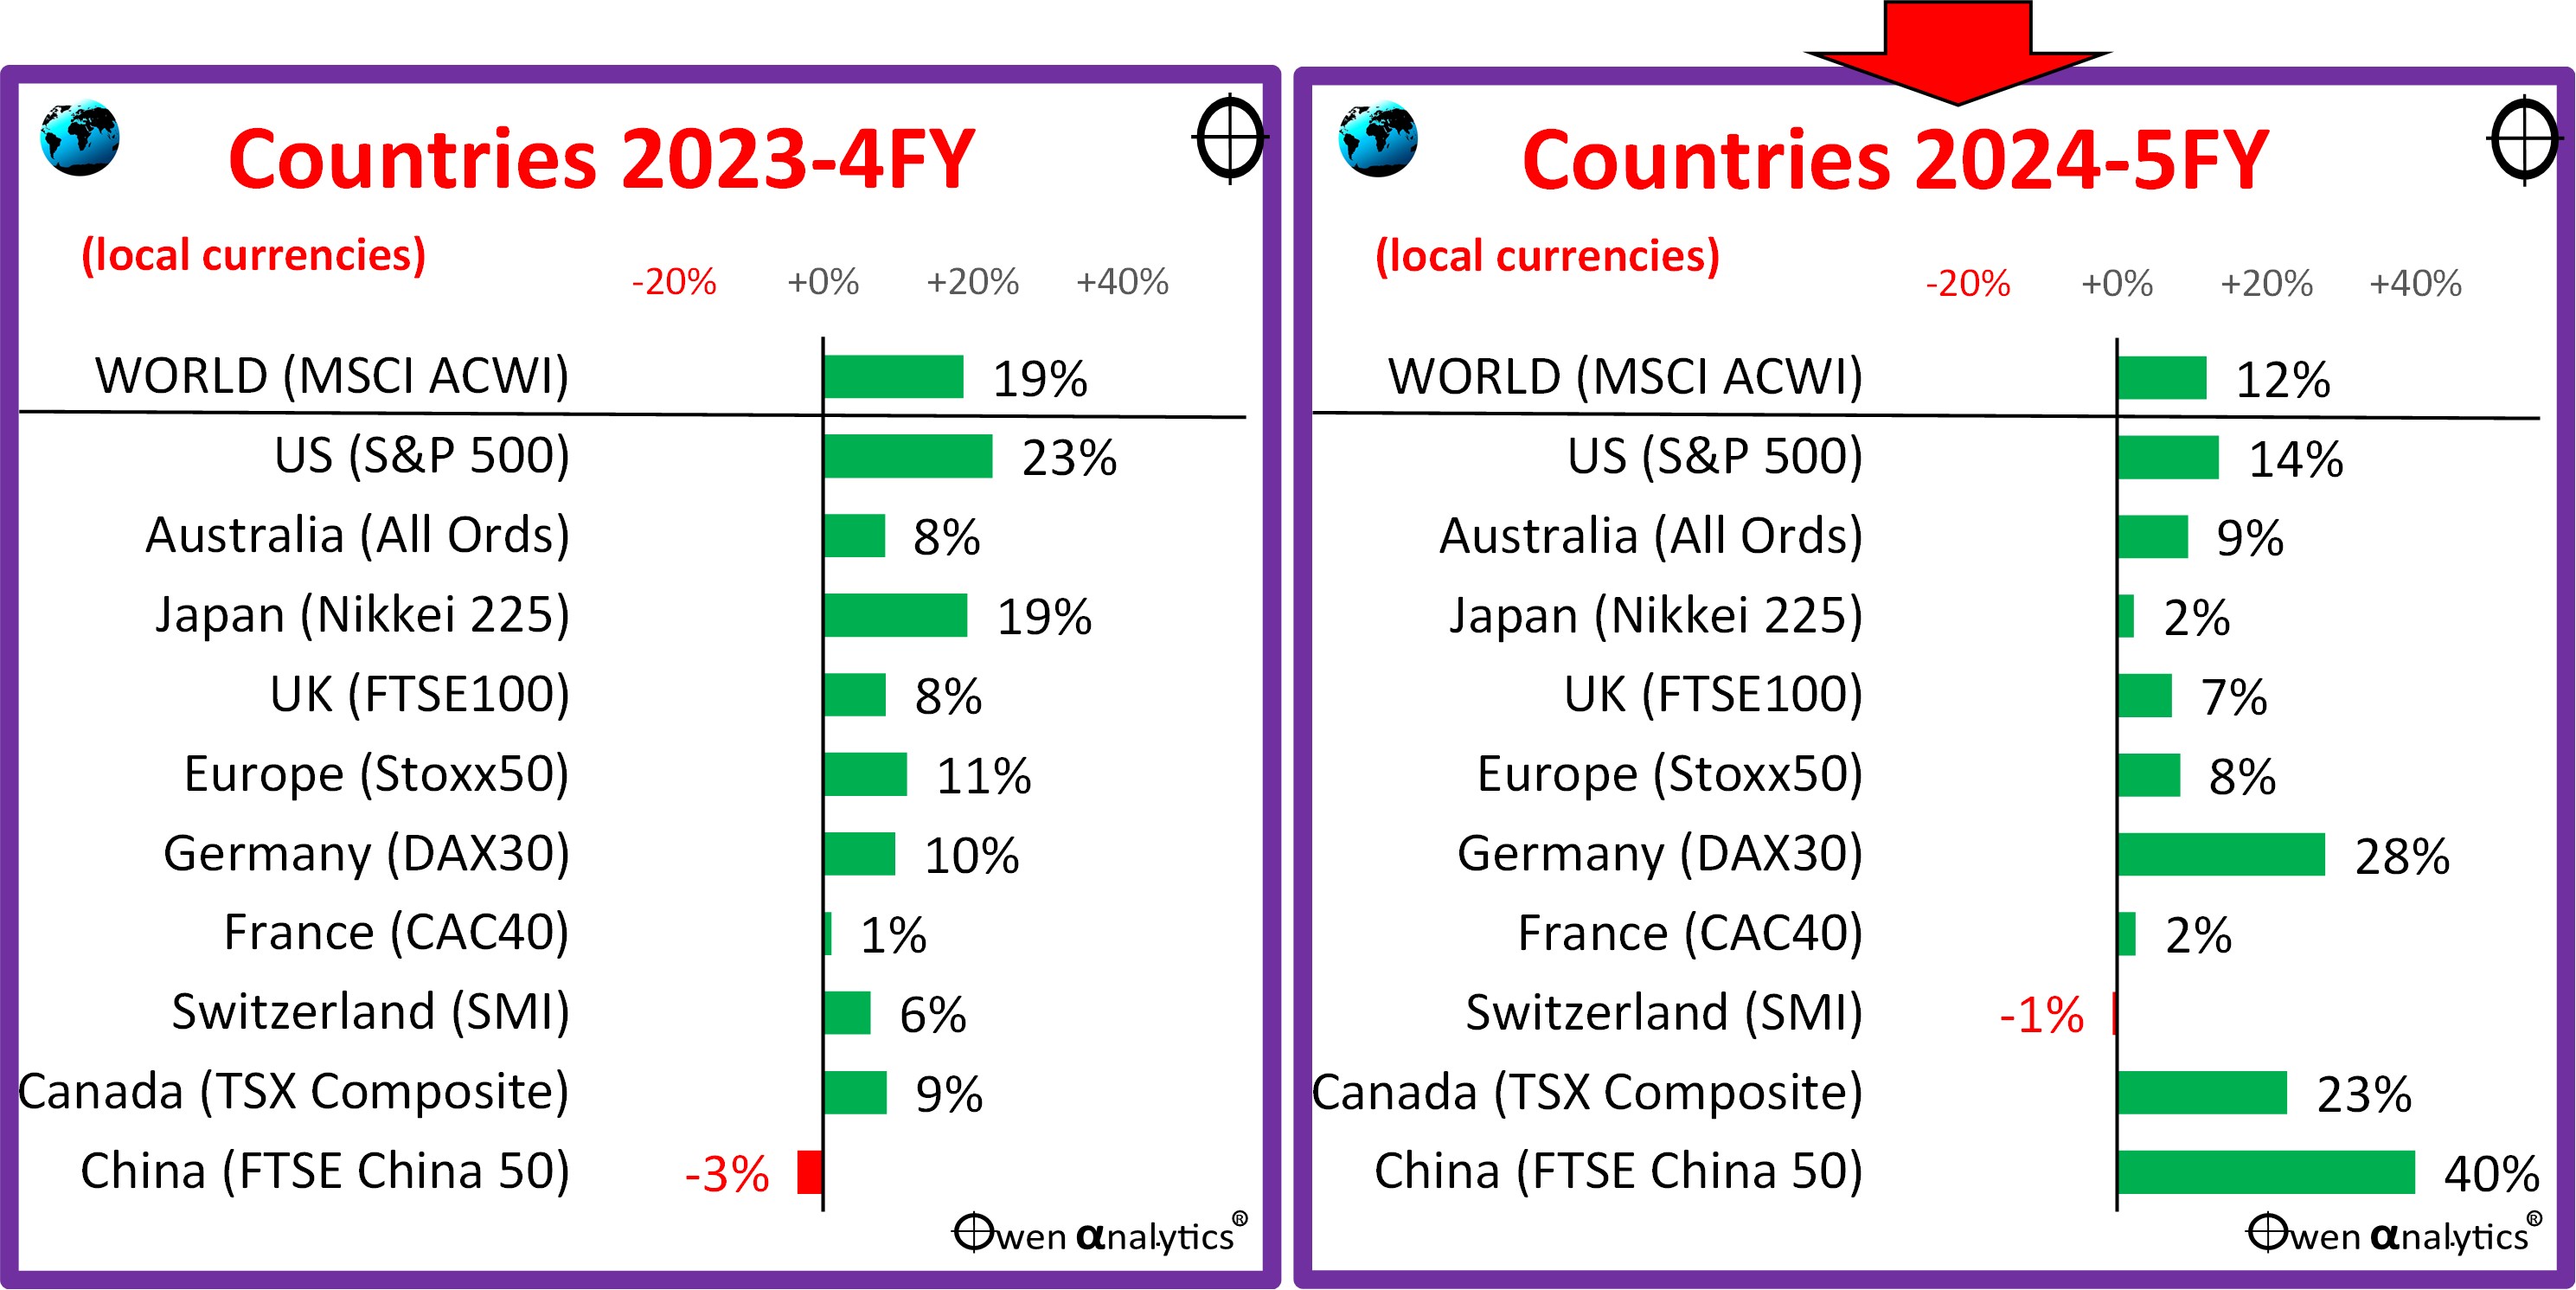
Global shares
Global share markets also posted another year of double-digit returns in 2024-5, but the shape of returns was very different from the prior year. The US led the world in 2023-4 (left chart), but was more subdued in 2024-5 (right):
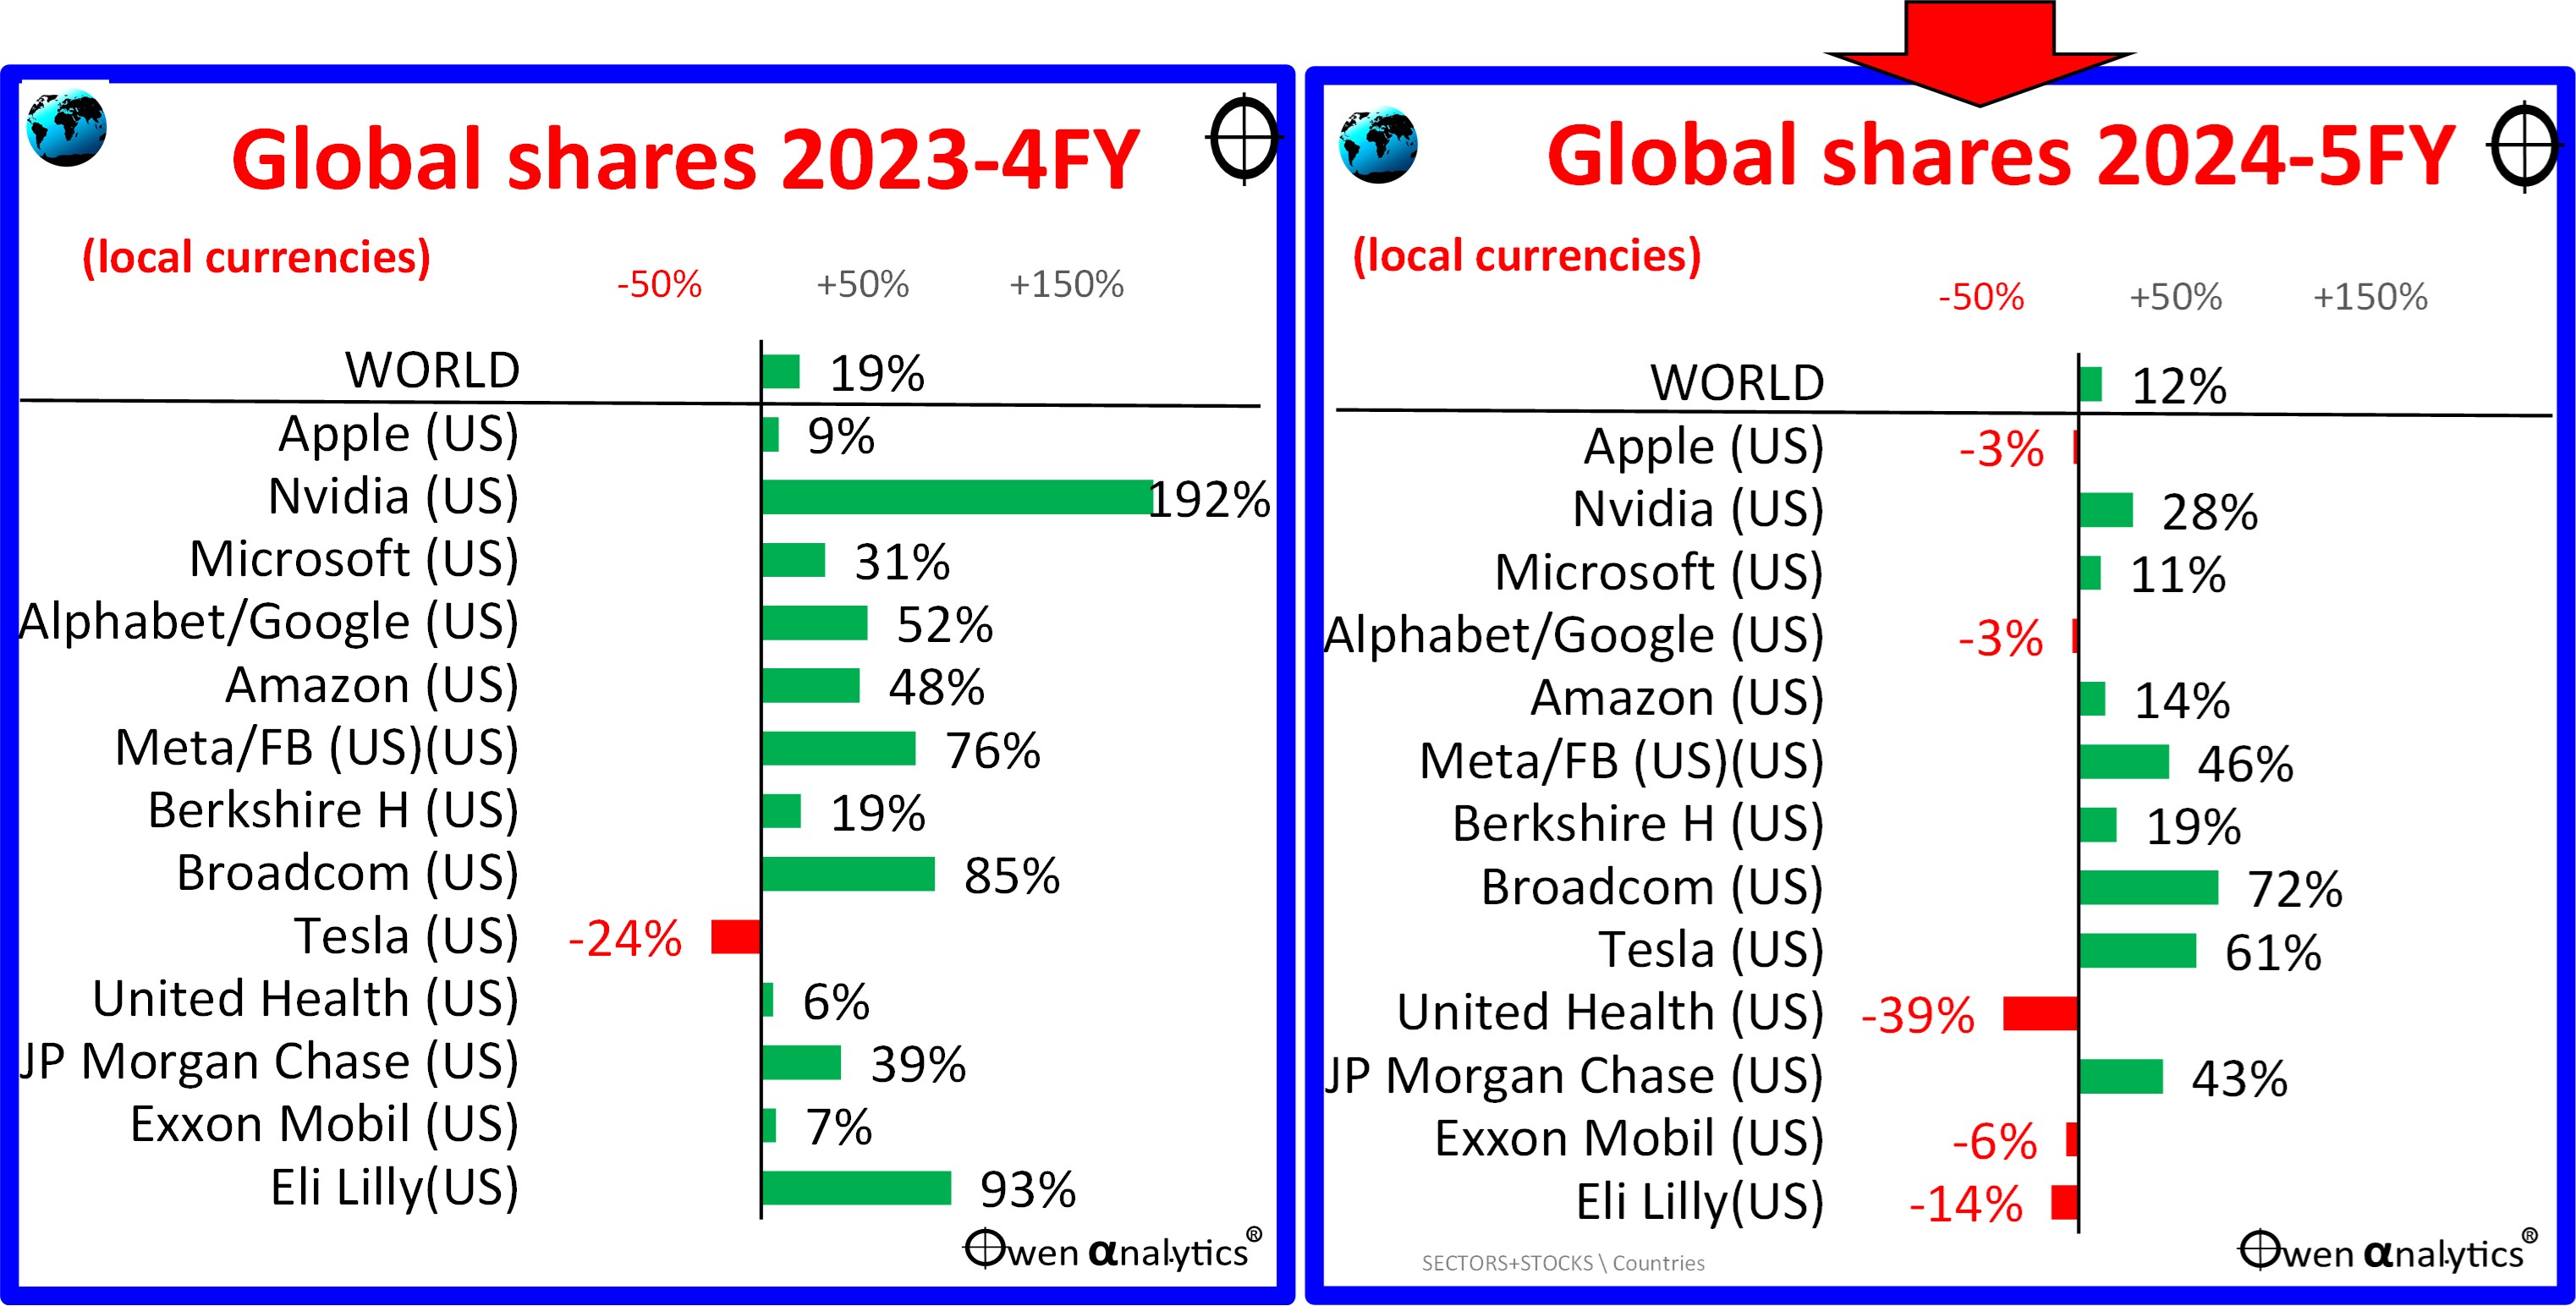
The main reason was the very different fortunes of the US big-tech stocks. All had lower gains than the previous year (except Tesla):
‘Defensive’ assets
On the ‘defensive’ side (I’m using the traditional textbook label here, although fixed rate bonds are often not very ‘defensive’ at all) - fixed rate bonds returned about the same as floating rate notes (around 6% for the year), so there was no reward for taking the additional inflation risk and volatility with fixed rate bonds.
Personally and professionally (in the Investment Committees I serve on and the funds I advise) I have been out of fixed rate bonds altogether since 2020, opting instead for investment grade floating rate notes. It was, and continues to be, a good call as there are still inflationary pressures here and around the world.
Diversified portfolios
A standard ‘70/30’ fund (70% ‘growth’ assets, ie shares; and 30% ‘defensive’, ie bonds) should have returned around 12.1% before fees for the 2024-5 year, or near 12% allowing a generous 0.20% for ETF fees.
This is based on a very simple ETF portfolio that anyone can buy for just a couple of thousand dollars: 70% in shares (half Aussie, half international, of which half are currency hedged), plus 30% in investment grade bonds (half Aussie, half international, hedged). Anyone can do this with 4 ETFs:
-
- Australian shares: 35% (broad ASX300 or ASX200 ETF)
- International shares: 35% (50% in a hedged ‘World shares' ETF, 50% in an un-hedged 'World’ ETF)
- Australian bonds: 15% (Australian Composite bond ETF)
- International bonds: 15% (Global Aggregate bond ETF)
(For each of these four basic asset classes, there is a variety of low-cost ETFs on the ASX)
The overall management fees on this simple ETF-based portfolio can be as low as 0.10% pa depending on which ETFs you use.
The above mix not just a random mix of asset classes here. It is based on the standard asset allocation for long-term ‘balanced’ or ‘growth’ (definitions vary) diversified portfolios offered by all of the major ETF providers, multi-sector fund managers, institutional funds, and major advice groups in Australia over the last decade or so. Asset allocations vary at the margin. Eg some are 65/35, some are 75/25; there are some differences in the mix of Aussie -v- global shares, and mix of Aussie -v- global bonds, but they more or less generate very similar outcomes.
For example, take a look at the main chart above, and see how closely bunched the returns are among the main types of share asset classes (top third of the chart, any mix will be around 12-14%), and also among the different bond asset classes (middle third, any mix will be around 6%).
Everybody is different
Of course the usual qualifications apply – that every investor is different – different age, life expectancy, health, medical conditions, genetics, family circumstances, dependents, cash flow needs, return goals, risk tolerance, investment experience, tax situation, insurances, other assets, liabilities, lifestyle expenses, expectations, etc, so everyone should make up their own mind and seek their own professional advice about what types of investments are appropriate for their specific, unique situation.
That said, if you line up the big institutional retirement/super funds in Australia that invest the life savings of many millions of Australians across all ages and all walks of life, their asset allocation mixes are remarkably similar! In many cases the only significant differences are the logo and picture on the brochure and website!
Diversified ETFs
You can also achieve a similar diversified mix even more simply by using a single diversified ETF (ETF providers Vanguard, BetaShares, and iShares each offer several varieties). Their fees are higher than what you could do yourself with separate ETFs, but that’s the cost of convenience and automatic rebalancing, which does have a lot of merit.
Institutional funds?
The problem is that most industry super funds, corporate funds, and retail funds fell short again in the 2024-5 year.
For example, industry research firm SuperRatings reported that the median ‘balanced’ accumulation fund returned just 10.1% for the 2024-5 year (they classify ‘Balanced funds’ as those with between 60% and 76% growth assets). https://www.superratings.com.au/2025/07/04/media-release-super-fund-returns-hit-double-digits-for-fy25/. Fortunately, funds in pension phase did better than accumulation funds.
Even the bog-standard Vanguard Diversified Growth ETF (VGDR) returned 12.6% after fees for the year. (I use this to benchmark my own investing becuase it has the longest history, but BetaShares and iShares have similar diversified ETFs with similar allocations and outcomes.)
Why the big fund return drag?
Who knows?! The big funds are notorious for pilfering members’ life savings to waste it on self-serving advertising, marketing, sponsorships, and kickbacks to unions and political parties. Who needs that? The only thing big super funds have going for them is member apathy!
Another major factor for large institutional super funds is that most hold relatively large allocations (up to 40% of total assets in some cases) in opaque, illiquid, ‘private assets’ like venture capital, private equity, and hedge funds. These are notorious for fudged valuations and hidden fees and risks.
Global venture capital and private equity markets in particular are in deep trouble, following an orgy of bad investments taken on at crazy boom-time prices in the Covid stimulus boom, and financed with mountains of debt taken on when interest rates were near zero. Many funds are now sitting on hidden losses and artificially high asset values. Likewise with many unlisted commercial real estate funds.
The power of compounding
If your ‘balanced’ or ‘growth’ super fund or long-term investment fund did not return at least 11.5% after fees for the 2024-5 year, make it your mission to find out exactly why.
Remember, small differences compound over time into very BIG differences in your future wealth, lifestyle, and legacy.
My own published long-term ’10-4 all-weather ETF portfolio’ returned 14.5% after fees for the year – but I will report on that in a separate story shortly.
‘Till next time, safe investing!
For my most recent monthly update on local & global markets for Aussie investors:

For my report on global share markets to June 2025 -

On the mysterious rise and rise of CBA, see -

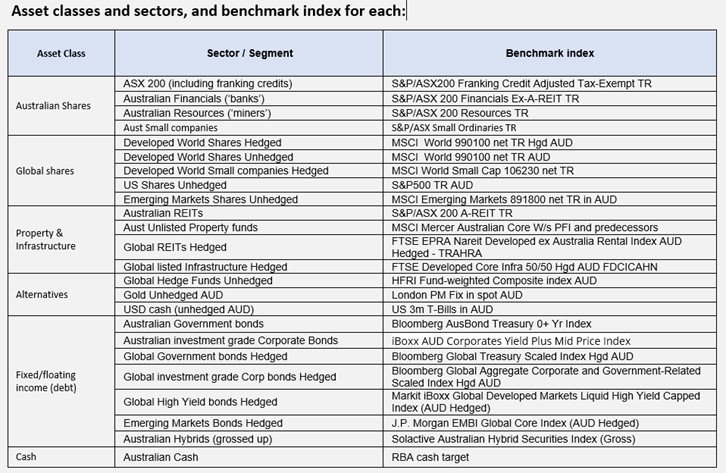
Benchmarks per asset class: