Many readers wanted me to back up my bold claim that even the best investor in the world – Warren Buffet – suffered from the same disease that plagues every other successful fund manager in the world - fading out-performance over time.
Everything I do is fact-based, so here are the facts.
NB – dozens of books and thousands of articles have been written on Warren Buffett and Berkshire Hathaway, covering every investment decision in detail, so I am not going to cover that territory here.
This article is about performance fade that affects all fund managers, and that even includes the world’s greatest.
My analysis here is not covered in any of the books or articles on Buffett that I have seen. (Plus, I am a Berkshire Hathaway shareholder, so I have a special interest in this.)
But first, some background…
How we got here –
In my recent article - 'Most Active Managers continue to destroy value and line their pockets with your money' - I showed how the vast majority of actively managed funds under-perform their benchmark over any given holding period. The results are the same every year, so that is nothing new.
Then in my last article – 'Few active fund managers add value. But even value-adding managers almost always fade over time. How to pick the good ones before they lose it' ? - I showed how even with the very small proportion of fund managers that did add value (i.e., beat their market benchmark over a decent period), their out-performance always fades over time.
After studying hundreds of funds, my conclusion was:
All active fund managers peak early in their careers (in terms of beating their market index anyway) - and then it is all downhill from there. Even for the best in the world.
Every fund manager in history peaked early, then suffered terminal declining out-performance after that. They never ‘get their mojo back’. It’s a guaranteed slide into mediocrity.
This includes the greats like Warren Buffett, Peter Lynch, George Soros, John Templeton, and local ‘stars’ like Kerr Neilson, Hamish Douglas, and everybody else.
Although declining out-performance over time is almost guaranteed, the reasons are different in each case.
I list my 15 reasons for fund manager performance fade over time in my article: 'Few active fund managers add value. . .’.
Even Warren Buffett?
Yes – the pattern is the same.
I am a long-term shareholder in Berkshire Hathaway, so I have a vested interest. It has beaten the S&P500 total return index by an astounding 10.0% pa since May 1965 when Buffett took over, but most of that out-performance was in the early decades.
It has not added any value against the S&P500 index since 2002. Its out-performance fade curve is the same as other value-adding share funds in Australia and other markets.
Tracking performance decay over time
Here is my chart for Berkshire Hathaway since May 1965 when Buffett took control.
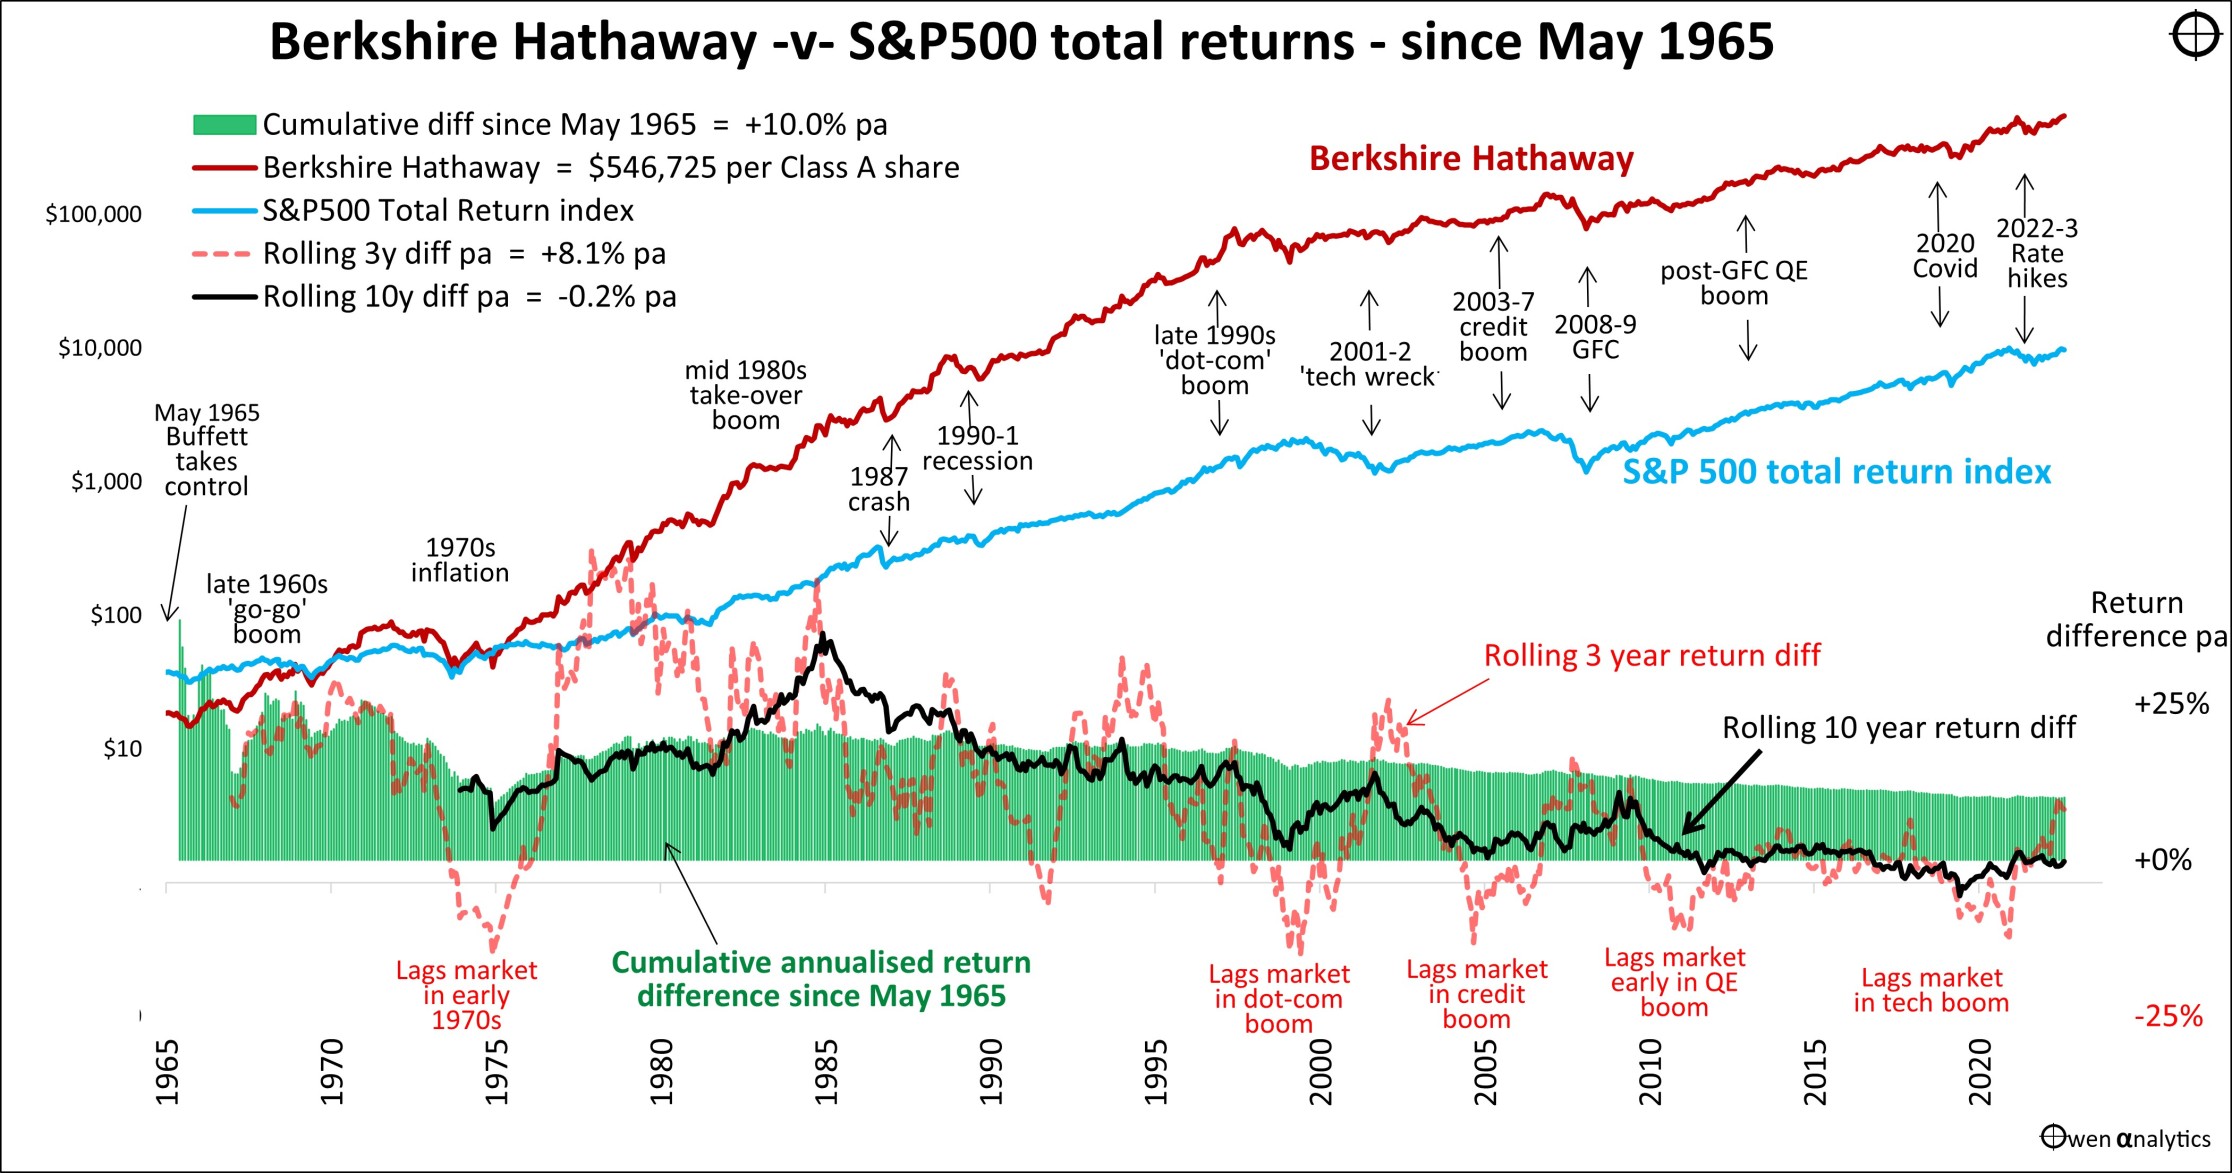
Chart of Berkshire Hathaway since 1964 versus S&P500 total return index
The red line is the Berkshire’s share price. Since Buffett took over in 1965, the company has paid no dividends and has re-invested all earnings, so the share price is essentially the ‘total return’ series.
(NB. The shares have not split over the period, so the price of BRK Class A shares has grown from $12.37 to $546,725 per share at the end of August 2023.)
The blue line is the S&P500 total return index. This is the most appropriate benchmark because Berkshire’s investments have always been US companies (listed and unlisted), with very few exceptions (notably Chinese car maker BYD).
The black line shows annualized rolling 10-year excess returns above the benchmark. This is our main historical measure for long-term investors.
The orange dotted line is the annualized rolling 3-year excess returns above the benchmark. This is a good way to see performance through different cycles and market conditions.
Beat the market by 10% pa since inception
The green bars in the lower section of the chart show the annualized cumulative excess returns over the benchmark since May 1965. This is the annualized ‘since inception’ out-performance over time.
It has beaten the S&P500 total return index by 10.0% pa compound over 58 years! No other fund manager in history has ever come close to this over such a long period.
Warren Buffett, along with his side-kick Charlie Munger, is without a doubt the greatest portfolio share investor in history. I use the term ‘portfolio investor’ to differentiate him from founder/owners like Rockefeller, Carnegie, Musk, Bezos, Gates, etc. They built their own companies, but Buffett invested in other peoples’ companies, which is a very different skill.
(Buffett put just $100 of his own money into his first fund in 1956. He earned the rest of his stake by taking his out-performance fees in units in his fund, rather than cash, and then rolled it into Berkshire Hathaway in 1965. So, he turned his original $100 in 1956 into $120 billion today).
Peaked in 1965 - year one!
Like all active fund managers, Buffett peaked early – in fact, he peaked in the very first year in Berkshire. He beat the S&P by a whopping +37% in 1965, and that was the peak of the annualized cumulative value-add (green bars).
1965 was actually not his best individual year. He had several even better years – and they were all early on. He beat the market by +105% in 1976, +84% in 1979, +67% in 1968, +66% in 1971, +54% in 1977, +53% in 1989. These were partially offset by some poor years in between, so the cumulative ‘since inception’ peak was in 1965.
All downhill from the initial peak
Unfortunately, like all active managers, it was all downhill from the early peak (albeit still generating higher returns than anyone else in history).
By the end of the 1960s, the annualized cumulative value add was +27% pa.
- By the end of the 1970s it was +19.7% pa.
- By the end of the 1980s it was +20.4% pa.
- By the end of the 1990s it was +15.1% pa.
- By the end of the 2000s it was + 13.1% pa.
- By the end of the 2010s it was +10.5% pa.
Today, the annualized cumulative value add is down to ‘just’ 10.0% pa. This is still an astronomical performance over 58 years, and far higher than any other portfolio investor or fund manager in history over a similar period.
What’s not to like? As a prospective investor, you might say: “Wow, the since inception return is still 10% pa over 58 years. It should still be a great investment!”
That's why fund managers and their sales reps love talking about 'since inception' returns. But they are meaningless.
The problem with ‘since inception’ numbers
This highlights the big problem with ‘since inception’ numbers. The great looking ‘since inception’ return of 10% pa masks the fact that most of that out-performance was generated in the early years, half a century ago.
We get a much clearer picture of performance by looking at returns per decade:
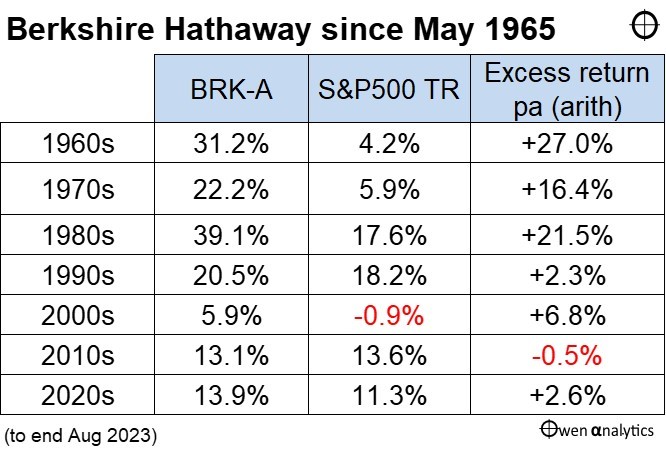
table of Berkshire Hathaway returns =v= S&P500 per decade
The big out-performance was in the 1960s, 1970s, and 1980s.
In the 1990s it added almost no value as Buffett lagged the market by deliberately avoiding the crazy ‘dot-com’ boom. This earned him a lot of derision at the time, but he was vindicated when he added value in the 2000s by avoiding the ‘tech wreck’. However, virtually no value was added in the 2010s and 2020s.
Rolling 10-year value-add
The black line (rolling 10-year value-added pa) is the key. It shows rolling 10-year annualized value add is currently zero – i.e., no value added above the market at all over the past 10 years.
In fact, the black rolling 10-year value add line has been running at around zero for the past ten years since 2012, because it has added no value at all since 2002.
That’s a long time going nowhere!
It didn’t actually go nowhere, of course – it has gained 650% since 2002, but so has the passive S&P500 total return index.
That’s better than the 490% return from the Australian market over the same period.
Rolling 3-year value add
The orange dashes (rolling 3-year value added pa) is a good way of showing where the value is added or detracted through market cycles.
Buffett’s pattern has been very consistent over seven decades. His ‘value investing’ strategy lagged the overall market in booms (by avoiding fads/bubble stocks), but then added value in the busts when the fads/bubble stocks collapsed. The only exception was poor returns in the 1973-4 crash, but that was recovered big time in the late 1970s and 1980s.
True to form, Buffett was also vocal in avoiding the most recent 2020-1 Covid stimulus tech bubble, and the share price lagged the market (orange dash line below zero) as expected. There were also some poor deals in the recent cycle – notably Kraft-Heinz, and the disastrous Airline bets in 2020.
In the rebound over the past year, performance has improved - thanks to huge bets on Apple and oil/gas.
Reasons for performance fade
In my last article, I summarized my fifteen main reasons for fund manager performance fade, having studied hundreds of funds over many years.
Buffett and Munger certainly have not succumbed to the problems that afflict most fund managers - getting fat and lazy, selling out, no longer lean & hungry, family problems/diversions, buying football teams, trinkets, hubris/ego, etc, etc.
In their case, there are probably two reasons:
- Berkshire has become just too large – they cannot deploy the huge sums effectively without moving markets.
- It has too much cash, which is largely the result of the first problem.
Am I a seller? – probably not until the SMSF is in tax-free pension mode – so I avoid CGT on sale! But there is another benefit I will cover in a moment.
Same pattern of fading out-performance
For reference, here is a copy of the charts on 20 ‘value-adding’ Australian share funds, from my last article.
Just as with Berkshire Hathaway, the general pattern is the same - excess returns (green bars) start out with a bang early in the fund’s life, but then fade over time in every case.
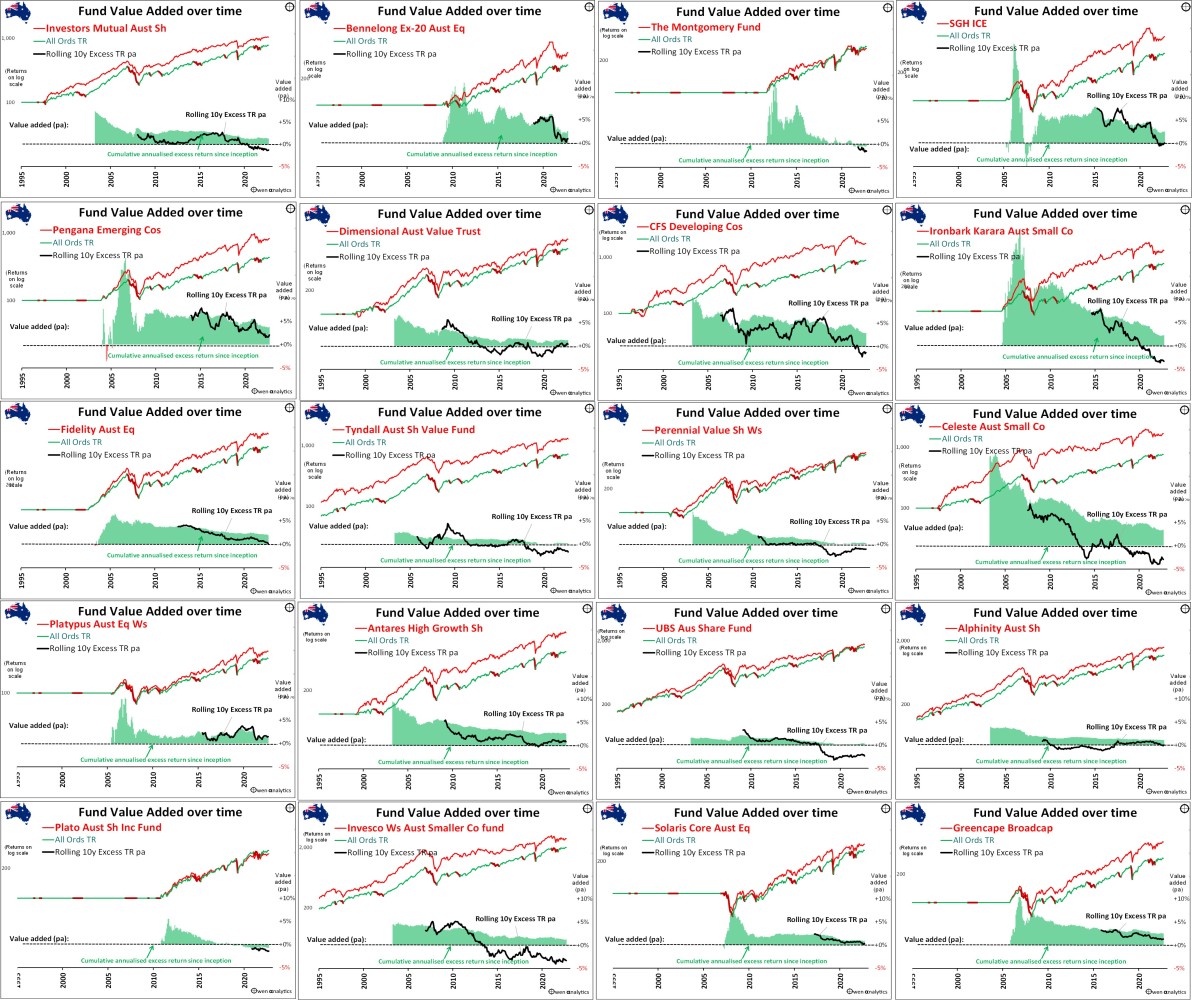
20 fund performance charts
Three stages of out-performing fund managers
Here is the chart from my last article, outlining the three stages in the life of an out-performing fund:
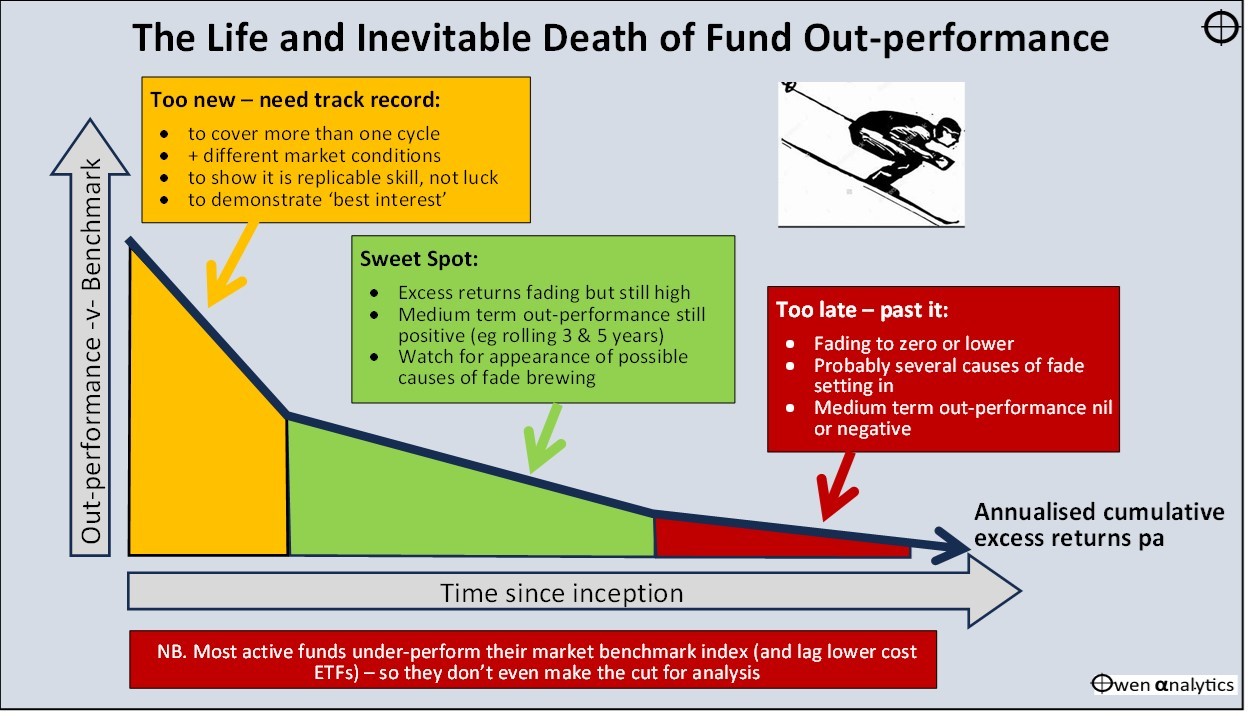
Berkshire Hathaway was in the Sweet Spot for decades, but has probably been in Stage 3 since the early 1990s.
The orange 3-year value-add line on the main chart shows there are certainly some short-term opportunities through the cycles, but as a long-term investor, the black 10-year value-add line has flat-lined.
How did I get my free lunch?
It has been a fascinating journey as a Berkshire Hathaway shareholder. I have never been to Omaha, but I reckon I’d better book a ticket soon!
(Just not on Qantas – here is my story on Qantas - ‘My adventure with the over-geared, over-protected, cashless bird. And proof that the Bigger Fool theory works!’ I have less chance of being able to actually use my hundreds of thousands of Frequent Flyer points, then I have of becoming the next Warren Buffett!)
On the basis of returns, Berkshire has been no better than an S&P500 index ETF over the past twenty years.
However, true to label, it has lagged in the booms but held up well in the sell-offs, so it has been a decent diversifier without detracting value.
That’s a ‘free lunch’ in Markowitz terms! – Higher returns with no higher volatility; or market returns with lower volatility, which is what it delivered.
That, my friends, is how I got my ‘free lunch’ from Warren Buffett!
Thank you for your time. Please let me know your thoughts.