The number of company failures in Australia are certainly rising:
- from 376 insolvencies per month in calendar 2021,
- up to 537 per month in 2022,
- and shooting up to 769 per month in 2023.
- There were 967 company insolvencies in February 2024 alone!
This certainly makes nice, scary media headlines, but there is more to the story.
Here are three reasons NOT to panic, and why I'm bullish on Aussie businesses on the whole, recession or not.
Here is a picture of company insolvencies per month and by industry, since 2013:
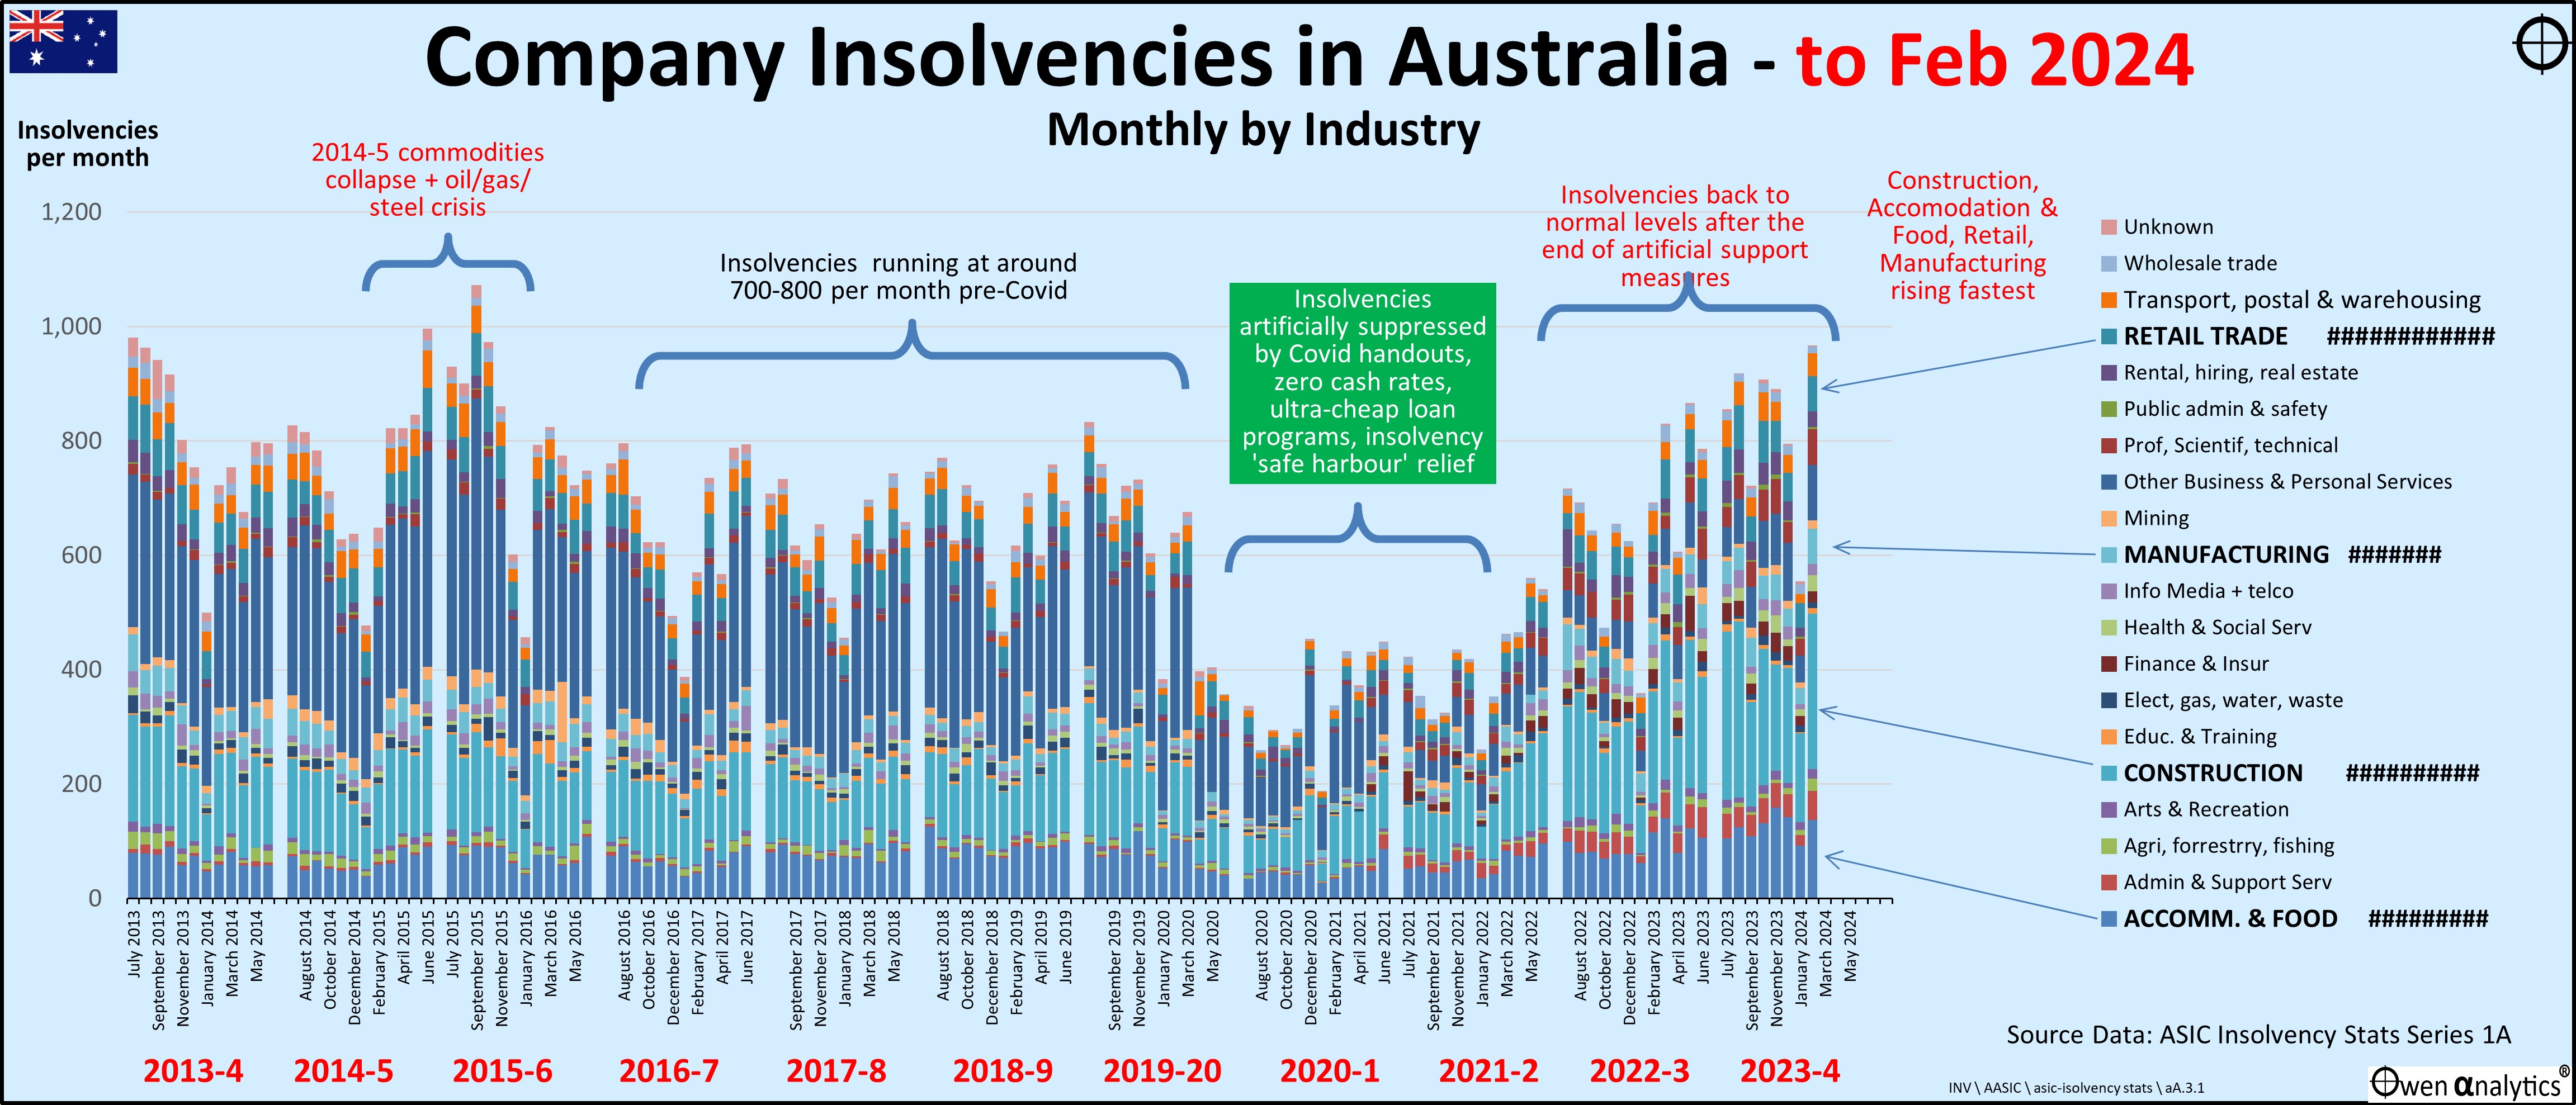
The chart does show the number of insolvencies doubling over the past couple of years. But we can see that all they have done is return to their pre-Covid levels, after being held down in 2020 and 2021 by the Covid stimulus and support measures.
During Covid, the government locked the entire nation of citizens in their homes and out of their workplaces and businesses.
To counter the economic effects of the lockdowns, governments acted on three main policy fronts:
- Monetary policy measures included: cash rate cut to 0.1%, RBA’s bond buying programs (‘QE’ or ‘quantitative easing’) to suppress long term interest rates, and ultra-cheap loans to banks to on-lend to businesses and consumers.
- Fiscal policy measures included: one-off payments to pensioners and other recipients, Job Keeper payments, wage subsidies for trainees and apprentices, spending on capital works.
Directly suppressing insolvencies
There were also several measures that directly reduced company insolvencies, including:
- · Increasing the threshold at which creditors could issue a statutory demand on a company from $2,000 to $20,000
- · temporarily extending the time companies had to respond to a statutory demand they received from 21 days to 6 months
- · temporarily relieving directors of personal liability for insolvent trading with respect to debts incurred in the ordinary course of a company’s business (the ‘safe harbour’ provisions).
Essentially, the rules were changed temporarily, to greatly limit the ability for creditors to pursue companies for debts owed, including winding up orders.
When these temporary support measures were lifted, insolvencies returned to pre-covid levels. That’s all.
Many of these policies were aimed primarily at companies as employers – including many companies that pocketed Job Keeper payments instead of passing them on to employees, increases in threshold for Instant Asset Write-offs, and waving payroll taxes.
These monetary and fiscal policy measures led to booms in spending, jobs, house prices, and booms in pretty much anything else people could think of to throw buckets of free money at – including designer sneakers, ‘meme stocks’, cryptos and NFTs.
Industries to watch
To the right of the above chart I highlight the industries where insolvencies are rising the fastest.
Australia is ‘construction central’, with a very large reliance on building and related industries and trades. Construction companies have been hit not only by rising interest rates, but also by rapidly rising materials costs, which is fatal to building companies with fixed price construction contracts. The current cycle has seen several major building firms collapse, and this is likely to continue and perhaps escalate.
Insolvencies in Accommodation and Food are also rising rapidly, and higher now than over the past decade on the chart. This may be the effects of higher wages costs and lower tourism, especially from China.
Also with insolvency levels rising quickly, and above pre-covid levels are Retail and Manufacturing companies. Retail probably affected by the ongoing ‘Amazoning’ of retail, which accelerated in Covid lockdowns.
Where to next? The bigger picture
The next chart shows the bigger picture with a bit more context so we can see what is going on and what the future might hold.
This chart shows annual company insolvencies going back to the year 2000, covering the last few economic cycles.
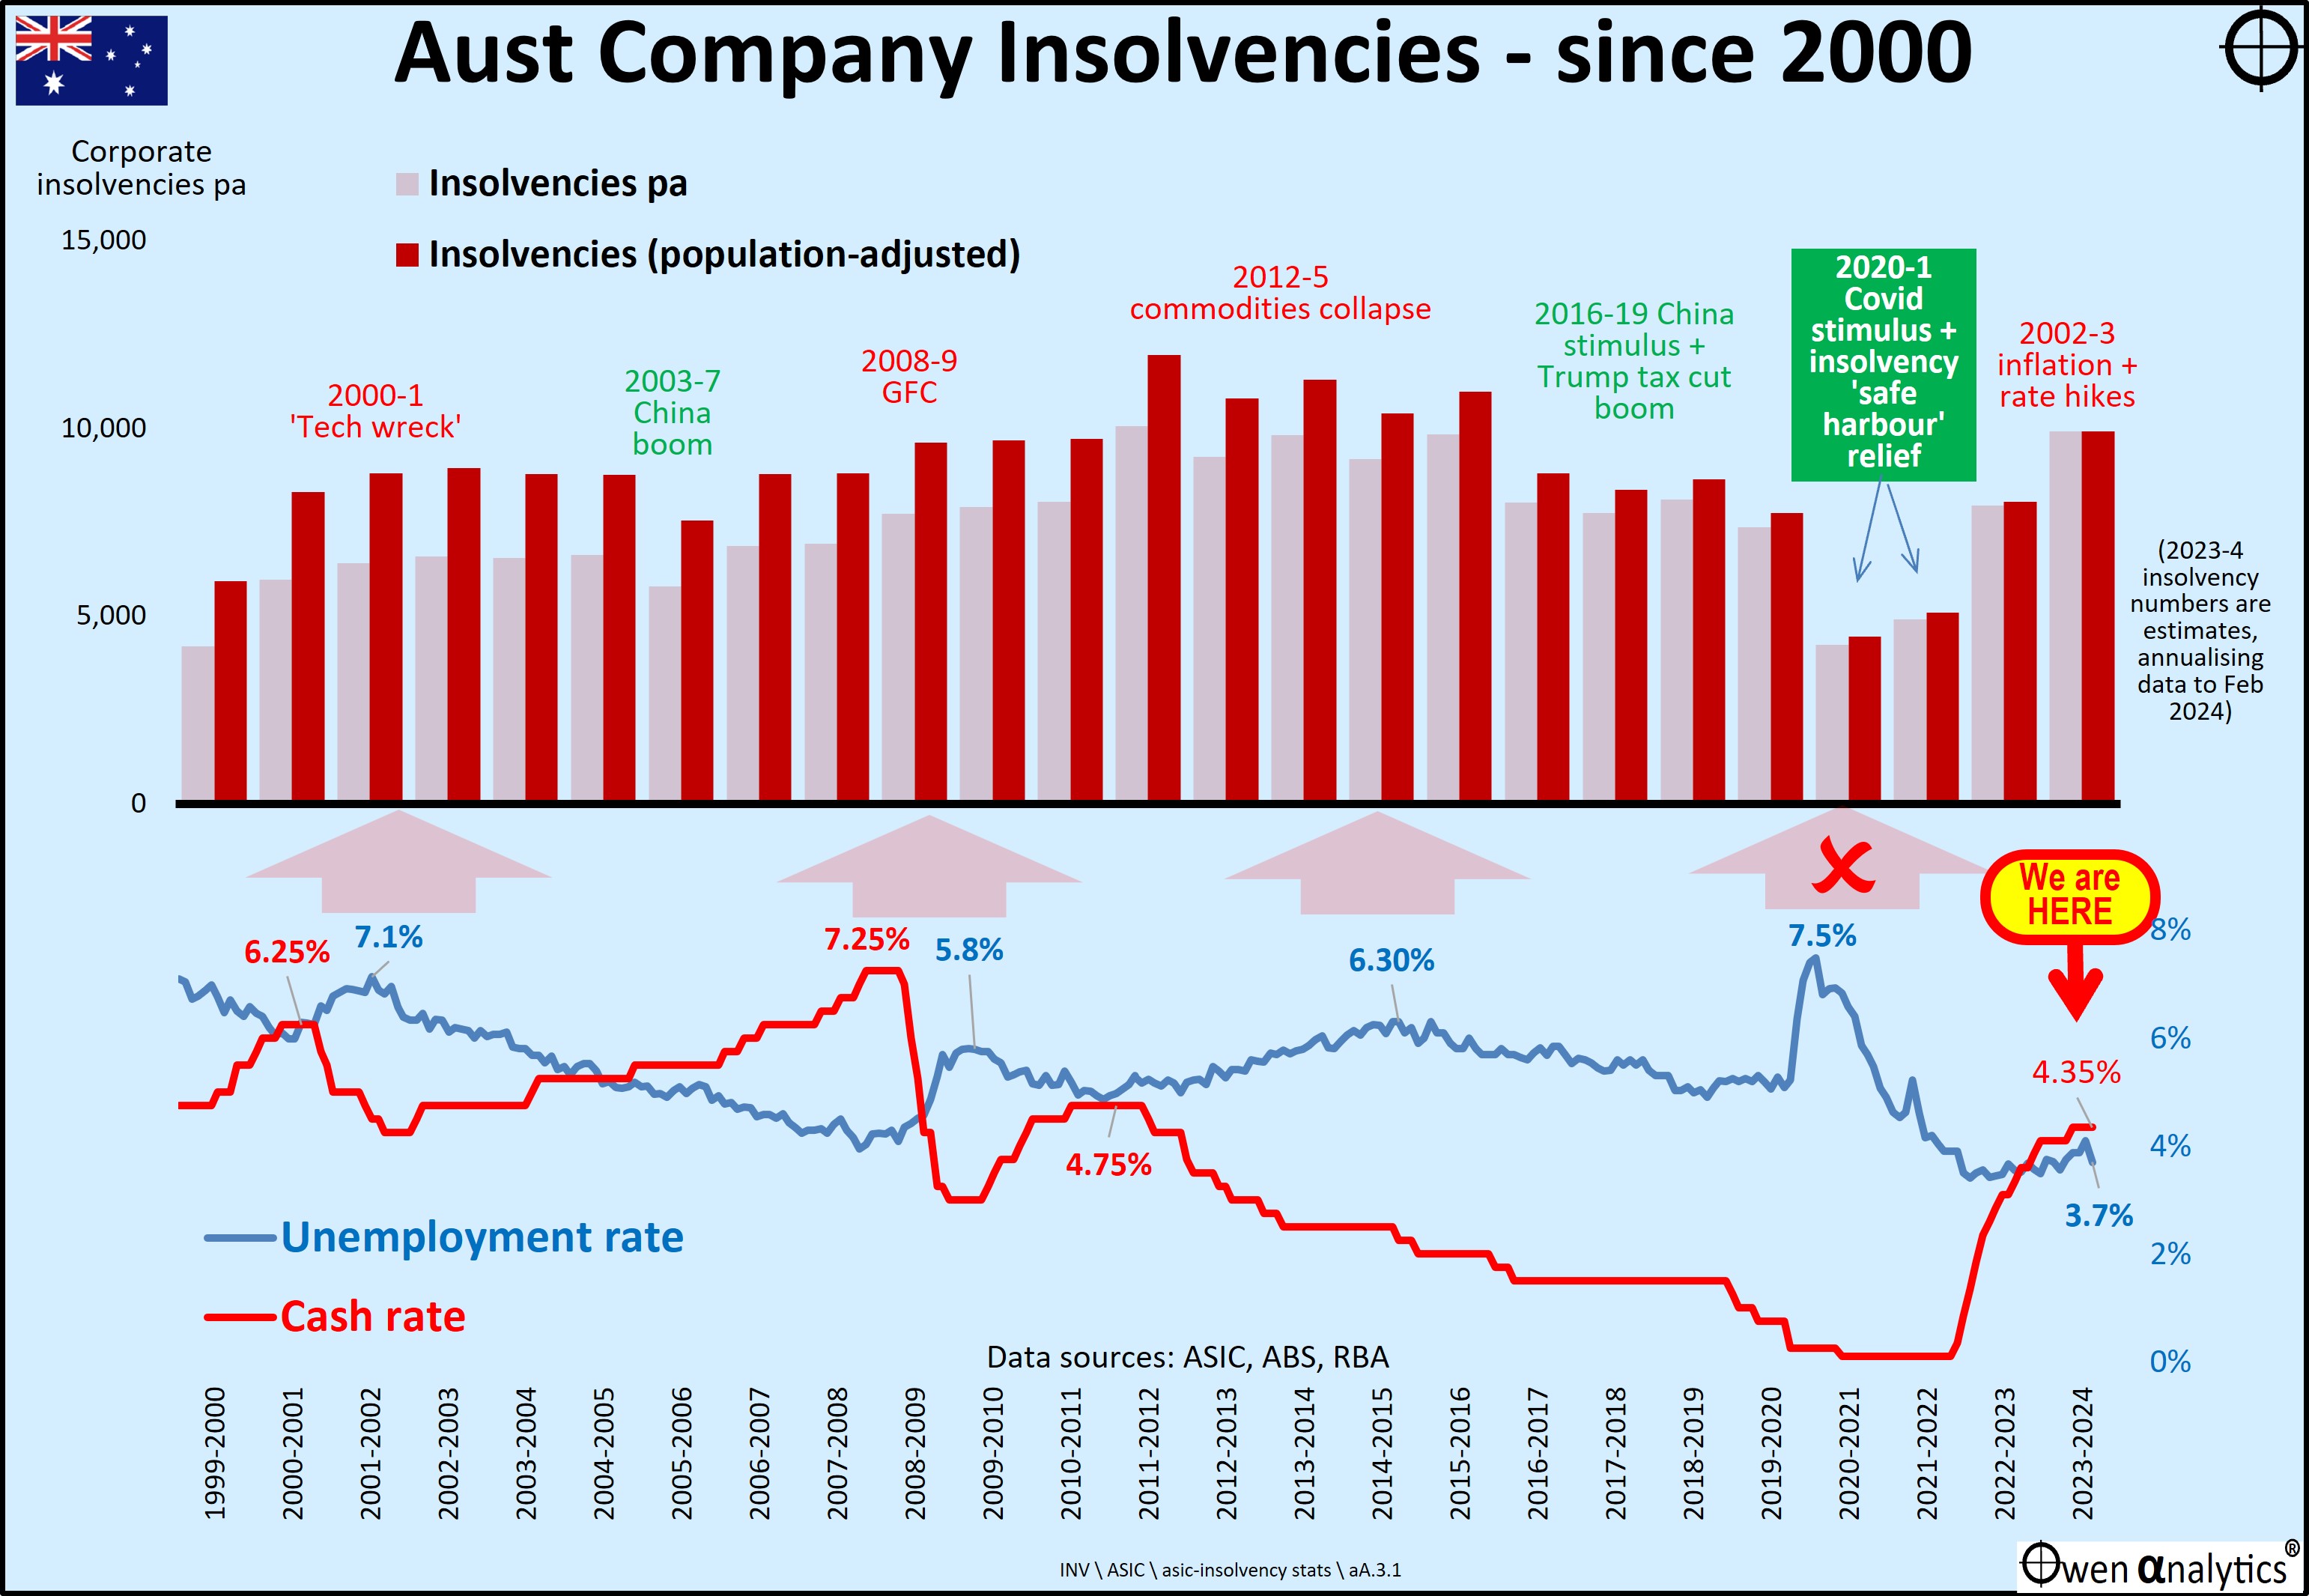
In the upper section, the pink bars represent the insolvencies per year (an extension of the first chart). The number for the current 2023-4 June year is a simple 12-month extrapolation of the eight months of data to February 2024.
Adjustent for population growth
I have added maroon bars in the upper section to show the insolvency numbers in population-adjusted terms. This is necessary so we can compare like for like.
For example, Australia’s population has increased by 41% since the year 2000, so we would expect that the level of economic activity, like company insolvencies, would be higher by more or less a similar proportion (not counting the impact of short-term economic cycles along the way).
We see that the number of insolvencies in the 2022-3 year and 2023-4 year are similar to the overall average level this century in population-adjusted terms (maroon bars).
Nothing unusual in that.
Insolvencies through economic cycles
Insolvency numbers rise and fall with economic cycles. Insolvencies rise in economic slowdowns, then fall back in economic recoveries and booms:
- · Insolvencies rose in 2001-2 ‘tech wreck’ that followed the late 1990s ‘dot-com’ boom,
- · Fell back in the 2003-7 China/commodities boom
- · Fell back in the 2010-1 China GFC-stimulus boom
- · Rose in the 2012-5 commodities collapse
- · Fell in the 2016-9 boom driven by Chinese stimulus and the US/global Trump tax cut boom
There is usually a lag of a year or so, as many companies hang on grimly for a while before finally shutting up shop.
Because of these time lags, insolvency numbers did not rise much in the GFC (which was a much deep economic contraction in Australia than the 2001-2 ‘tech-wreck’) because the GFC was quickly followed by the 2010-1 Chinese stimulus boom.
This longer-term chart highlights how the number of insolvencies was dramatically lower in the Covid lockdown recession than in previous economic slowdowns.
Interest rates and unemployment
The lower section shows interest rates and unemployment rates over the period. These are the main drivers of company insolvency.
Most, but not all, economic slowdowns are preceded by interest rate hikes (normally to cool gathering inflation in economic booms), and then followed by rising unemployment.
High interest rates and unemployment combine to accelerate company failures and insolvencies.
‘Tech wreck’
At the end of the late 1990s ‘dot-com’ boom, cash rates got up to 6.25% in August 2000 to January 2001, and unemployment peaked at 7.1% in October 2001. That combination sent insolvencies up to 9,000 (population-adjusted) in the 2002-3 year.
‘GFC’
At the end of the early 2000s China/credit boom, cash rates got up to 7.25% in March to August 2008, and unemployment peaked at 5.8% in June to August 2009. That combination sent insolvencies up to 9,700 (population-adjusted) in 2010-1, and 12,000 in 2011-2.
2015-6 commodities crisis
After the 2010-1 China GFC stimulus boom, commodities prices collapsed in the 'China hard landing' scare, causing a global oil/gas/steel bankruptcy crisis and broad slowdown.
Cash rates were cut during the slowdown but unemployment rose to 6.3% in February and July 2015, sending insolvencies to 11,000 (population-adjusted) in 2015-6.
Although it was not technically a ‘recession’, we had some major collapses in 2015-6 including: steel maker Arruim (formerly OneSteel, spun out of BHP), Clive Palmer’s Qld Nickel, South Australian copper miner Hillgrove, retailer Dick Smith, restaurant group Keystone Group, Masters Hardware chain, QuickSilver, Homeware chain HomeArt, Vocation, buildering group Home Australia, Linc Energy, Pumpkin Patch, Laura Ashley, and many others.
2020-1 Covid
Despite unemployment spiking up to 7.5% in mid-2020, insolvencies fell dramatically due partly to the support measures and hand-outs, but partly also because of the measures preventing creditors from suing for debts, outlined above.
Now that those support measures have been lifted (and most, if not all, of the Covid handout money has been spent), insolvency numbers have risen back to historical average levels (in population-adjusted terms).
Where are we now?
The reason for showing the past few economic cycles is to see how current conditions compare.
The cash rate is currently 4.35%, and probably not going much, or any, higher as long as inflation keeps falling, albeit slowly.
CPI inflation peaked at 7.9% in December 2022 and has fallen back to 3.4%. A rising tide of wages inflation claims (with no hint of links to productivity gains) threatens to keep inflation above the RBA’s 2-3% range.
However, it is hard to see cash rates rising much in the coming year.
Unemployment has drifted up from a low of 3.1% in October-November 2022 and is still a very tight 3.7%. This is below what economists have said for several decades is ‘full employment’.
Wages are rising strongly, and jobs are plentiful, so there are no signs here of a slowdown in household spending or unemployment that would accompany a broad economic ‘recession’.
Neither cash rates nor unemployment are currently at levels that present a serious threat to cause insolvencies to rise to levels following the GFC.
What would probably do it would be cash rates above say 6% and/or unemployment above 7%. It is unlikely we are heading there in the near or mid-term future.
‘New’ role of government?
However, even when (not if) the next major economic slowdown hits us (whatever the trigger), there is a good case that governments will step in any do whatever they can to prevent unemployment and company insolvencies, just like they did during Covid – hopefully not as scatter-gun or as expensive in future.
Why?
The forty-year era of de-regulation, disinflation, globalisation, free-trade, neo-liberal, laissez-faire, free-market capitalism, tax cuts, and hands-off governments, began in the early 1980s and ended with the GFC.
That era is well and truly over.
Governments, including in Australia, seem to have now returned to the 1930s to 1970s era of interventist, ‘full-employment’, centrest, protectionist, high-taxing, re-regulating, expansionary, hands-on governments that meddle in, and try to control, everything, and try to protect consumers and voters from economic pain (exception inflation!).
Our government’s actions in the Covid lockdowns, and attempts ‘save jobs’ and prevent company insolvences at almost any cost, are evidence of that. Plus more recent evidence in the shift to on-shoring, reviving local manufacturing, protection, picking/subsidising local winners, etc.
What will governments do next time?
I vividly remember living and working through the last two ‘real recessions’ in Australia – in 1981-3 and 1990-1.
In the early 1980s recession, unemployment rose to 10.4% by Sepember 1983 and then remained above 5% for the rest of the 1980s.
In the early 1990s recession, unemployment rose to 10.9% by December 1992, and then remained above 6% for the rest of the 1990s.
In both cases, the daily news media were full of harrowing stories of corporate and personal bankruptcies every day for several years.
Double-digit unemployment is something you have to actually live through to appreciate its effects on society.
I can’t see either of the two main political parties sittting back and letting Joseph Schumpeter’s ‘creative destruction’ do its work, like they did in the 1980s and 1990s.
(In short: Schumpeter’s ‘creative destruction’ idea is that recessions are a necessary and useful mechanism to let inefficient and unproductive companies die, and let new, more innovative, more efficient, more productive companies rise to take their places. That’s the upside. The downside is bank losses, bank runs and failures, and massive social upeaveal with high unemployment that lasts years.)
Money not a problem
Most western governments are going to be restrained by their already large deficits and high debt levels.
Australia is different (the ‘lucky country!’) – blessed with seemingly endless rivers of export revenues and taxes from boundless reserves of valuable natural resources the world wants to buy.
Australia is drowning in windfall export revenues and taxes, and is still has relatively low levels of central government debt, so money is unlikely to be a big restraint on spending to support workers/voters, and therefore companies, in recessions.
Conclusions
- 1. The recent sudden doubling of the number of corporate insolvencies makes for scary media headlines, but it is simply a return to historical average levels as the temporary Covid support measures ended.
- 2. Interest rates and unemployment are currently below, and are likely to remain below, the levels that saw insolvencies spike upward in previous economic slowdowns and recessions.
- 3. When (not if) the next deep recession arrives, both major political parties are probably going to take a much more interventionist, supportive approach than in the past deep recession (early 1980s, early 1990s), which is likely to much more favourable, directly or indirectly for companies next time around.
- 4. Unlike most of our peer countries, Australia’s resource riches and relatively low level of central government debt, are likely to enable it to spend up big to fund supportive and expansionist measures in the next recession(s).
Therefore I am relatively bullish on Australian businesses on the whole - recession or not!
See also: