The simple answer is that the Australian share market crashes (and rebounds) because, and when, the US market does.
The US is the largest and most influential market that affects all global markets, asset classes, and investors. What happens on our local market is almost always driven by what happens on Wall Street (with rare exceptions like 1907 and 1951), regardless of local conditions, events, or pricing.
Although the cycles are the same in Australia and the US, the main difference is the extent of the booms and busts – with Australia and the US taking turns in having the bigger boom/bust in each cycle.
See: Australia v US share markets – it’s our turn next!
Therefore, when assessing ‘where are we now’ in the cycle for Australian shares, the starting point is always the US market. See: Why do share markets crash? – Part A: Update on the US.
Here are the same charts for Australia over the same period, covering the past five cycles. The cycles and causes were the same, with minor local variations. The difference is in the extent of the booms and busts in each cycle.
Australia share prices earnings dividends interest rates inflation price earnings ratios dividend yields GDP growth recessions
Looking at recent cycles:
- Australia had a bigger mid-1980s take-over boom and late 1980s property boom, so we had a bigger 1987 crash and 1990-1 recession sell-off.
- The US had a bigger ‘1990s ‘dot-com’ boom, and so it had a bigger ‘2001-2’ tech-wreck’.
- Australia had a bigger 2003-7 China/credit boom, so we had a bigger GFC bust.
In the current cycle, the US has had a bigger ‘tech/online’ boom, and so is destined for a bigger bust.
But when?
Timing
As in the US market, share prices fall before profits fall, and well before economic recessions are announced. Conversely, shares rebound before profits bottom out and start to recover.
In fact, share markets do best in the middle/late stages of recessions, when losses are being reported, dividends are being cut, media headlines are full of bankruptcies and collapses, and economies are contracting.
For example - the great share market surges out of the middle of economic contractions and recessions in 2020-1, 2009, 1991, 1982-3, and numerous prior cycles. (Australia’s best ever year, 1983, was out of the middle of recession).
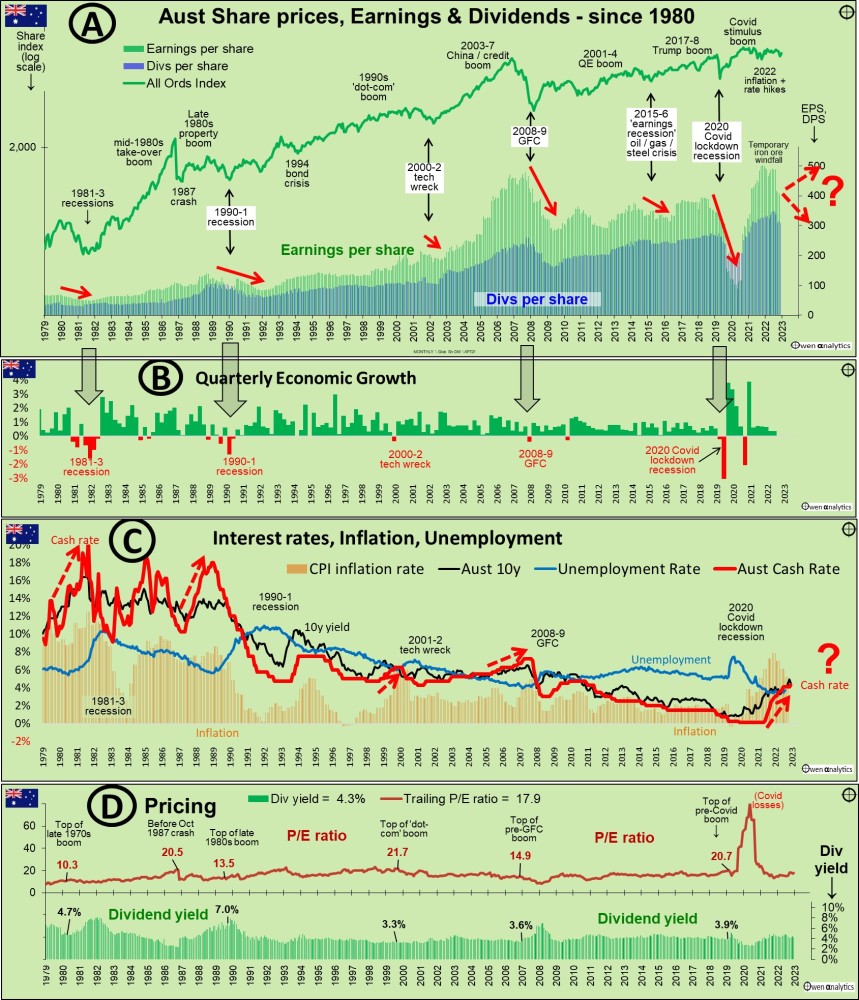
A: Prices, earnings, dividends
Chart A shows the All Ordinaries price index. The bars in the lower section of Chart A show aggregate profits (earnings per share) (blue bars), and dividends per share (green bars).
The big share market falls start BEFORE profits and dividends are cut (red arrows). Likewise, share prices start to rebound BEFORE profits and dividends start to recover.
B: Economic growth and Recessions
Chart B shows quarterly economic growth rates, highlighting the major contractions and recessions. Economic recessions start AFTER cuts to profits and dividends start. Dividends are usually still being cut well after share prices have started to recover.
C: Macro factors
Chart C shows the main ‘macro factors’ - inflation (orange bars), cash rates (red line), bond yields (black line), and unemployment (blue line).
Each economic recession occurred after periods of rising inflation and interest rates. In most cases, inflation and interest rates had been rising for some time, and it was the late-stage rate hikes that triggered the collapses in share prices, spending/revenues, profits, economic growth, and employment - in that order.
D: Market pricing
Chart D shows two common measures of stock market pricing: ‘price/earnings’ ratios (maroon) and dividend yields (green). These are not as critical as many people think.
Share markets can crash when pricing is expensive or cheap, so high pricing does not mean a crash is imminent. The market can remain expensive, and become even more expensive, for years before finally crashing.
The current overall market price/earnings ratio of around 18 times earnings (as at late November 2023) is above historical average, and is around the same as prior to four out of the past five crashes that preceded recessions, and also prior to the October 1987 crash.
In contrast, the US market price/earnings ratio of 25 is much more expensive relative to Australia, and also relative to historical averages for the US market.
However, share markets do not fall when, or because they are expensive. The ‘moderate’ pricing in Australia and the US just before the GFC did not prevent the share markets from collapsing.
As in the US, the reason is that the ‘e’ (earnings) are often fudged, inflated, and/or unstainable in booms, so the price/earnings ratio is artificially and deceptively low and under-states the true level of over-pricing.
See also:
US ‘Shiller/CAPE’ ratio It’s flashing orange. . . but what action should we take?
Australian share market ‘Shiller/CAPE’ ratio – not over-priced like the US. Uncle Sam still calls the tune, but Australia is better placed for growth
Dividend yields
As in the US, dividend yields are often a better measure of value than p/e ratios, because dividends are hard cash, whereas reported ‘profits’ are very rubbery and easily fudged by accounting trickery.
The current dividend yield of 4.3% is around historical averages for the local market, whereas the current dividend yield of 1.5% for the US market very low historically, and lower than it was before prior to every crash except the ‘tech-wreck’.
This makes the US market more vulnerable to fall when it does fall (and Australia will follow), as almost all crashes were accompanied by (or triggered by) cash rate hikes, making low dividend yields less attractive as cash rates rise.
Where are we now?
At the far right of Chart A we see aggregate profits and dividends jumped suddenly in 2021 and 2022, but have fallen back some 20% in 2023. This was just the temporary iron ore windfall (BHP, RIO, FMG), rather than an economy wide slump like the 2020 Covid lockdown recession.
In Australia, the price index is no higher than it was a decade and a half ago in the pre-GFC boom, largely because aggregate earnings per share are no higher than they were back then.
(In contrast, the S&P500 index is more than double its pre-GFC level, largely because US earnings per shares have more than doubled).
See: Australian share market has gone nowhere for 16 years? Is it ‘broken’? Has it lost its mojo?
Where to next?
Regardless of local conditions, when (not if) the US market does collapse, our market will fall at the same time, but by less this time. Why?
First, we have a much smaller tech/online sector than the US, which is responsible for the US over-pricing.
Second, we have a much larger resources sector, and this is being supported by strong commodities demand and prices, driven by structural (ie non-cyclical) global spending on infrastructure, military build-ups, the shift to renewables, electric power, and battery storage.
The key question for investors is: assuming iron ore windfall is behind us, are profits going to drift upward (with inflation if nothing else), or are we now at the cusp of the next big collapse in aggregate profits – indicated by the potential red arrow on the right side of Chart A?
What would cause a collapse in profits? The most likely candidate is further rate hikes to attack inflation.
Looking at inflation and interest rate hikes in the past couple of cycles, we see that inflation is higher today, but cash rates are still lower, than they were in the last two cycles:
2008-9 GFC
At the top of the early-2000s boom before the 2008-9 GFC sell-off, the US Fed hiked cash rates 17 times from 1% to 5.25% (the same as now), to kill off inflation that was running above 4% by late 2007. US cash rates were held at 5.25% for a year while inflation fell from above 4% back below the 2% target.
Those rate hikes, plus oil prices at $140 per barrel, would have been enough to cause big profits cuts (and economic recession) in the US anyway. Then Lehman hit, turning it into a ‘global financial crisis’.
In Australia, the RBA hiked cash rates 12 times from 4.25% to 7% (a good deal higher than today) to kill off inflation that was running at 5% (lower than it is today).
2001-2 ‘tech wreck’
At the top of the late 1990s ‘dot-com’ tech boom before the 2001-2 ‘tech wreck’ sell-off, the US Fed hiked cash rates from 4.75% to 6.5%, to kill off inflation that was running at 5%.
Even though it was ‘only’ a narrow tech bubble that didn’t really affect other ‘real companies’ with ‘real earnings’ in the ‘real economy’, the collapse of the speculative tech stocks managed to bring down the entire S&P500 market.
Aggregate profits in the US fell by -55%, the S&P500 index fell by -46%, and it caused an economy-wide recession. A lot of damage from a relatively narrow tech bubble.
In Australia, the RBA hiked cash rates to 6.25% (higher than today) to kill inflation that was running at 6% (similar to today). The local market had a much milder ‘tech-wreck’ than the US, but the All Ords still took more than two years to recover.
(Our biggest so-called ‘tech’ stocks were Telstra and News Corp, believe it or not. Both were vastly over-priced at the time, and have never recovered since).
Current tech boom
The current tech boom is similar to the late 1990s tech boom in many respects. Once again it is also much larger in the US than Australia (‘We do rocks’).
The fact that it only affects speculative stocks in one corner of the market does not mean that it cannot bring down the US entire market, and the US economy with it, like it did last time.
Most important are cash rates, inflation, and pricing – in the US primarily, and also in Australia.
Current inflation and cash rates
US market
In the US, cash rates have been hiked to 5.5%, but inflation on various measures (‘CPI’, ‘core’, ‘PCE’) are all still running above target, and above what they were in the past few cycles. Inflation expectations are creeping into wage rises.
Cash rates are probably going to be raised further and/or retained flat for an extended period, and probably a good deal higher/longer than what is supporting the current share market pricing.
The current hopes of rate CUTS soon are probably going to end in disappointment. Rates would only be cut when inflation drops back below 2% - and the most likely cause would be a broad economic recession, which would bring big cuts to profits and share prices.
Cash rates certainly are not going to return to the post-GFC and post-Covid ultra-low levels that many people started to take for granted.
Australian market
Inflation is significantly higher than the US but cash rates are significantly lower. Inflation expectations are also creeping into wage rises.
Although our floating rate mortgage mix makes rate hikes more potent in reducing spending than they are in the US, our centralised industrial relation regime, especially with Labor’s regressive industrial relations agenda, is more prone to a wage-price inflation spiral.
New RBA governor Michelle Bullock is certainly sounding a lot like US Fed chief Jerome Powell in setting the scene for cash rates to be higher for longer, in order to bring inflation back to target.
Where are cash rates heading?
The answer is in Chart C above. Throughout past cycles, cash rates (red line) have been consistently higher than inflation (orange bars).
In order to keep inflation in check, cash rates should be higher than inflation by the rate of growth in real output for the economy. Ie:
- Long-term average nominal cash rates = long-term average inflation + long-term average real GDP growth.
While we can debate whether long-term real GDP growth will be say 3% (historical average for Australia, most of which has been population growth), or lower at say 2% (eg because of lower productivity growth), it still means cash rates should be at least 2% higher than inflation.
First of all, cash rates are still lower than current inflation. In past cycles, Chart C shows that cash rates have had to be increased to well above inflation to bring down inflation (usually by causing a collapse in demand in broad recessions/slowdowns).
Second, even when inflation is back to target levels (2-3% range in Australia), cash rates will still need to be 2-3% higher than inflation – ie say at 5-6%.
Cash rates are not going to be falling – except temporarily in a recession. The era of ultra-low cash rates is over.
See: Australia -v- Rest of the World on inflation and interest rates
US pricing still stretched
With US profits running well above sustainable trend, and US share prices at elevated multiples of those elevated profits, the US market (and therefore Australia, even though it is not over-priced) is highly vulnerable.
Not as extreme as it was at the end of the 1990s tech bubble, but there is no margin for error, therefore any shock out of left field could trigger a big sell-off.
Conclusions
Our conclusions from the Australian market are the same as for the US market – with a couple of additions:
- Recessions do NOT cause or trigger share market sell-offs. (for example, Australia avoided a ‘recession’ in 2008-9, but our GFC sell-off was still more severe and took a lot longer to recover than the US market, which did suffer a deep, sustained recession)
- Nor do share markets crash because, or when, they become expensive. Share markets can run over-priced for years before finally collapsing.
- Share markets fall when US investors in US shares en masse suddenly start to expect imminent big cuts to profits and dividends in the US market. When the US share market falls, the Australian market will also fall, albeit less heavily if less over-priced, regardless of local conditions, events, and pricing.
- Economic growth numbers (including ‘recessions’) are outcomes, not inputs or drivers of share prices.
- Share markets do not settle smoothly and calmy at ‘fair pricing’ – they lurch from over-priced booms to over-sold busts and back again, driven by human emotion, not calm, rational ‘optimising’ behaviour.
- Share market crashes are actually a good thing for long term investors! Since the local market is not expensive at current levels, the next US-led sell-off will present even more bargains here than in the US.
As I concluded in the US side of this story, rather than spending time trying to pick the timing for market ups and downs, it is usually better to spend the time making sure our ‘buy list’ of target companies is up to date and ready to be actioned when the next broad sell-off arrives.
See also:
Why do share markets crash? – Part A: Update on the US.
Australian share market ‘Shiller/CAPE’ ratio – not over-priced like the US. Uncle Sam still calls the tune.
US ‘Shiller/CAPE’ ratio It’s flashing orange. . . but what action should we take?
US profits - recession or rebound? - Where are we now?
Australia v US share markets – it’s our turn next!
Australia -v- Rest of the World on inflation and interest rates
‘Till next time – happy investing!
Thank you for your time – please send me feedback and/or ideas for future editions!