Australia and Australians loaded up on debt in the GFC and again in Covid, but how do we stack up against other countries? How do we rate on:
- - Government debt?
- - Corporate debt?
- - Household debt?
Is debt good or bad? When does it become a problem?
The answers are probably very different to what you may have thought.
Australia’s overall debt levels remain low relative to most of our peers and trading partners. Very few countries have lower overall debt loads than Australia – notably: New Zealand, Germany, and India.
Although we have relatively low levels of debt overall, our mix of debt is very different to our peers, and therein lie some real challenges for Australia.
Today’s chart shows debt as a percentage of national income (GDP) for the main countries.
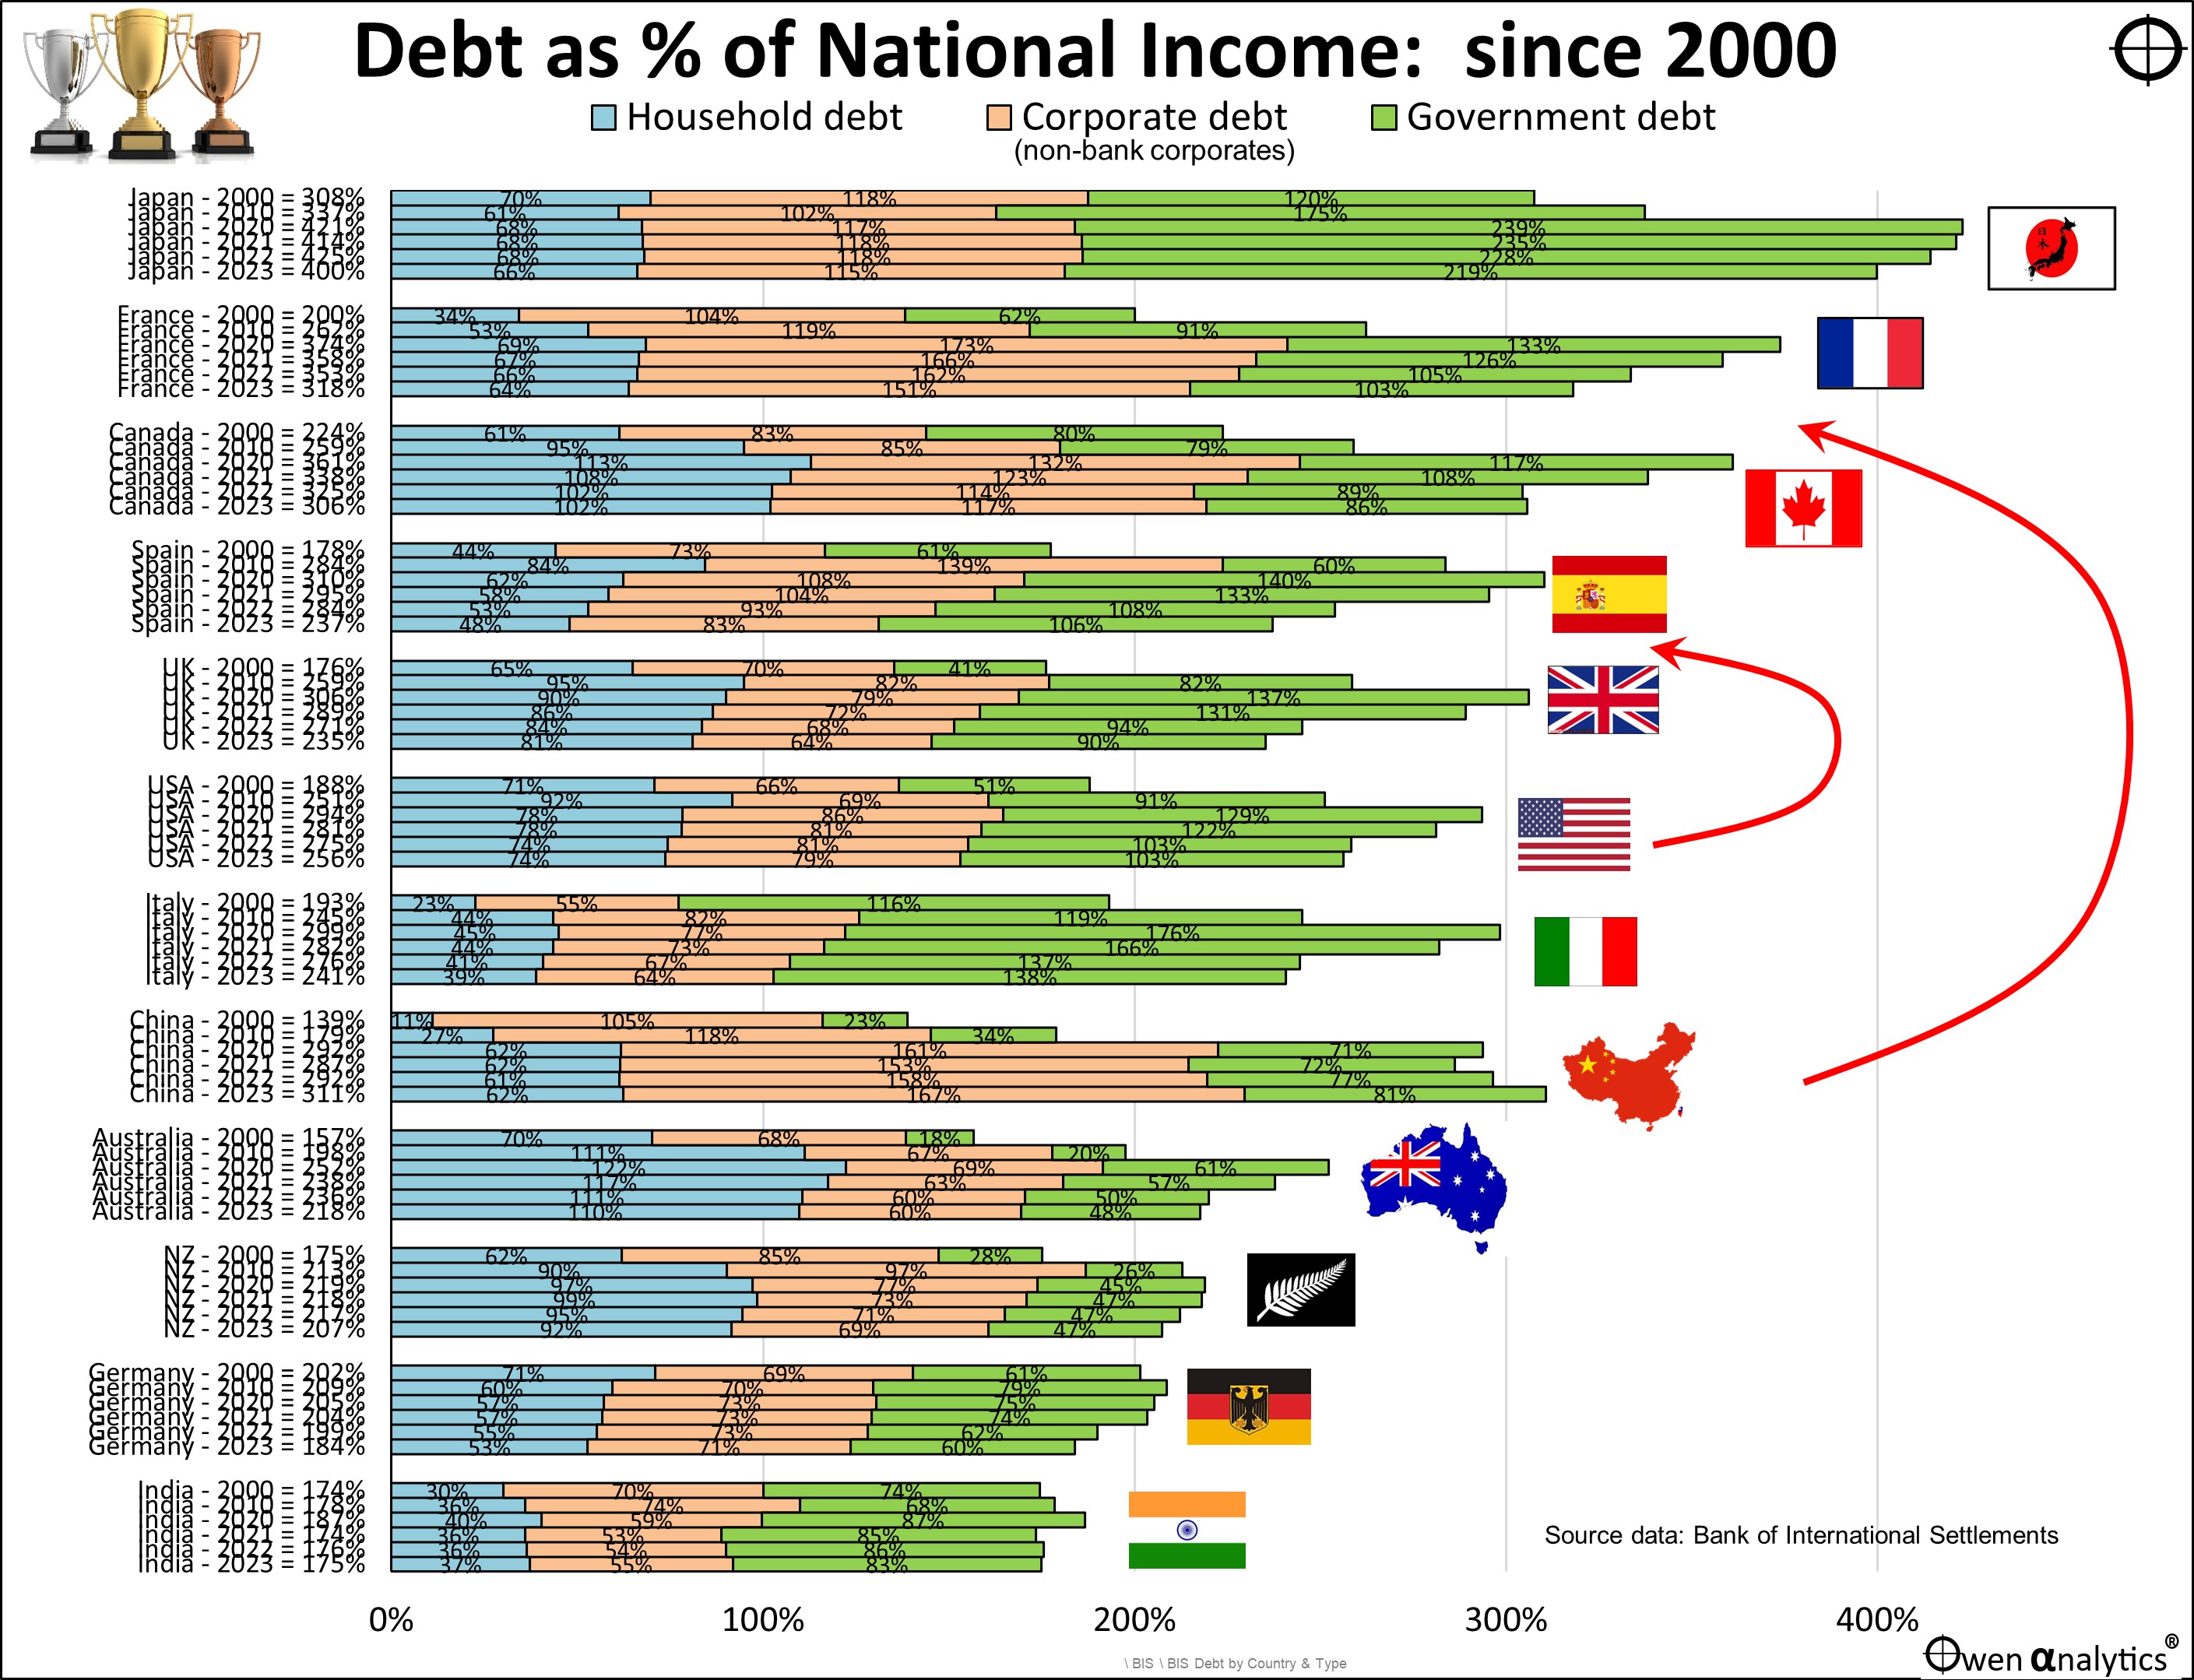
Each country has six bars representing six snapshots in time:
- The top bar was the position in 2000 – at the top of the late 1990s tech boom,
- 2010 - after the debt-build-up in the 2000s credit boom, and the hand-outs and bailouts in the GFC,
- 2020 - after the government deficit spending binges and bailouts in the Covid lockdown recession,
- 2021 – prior to the rate hikes to tackle runaway inflation,
- 2022 – during the rate hikes,
- 2023 (the most recent data)
Each bar has three sections representing the main types of debt:
- household debt (blue),
- non-bank corporate debt (pink), and
- government debt, including all levels of government (green).
Dramatic build-up of debt over past 25 years
The most striking feature in the chart is the dramatic build-up of debt loads from 2000 to 2010 and then to 2020 - indicated by the top three bars for each country.
These were the ‘Greenspan put’ years of ultra-low interest rates following the end of the late 1990s tech bubble, and then further ultra-low interest rates and money printing following the 2008-9 GFC. The largest contributors to these increases in overall debt loads during these decades were government debts (green bars).
The only exceptions to this trend were our frugal friends at the bottom of the table: NZ, Germany, and India.
Those wonderful days of low inflation and ultra-low interest rates are over. Borrowers must now service and refinance those debts at much higher interest rates.
Post-GFC debt binge
The seemingly obvious lesson from the GFC was to avoid excessive debt, but nobody was listening! Far from ‘de-leveraging’ after the shock of the GFC, households, companies and governments everywhere loaded up on cheap debt in the post-GFC, ‘QE’ years.
Then, when governments locked whole nations of citizens in their homes and out of their workplaces in 2020-1, debt levels rose rapidly again with the deficit spending sprees, ultra-low interest rates, and cheap lending programs specifically designed to encourage everyone to take on even more debt!
What could possibly go wrong?
Massive debts racked up on temporary, artificial, ultra-low, zero/negative interest rates, at the same time as huge, wartime-like, expansionary, debt-funded deficit spending sprees by governments! The inevitable result?
Surprise, surprise: inflation and asset bubbles inflated by mountains of cheap debt!
The inflation spike ended the era of QE and ultra-low rates, and triggered the start of aggressive rate hikes, asset price corrections, and inevitable bankruptcy crises that are now only just starting.
Debt loads on the way down post-Covid
The good news is that every country except China has managed to reduce their debt loads (relative to national income) since the 2020 peak debt levels. This has been mainly via inflation, plus economic growth (to a lesser extent), rather than reducing actual debts (governments rarely pay off or even reduce debt – much easier to just inflate it away!)
Wooden spoon – Japan still
In terms of total debt loads, Japan retains the wooden spoon by a big margin. Japan is locked in a death spiral – literally – with ever-increasing welfare bills for its aging population, declining workforce, shrinking tax-payer base, and contracting total population.
Japan cannot reverse this spiral. However, as more than 90% of Japanese government debt is owed by Japanese pension funds, institutions, and arms of government including the BOJ, the problem will probably be solved via ‘internal’ defaults / restructures where Japanese pensioners end up paying the price in the form of lower pensions.
No need to go cap in hand to external creditors, which is what the US will need to do. (Trump has a solution to this - see below).
Big movers
The big mover in recent years has been China, which has jumped up the table to third highest total debt load relative to GDP, overtaking UK, Spain, USA, Italy, and now Canada.
In China, although much of the debt is labelled ‘corporate’, in reality most is state-controlled entities, propped up by endless rounds of refinancing into the never-never by state-controlled banks, terrified of the social unrest that may be unleashed if unprofitable ‘zombie’ companies were allowed to collapse.
U.S. of A.
The other big mover up the table – in relative terms – is the USA. While most other countries have reduced their debt to GDP ratios significantly since their 2020 Covid peak, the US has not, mainly because the Biden government is literally spending like there’s no tomorrow, with no end in sight for its deficit spending spree.
Who knows what Trump will do if he gets into the White House again. He has already announced promises of dramatic increases in protection, plus more tax cuts. Before the 2016 election Trump even raised the prospect of the US defaulting on foreign debt. He had four years to do that but didn’t.
Whether it is Biden or Trump, it seems we are now into a global competitive protection race across North America, Europe, and Asia, funded by endless government hand-outs and subsidies to appease increasingly fragmented and populist voters.
Will the US run out of credit? – probably not in the near term. Bill Clinton got smacked by the bond market in 1994 and was forced to rein in deficits (and he even ended up producing the only US government surpluses since Eisenhower). Britain’s Liz Truss got smacked by the bond market in 2022, and was forced to reverse her plans for big spending and tax cuts.
We can probably expect more of this if the deficit spending sprees continue. With fiat paper currencies, governments can just print more money to service and refinance debts, but bond investors set the price (the interest rate or 'yield' they demand).
Government debt not necessarily a problem
High government debt loads are not necessarily a problem for governments. There are plenty of examples of highly indebted governments growing and/or inflating their way out of debt.
High debt loads can be managed successfully (as they were by the US and Australian governments following WW1 and WW2 debts, for example), as long as three conditions are present:
- Strong economic growth (to ‘grow their way out of debt’) – but economic growth rates are likely to be slow for many years, with poor productivity growth, low levels of investment, aging demographics, rising protectionism, increasing government intervention and distortions of capital allocation, expensive energy transitions.
- Low interest rates (to service debts and refinance maturing debts) - eg the ‘financial repression’ in the 1950s – but interest rates are likely to remain higher than they have been in recent decades due to protectionism, trade wars, supply chain re-adjustments, wage inflation.
- Primary surpluses (to service debts and pay down debts) – likely to be politically very difficult to achieve – with populist pressures to increase spending and cut taxes. Australia is a rare exception.
Australia’s Government debt
Australia had virtually no federal government debt going into the GFC but the government quickly racked up debt to finance the GFC deficit spending sprees. Government deficits were reduced back to zero by 2019, but soared again to fund the Covid deficit spending sprees.
Other countries everywhere also racked up debt in the GFC and Covid, but Australia’s government debt levels are still the lowest in the world (even including state debts), thanks to windfall mining tax revenues in the long post-2001 mining/China boom.
(New Zealand remains a fraction lower than Australia. NZ has fewer levels of government, no upper house, but also none of Australia’s windfall mining revenues. Only some petro-states have lower debt to GDP loads than NZ and Australia).
Australia’s Corporate debt
Corporate debt levels in Australia have shrunk in recent decades. The big banks used to specialise in business lending but they are now just bloated building societies. They much prefer mortgage lending over business lending because it requires half the capital and a fraction of half the brains.
The low level of corporate borrowing is a real policy problem for Australia. Companies are the engine room for employment, productivity, and economic growth, but the big dinosaur banks have long since lost the skill and will to lend to business.
There is a booming new industry in ‘private debt’ (also called ‘private credit’), including direct lending by industry funds.
'Private debt/credit' is just a fancy name for 'non-bank lending'. This is being done without the equity buffer of bank balance sheets, without scrutiny or regulatory supervision, and without the credit management systems, collections, and work-out skills the banks used to have.
It will take decades for the new ‘private debt/credit’ industry to get up to the standard the big banks once had. (Spoiler alert: lending money is easy; pricing for risk and getting the money back in a recession is a lot harder.)
Australia’s Household debt
Australia is the perennial winner of the wooden spoon for the highest level of household debt relative to national income (only Switzerland is higher). Well before the GFC, Australia had the highest levels of household debt in the world, and has increased its ‘lead’ even further since then.
Our high household debt levels, combined with the fact that the majority is on floating interest rates, plus the so-called ‘mortgage cliff’ of refinancing short term fixed-rate loans written at temporarily low rates under RBA’s ill-advised and misleading announcements on not raising rates for three years, and the RBA’s ultra-cheap funding programs, makes Australian households (and the overall economy) more sensitive than any other country to the negative impacts of interest rate hikes.
Why don’t we have the cheapest housing in the world?
Australia should have the most affordable land and housing in the world for three reasons:
- We have the sparsest population in the world (ie we have the most land per person: an average of 298,000 square metres, or 74 quarter-acre blocks, per head of population). True, much of the land is uninhabitable, but Australia’s habitable land ratio is higher than Norway, Canada, and Japan.
- We have an abundance of cheap building materials (dirt, rocks, timber).
- We have giant, lazy, well-capitalised banks that do almost nothing but lend on housing! (actually, therein lies a big part of the problem).
But somehow, we have the most expensive housing in the world, propped up by the highest levels of household debt in the world.
Fortunately for highly indebted borrowers, house prices have been kept relatively high by strong demand (mainly from immigration) and by intractable supply constraints (‘NIMBYs’, local councils, and high taxing state governments).
A looming housing /debt crisis? Probably not yet
As long as house prices are kept relatively high (by immigration, NIMBYs, and property taxes), and unemployment remains below say 10% (unemployment reached 10.4% in the early 1981-3 recession, 10.9% in the 1990-1 recession, but only 5.8% in the GFC), another widespread housing/ foreclosure/ bankruptcy crisis is unlikely here in the current cycle.
Medal summary:
- Australia and NZ share gold medal for Government debt. (In the case of Australia, a big assist from China for its enormous appetite for our dirt and rocks).
- Australia takes Wooden Spoon for Housing debt (we have a mortgage on this – literally).
- Australia also takes Wooden Spoon for Corporate debt.
‘Till next time – happy investing!
Thank you for your time – please send me feedback and/or ideas for future editions!