Key points:
-
-
- Most share markets, especially the US, appear very over-priced on traditional valuation metrics like P/E ratios, dividend yields, price/book ratios.
- Here I look at two valuation methods that take into account different earnings growth rates to arrive at a fair price for growth.
- Using ‘PEG’ ratios - Australia has the 2nd highest (most expensive) PEG ratio in the world.
- US PEG ratios are better, but still too high (too expensive) even with the US market’s superior profit margins, returns on equity, earnings & dividend growth rates.
- Using Ben Graham’s ‘8.5 rule’ for valuing share markets, the US is around fairly priced given its superior profit growth rates, profit margins, ROE, and low dividend payout rates.
- Japan and India also come up well on the ‘8.5 rule’ valuation. France, Germany, Canada are close.
- However, Australia is much more expensive relative to growth than the US market on the 8.5 Rule due to its very poor earnings per share growth, low profit margins, low ROE, and high dividend payout rates.
- I also outline two sanity checks on these ‘price for growth’ rules: macro and micro ‘supply-side’ limits to sustainable long-term growth.
- Although the US market comes up more or less fairly valued for growth on the PEG ratio and 8.5 Rule, these assume that current higher than usual rates of profit growth and ROE are permanent, but most likely it just another temporary boom that will end just as every other temporary boom before it.
- So even 'US exceptionalism' has been constrained by supply-side limits to growth.
This article is Part 6 in my 6-part series on share market pricing written in August 2025. The articles in this series are:
This series is designed to be read in sequential order, so readers may get more out of today’s article if they have already read the prior articles via the links above.
Also take a look at my explanation in Part 2 of why I do this stuff, and why it is important for long-term investors like me to understand pricing and how it affects subsequent returns and wealth.
The story so far:
Part 1 – painted the overall picture of relative pricing for the 20 largest stock markets in the world – most appeared very expensive, especially the US market.
Part 2 – went into more detail on 3 of the most widely used measures of pricing/valuation – trailing price/earnings ratios, dividend yields, and price-to-book values.
Part 3 – looked at two further measures – forward price/earnings ratios, and forecast earnings growth on which they were based. Here I suggested that, although the US market appears to be the most over-priced, it’s profit growth outlooks are probably more reasonable and achievable than Australia and most other markets.
Part 4 – looked at two key measures of corporate profitability for the same 20 share markets – profit margins and returns on equity. This also suggested that the US market was the most profitable and at least partially justified its higher apparent pricing.
Part 5 – looked at recent trend growth in earnings and dividends per share in each market to better assess the reasonableness and achievability of the growth assumptions built into current pricing. It concluded that, despite the US market appearing very expensive on traditional metrics, it was largely underpinned by strong earnings and dividend growth. Australia on the other hand was probably more over-priced than the US due its very low current and recent growth rates in underlying earnings and dividends.
Today’s article explores ways of assessing what is a reasonable or justifiable price to pay for higher growth in earnings and dividends.
How to put a fair price on growth?
This article looks at two ways to assess how much is a fair price to pay for different rates of growth. Both come from the works of Ben Graham, widely regarded as the ‘father of value investing’ and the ‘father of securities analysis’. He was also Warren Buffett’s professor, first boss, mentor, and lifelong collaborator.
As an aside, whenever I am asked to recommend books for serious investors and finance students, I generally start with these two:
- Ben Graham’s ‘ The Intelligent Investor’ . First published in 1949 (I use the original 1949 edition and 1973 edition, revised 2003),
- Graham & Dodd’s ‘Security Analysis’. First published in 1934 (I use the 5th edition, 1988).
The former is aimed at self-directed individual investors and covers many important aspects of investing and investment markets. The latter has been the bible and daily go-to standard reference for professional equity analysts the world over for many decades. It was, and still is, the basis of much of the equity analysis components of the CFA curriculum. (The CFA Institute and its education programs were originally conceived and designed by Ben Graham and Warren Buffett).
The ‘PEG’ ratio: Price/Earnings relative to expected future Growth
The ‘PEG’ ratio (or ‘PE/G’, or ‘Price/Earnings to Growth’ ratio) is a common rule of thumb that has been used widely by investors for many decades. It is considered more meaningful than the standard price/earnings ratio (outlined in parts 1 and 2 in this series) because the PEG ratio takes into account profit growth for the company or sector or market being measured.
The PEG ratio is calculated by dividing P/E ratio for a company or sector or market, by the growth rate of its earnings for a specified period.
For example, if we have two companies or segments or markets: ‘A’ and ‘B’. Each produces a profit of $5 per share this year, and the price for both is $100 per share, so the price/earnings ratio for both A and B would be 20.
Ordinarily a company or market with a P/E of 20 would be generally considered to be on the expensive side (see Part 1 article).
But what if the earnings per share for A had been growing at an average rate of say 25% per year in recent years, and are expected to continue to grow at similar rates in future? (eg a growth stock or segment or market with sustainable competitive advantages, innovative management, high margins, high returns on equity, monopoly pricing power, few or weak competitors, and plenty of room to grow further).
On the other hand, what if the earnings per share company/market B had been growing at just 5% pa in recent years (ie barely above inflation), and is expected to continue to be no better in future? (eg mature, no competitive advantages, poor management, low margins, low returns on equity, strong competitors, no pricing power, and/or no more room to grow).
Both A and B have the same price/earnings ratio of 20 (priced at $20 per $1 of earnings), but clearly the fair value of A would probably be far greater than B. The PEG ratio is a handy way to take account of different rates of growth.
The PEG ratio for A would be 0.8 (P/E of 20 divided by annual growth rate of 25 – ignoring the percent sign).
The PEG ratio for B would be 4.0 (P/E of 20 divided by annual growth rate of 5 – ignoring the percent sign).
What PEG ratio is ‘fair’, or expensive, or cheap?
Generally, a PEG ratio of between around 1 to around 1.5 is usually considered ‘fair value’’. A PEG ratio above 2 is generally seen as too expensive, and below 1 is cheap. Actually, Ben Graham proposed looking for companies with PEG ratios below 0.6, in order to allow for a sufficient margin of safety (yes, they are out there!)
In our example above, clearly A is worth more than B per dollar of earnings because of A’s superior growth if the growth rate is sustainable. Although both have a P/E ratio of 20, ‘A’ is probably fairly good value, but ‘B’ is probably significantly over-priced, even though both have a P/E of 20.
These threshold cut-off levels for cheap-fair-expensive depend of course on the particular industry or segment or market we are looking at. That is why it is more of a ‘relative’ tool – to compare the relative value of different companies or markets, rather than an ‘absolute’ measure of value.
Although the PEG ratio is still a fairly rudimentary measure, it is more instructive and useful than the regular P/E ratio because it takes account of different rates of expected growth. The PEG ratio is also the basis of a common strategy known as ‘GARP’ (‘Growth at a Reasonable Price’).
Which growth rate to use for the PEG ratio?
In calculating PEG ratios for share markets (or companies), we need to decide what rate of earnings per share growth to use. Ordinarily I would use a standard period like say three to five years (Graham prefers three years). A one or two-year period would be too short because of the short-term volatilities. In most circumstances, three years probably still has a significant element of cyclicality in it, whereas a five year period generally gets closer to smoothing out cyclical impacts, so I personally prefer five years.
Why five years? The assumption is that if the earnings generating engine of a company or market has delivered a particular rate of earnings per share growth over the last five years, through all sorts of changes (political/management regimes, interest rate cycles, commodities cycles, tax changes, etc), then there is a fairly good chance that this rate of growth should be sustainably at similar sorts of rates in the next few years or so.
However, if I used a five year period for this exercise (in mid-2025), that would put the starting point at right in the middle of the big cuts to profits and dividends in the Covid lockdown crisis in 2020, and that would distort the picture significantly. Therefore, for this exercise, I use the average annual rate of growth in aggregate earnings per share since the end of 2019, which is 5.5 years to mid-2025.
The critical assumption here is that the growth rate that the company market had achieved over the past five years is more or less sustainable into the future. After all, we are paying for future growth, not past growth. It is impossible to forecast the future of course, so this is best used as a relative tool for ranking different companies or markets, not a forecast tool.
Which P/E to use – ‘Trailing’ or ‘Forward’?
We could use the trailing P/E ratio (pricing based on most recent actual reported earnings) or the forward (or ‘prospective’) P/E ratio (pricing based on expected next year’s earnings). Each has merit; however it is useful to note Ben Graham’s warning about using analysts’ consensus earnings forecasts:
‘Investing your money on the basis of what these myopic soothsayers predict for the coming year is as risky as volunteering to hold up the bulls-eye at an archery tournament for the legally blind.’
(Benjamin Graham, ‘The Intelligent Investor’, 4th edition, 1973, revised 2003, page 274).
Chart 10 – PEG ratios: Price/Earnings relative to Growth
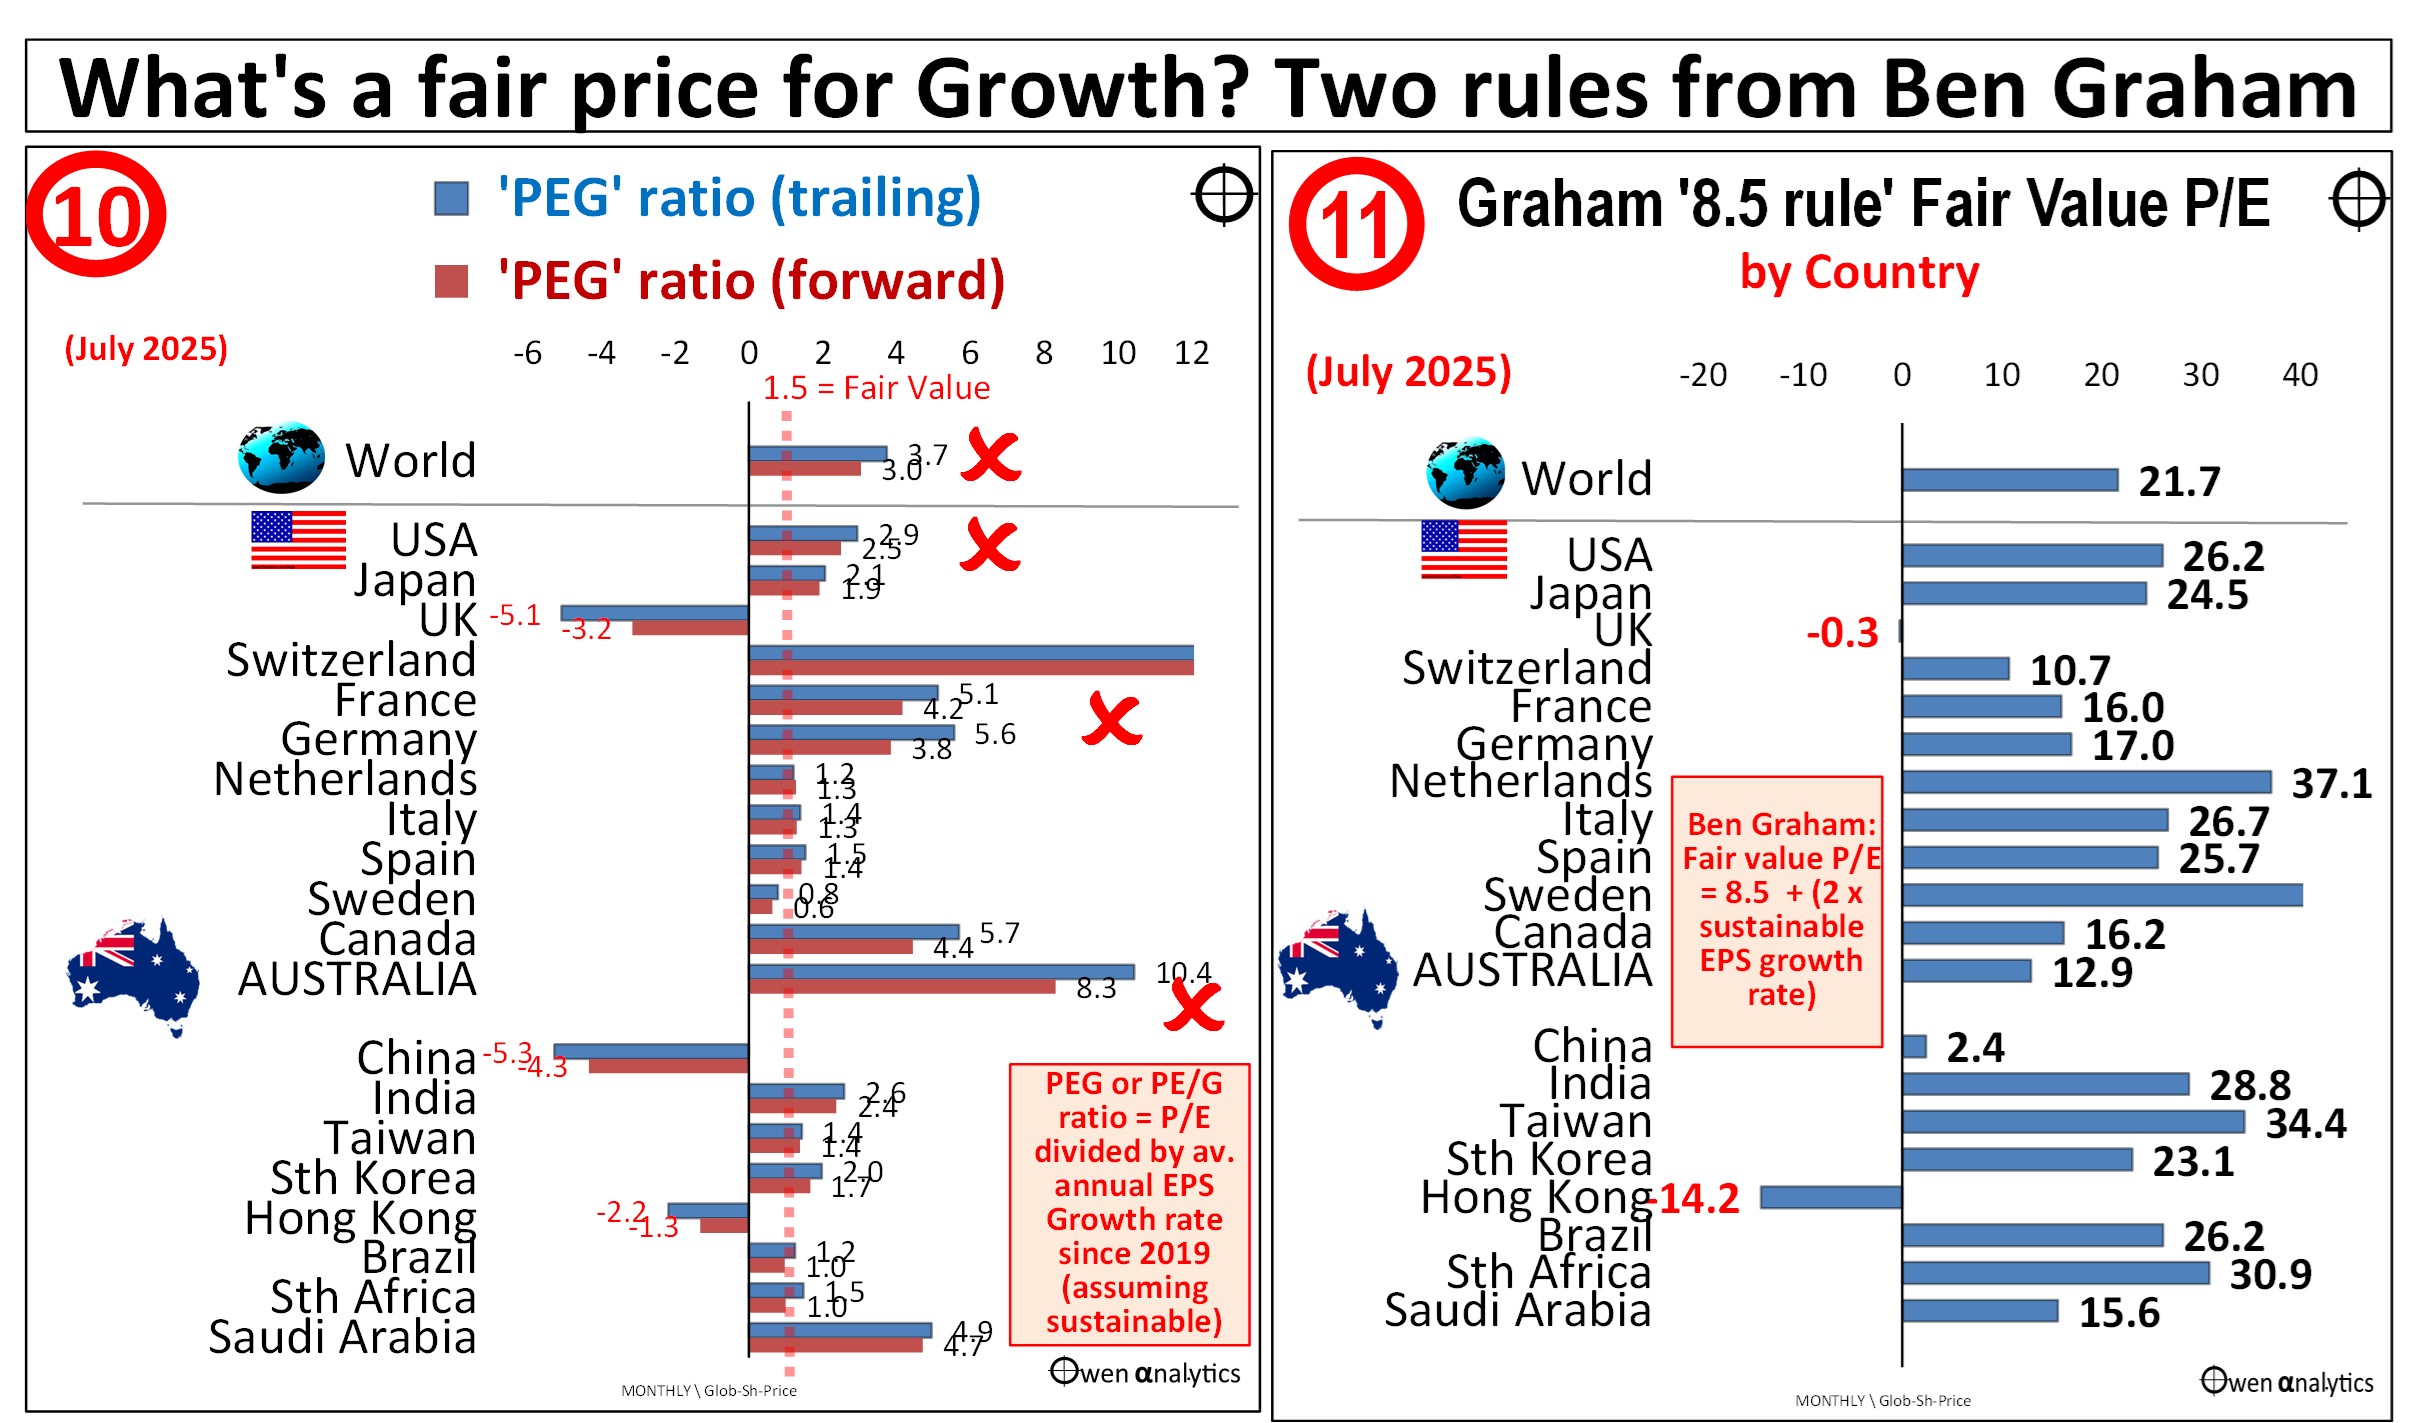
Chart 10 shows two PEG ratios for each of the 20 main share markets – one using the trailing price/earnings ratio (blue bars), and the other using the forward price/earnings ratio (maroon bars).

The overall world share market is on a PEG of 3.0, which is well above the usual upper bound of ‘fair value’ (around 1.5 or 2), so it is likely to be expensive regardless of how debates may differ on the underlying details and assumptions.
The US market is on a PEG ratio of 2.9 (using trailing P/E) or 2.5 (prospective P/E), which are also well above fair value range for PEG ratios.
The US market probably does deserve higher pricing relative to earnings than other markets because it has delivered reasonably good profit margins and very high returns on equity (charts 6 & 7 in Part 4), and also good growth in profits and dividends a few percentage points ahead of inflation (charts 8 & 9 in Part 5). These would justify a PEG ratio at the high end of the ‘fair value’ range (ie say approaching 2).
However, the current market price of around $26 per dollar of earnings is probably around 50% to 100% more than is justified by the expected growth.
Switzerland
The Swiss share market is the stand-out here with a PEG ratio of around 20. This is because it price/earnings ratio is a rather high 23 times current earnings (see chart 1), but its aggregate earnings per share growth since 2019 has been just 1% pa (chart 8).
Switzerland is home to several fine global companies (including Nestle, Roche, Novartis, ABB, Lonza, Alcon, Richemont, ABB, etc). In aggregate the Swiss market has delivered high profit margins (chart 6) and high returns on equity (chart 7), but profit growth has been lousy over the past five years (chart 8). Aggregate earnings per share for the Swiss market are only 10% higher now than 15 years ago – and that’s before inflation! So, why are global investors pricing the overall Swiss market at more than $23 per $1 of profits?
The only answer is that they are expecting profit growth for Swiss companies in aggregate to miraculously jump from near zero to double-digits starting tomorrow.
Australia
Australia is in a similar boat, with the next highest PEG ratio in the world – ie the highest price being paid per dollar of profits and growth – ie the highest expectations of future profit growth across the market.
The ASX market has delivered lower profit margins than the US (chart 6), much lower returns on equity than the US (chart 7), and almost no growth in aggregate profits and dividends per share since 2019 (charts 8 & 9) - in fact negative real growth after inflation.
The reasons for this very poor (negative real) growth in profits and dividends have been the big problems with the two largest sectors – banks (Hayne, soaring compliance/remediation costs, margin squeeze), and miners (weak commodities prices/demand, declining ore grades, over-supply).
And yet, the ASX market is priced today at $23 per $1 of profits (chart 1).
This is well above Australia’s historical average price/earnings ratio (eg 15.8 median since 1980). Also, Australia’s current dividend yield of 3.2% is also much lower (ie more expensive per dollar of dividends) than its historical average dividend yields (eg median 4.1% since 1980, and 4.0% since franking was introduced in July 1987).
USA
Here we see that the US share market’s superior growth engine does pull it back from being very expensive relative to other markets on traditional measures (part 2), to being middle of the pack on its PEG ratios.
However, PEG ratios for the US share market are still an uncomfortably high 2.9 (using trailing P/E), or 2.5 (forward P/E). This is still well above what would be considered fair pricing for growth, despite its high profit margins and returns on equity (charts 6 & 7), and also relatively high rates of growth in aggregate earnings and dividends per share (charts 8 & 9).
UK, China, and Hong Kong have negative PEG ratios because of their negative growth in aggregate earnings per share since pre-Covid 2019 (and that’s before inflation). Investors need to really have a good reason for believing that their entire markets will suddenly start to grow aggregate earnings again given their deep-seated long-term problems.
Ben Graham’s ‘8.5 rule’ for fair value P/E
This is another useful ‘rule of thumb’ guide to fair value pricing that allows for different rates of growth, described by Ben Graham. He uses this to value whole share markets, not just individual companies.
(Benjamin Graham, ‘The Intelligent Investor’, 1948, 1973 4th edition, revised 2003, page 295. This is a summary of the more detailed method outlined in Graham & Dodd’s ‘Security Analysis’, 1934, 1988 5th edition, p 570-5, which is essentially a supply-side build-up of the Gordon Growth Model, originally proposed by John Burr Williams, ‘The Theory of Investment Value’, 1938).
Under this method:
a fair value price/earnings ratio = 8.5 plus twice the expected annual growth rate
For example, if the average expected sustainable future EPS growth rate = 5% pa,
then the fair value P/E = 8.5 + (2 x 5) = 18.5 times earnings.
This approach is an advance on the simple ‘PEG’ ratio, but it too makes a lot of assumptions – eg it assumes constant average ROEs, pay-out rates, and equity risk premium in future.
What growth rate to use?
To estimate a fair value P/E ratio for each market using Graham’s 8.5 rule, I will use the current running rate for earnings per share growth, which is the average growth rate for aggregate earnings per share since 2019, as set out in chart 8 in Part 5.
The assumption here is that this period included a wide range of major traumas that affected very major country in the world – including the Covid lockdowns, the sharpest and deepest economic recessions since the 1930s, massive waves of unprecedented monetary and fiscal stimulus, the inflation spike, aggressive rate hikes, new wars in Europe and the Middle East, and a rise in political and social unrest in just about everywhere in the world.
Can we extrapolate the current running rates into the future?
If we use average rates of profit growth over this period, with all of its dramas and traumas, it is not unreasonable to use this as a base case running rate that is likely to be sustained at similar types of rates for at least the next few years or so.
We are in an era of populist, interventionist governments running deficits and eager to expand monetary & fiscal stimulus to support demand and prevent widespread unemployment & business failures. On international fronts, we have rising military tensions, rising military spending, and a few military flare-ups. On domestic fronts we have ageing demographics, and increasingly xenophobic and anti-immigration policies.
My base case is that it is not reasonable to assume that these conditions will be with us for some time.
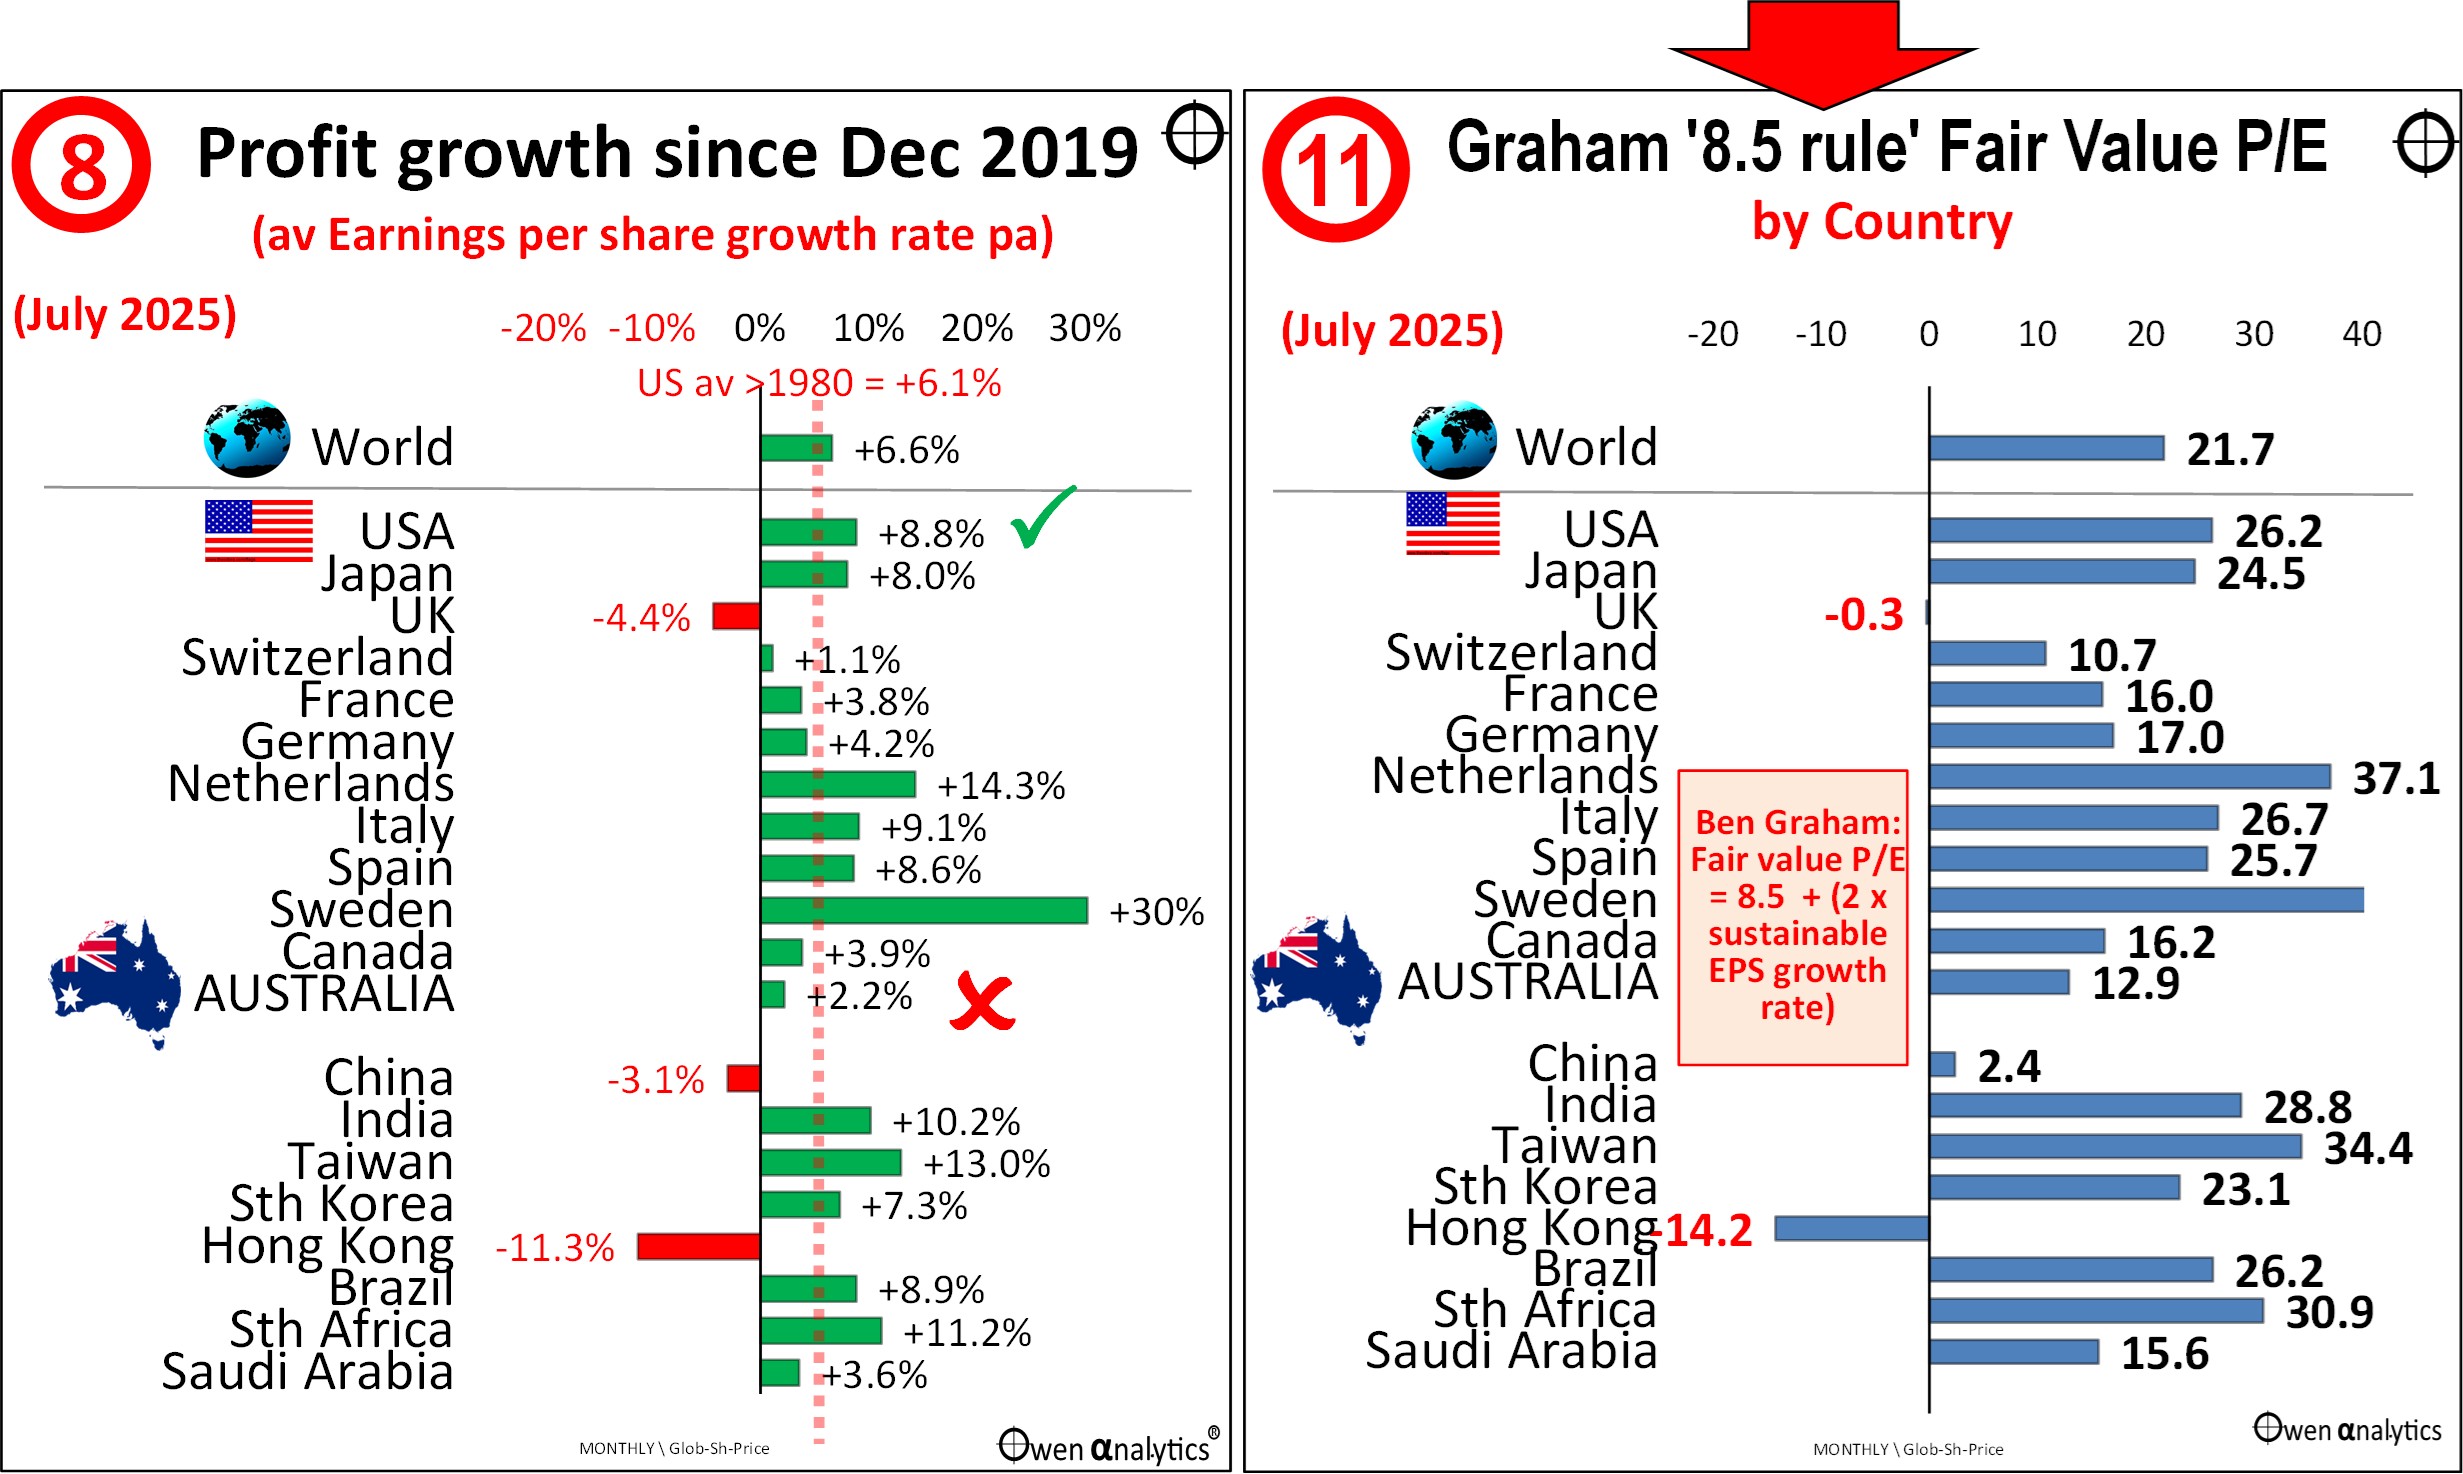
In the next pair of charts – the left chart shows again the currenting running rates for aggregate average earnings per share growth since 2019 (chart 8 from Part 5), and the right chart is the resultant fair value price/earnings ratio for each market under the 8.5 rule (chart 11) –
US
The fair value P/E ratio for the US market using the 8.5 rule is 26.5. This sounds high (expensive), but it is justified by its relatively high running rate of earnings per share growth (assumed to be sustainable in the current conditions) which are generated by relatively high profit margins, high returns on equity, and low dividend payout rates for the US market.
Australia
In contrast, the fair value P/E ratio for the Australian market using the 8.5 rule is just 13. This sounds very low (cheap), but that is all that is allowed due to Australia’s relatively low running rate of earnings per share growth, due to its relatively low profit margins, low returns on equity, and high dividend payout rates.
Current pricing -v- fair value on 8.5 Rule
Finally, we need to take these fair value P/E ratios based on the 8.5 Rule (chart 12 above) and compare them to the current P/E ratios in each market, to see if they are currently over- or under-priced.
The left chart below shows the currenting P/E ratios again (chart 1 from Part 2), and the right chart (chart 12) is the ratio of the 8.5 Rule fair P/E to the current P/E.
A score above 1.0 means it current pricing is above fair value (too expensive relative to underlying growth). A score below 1 is below fair value. A score of 1.0 around 1.0 indicates around fair value at current levels.
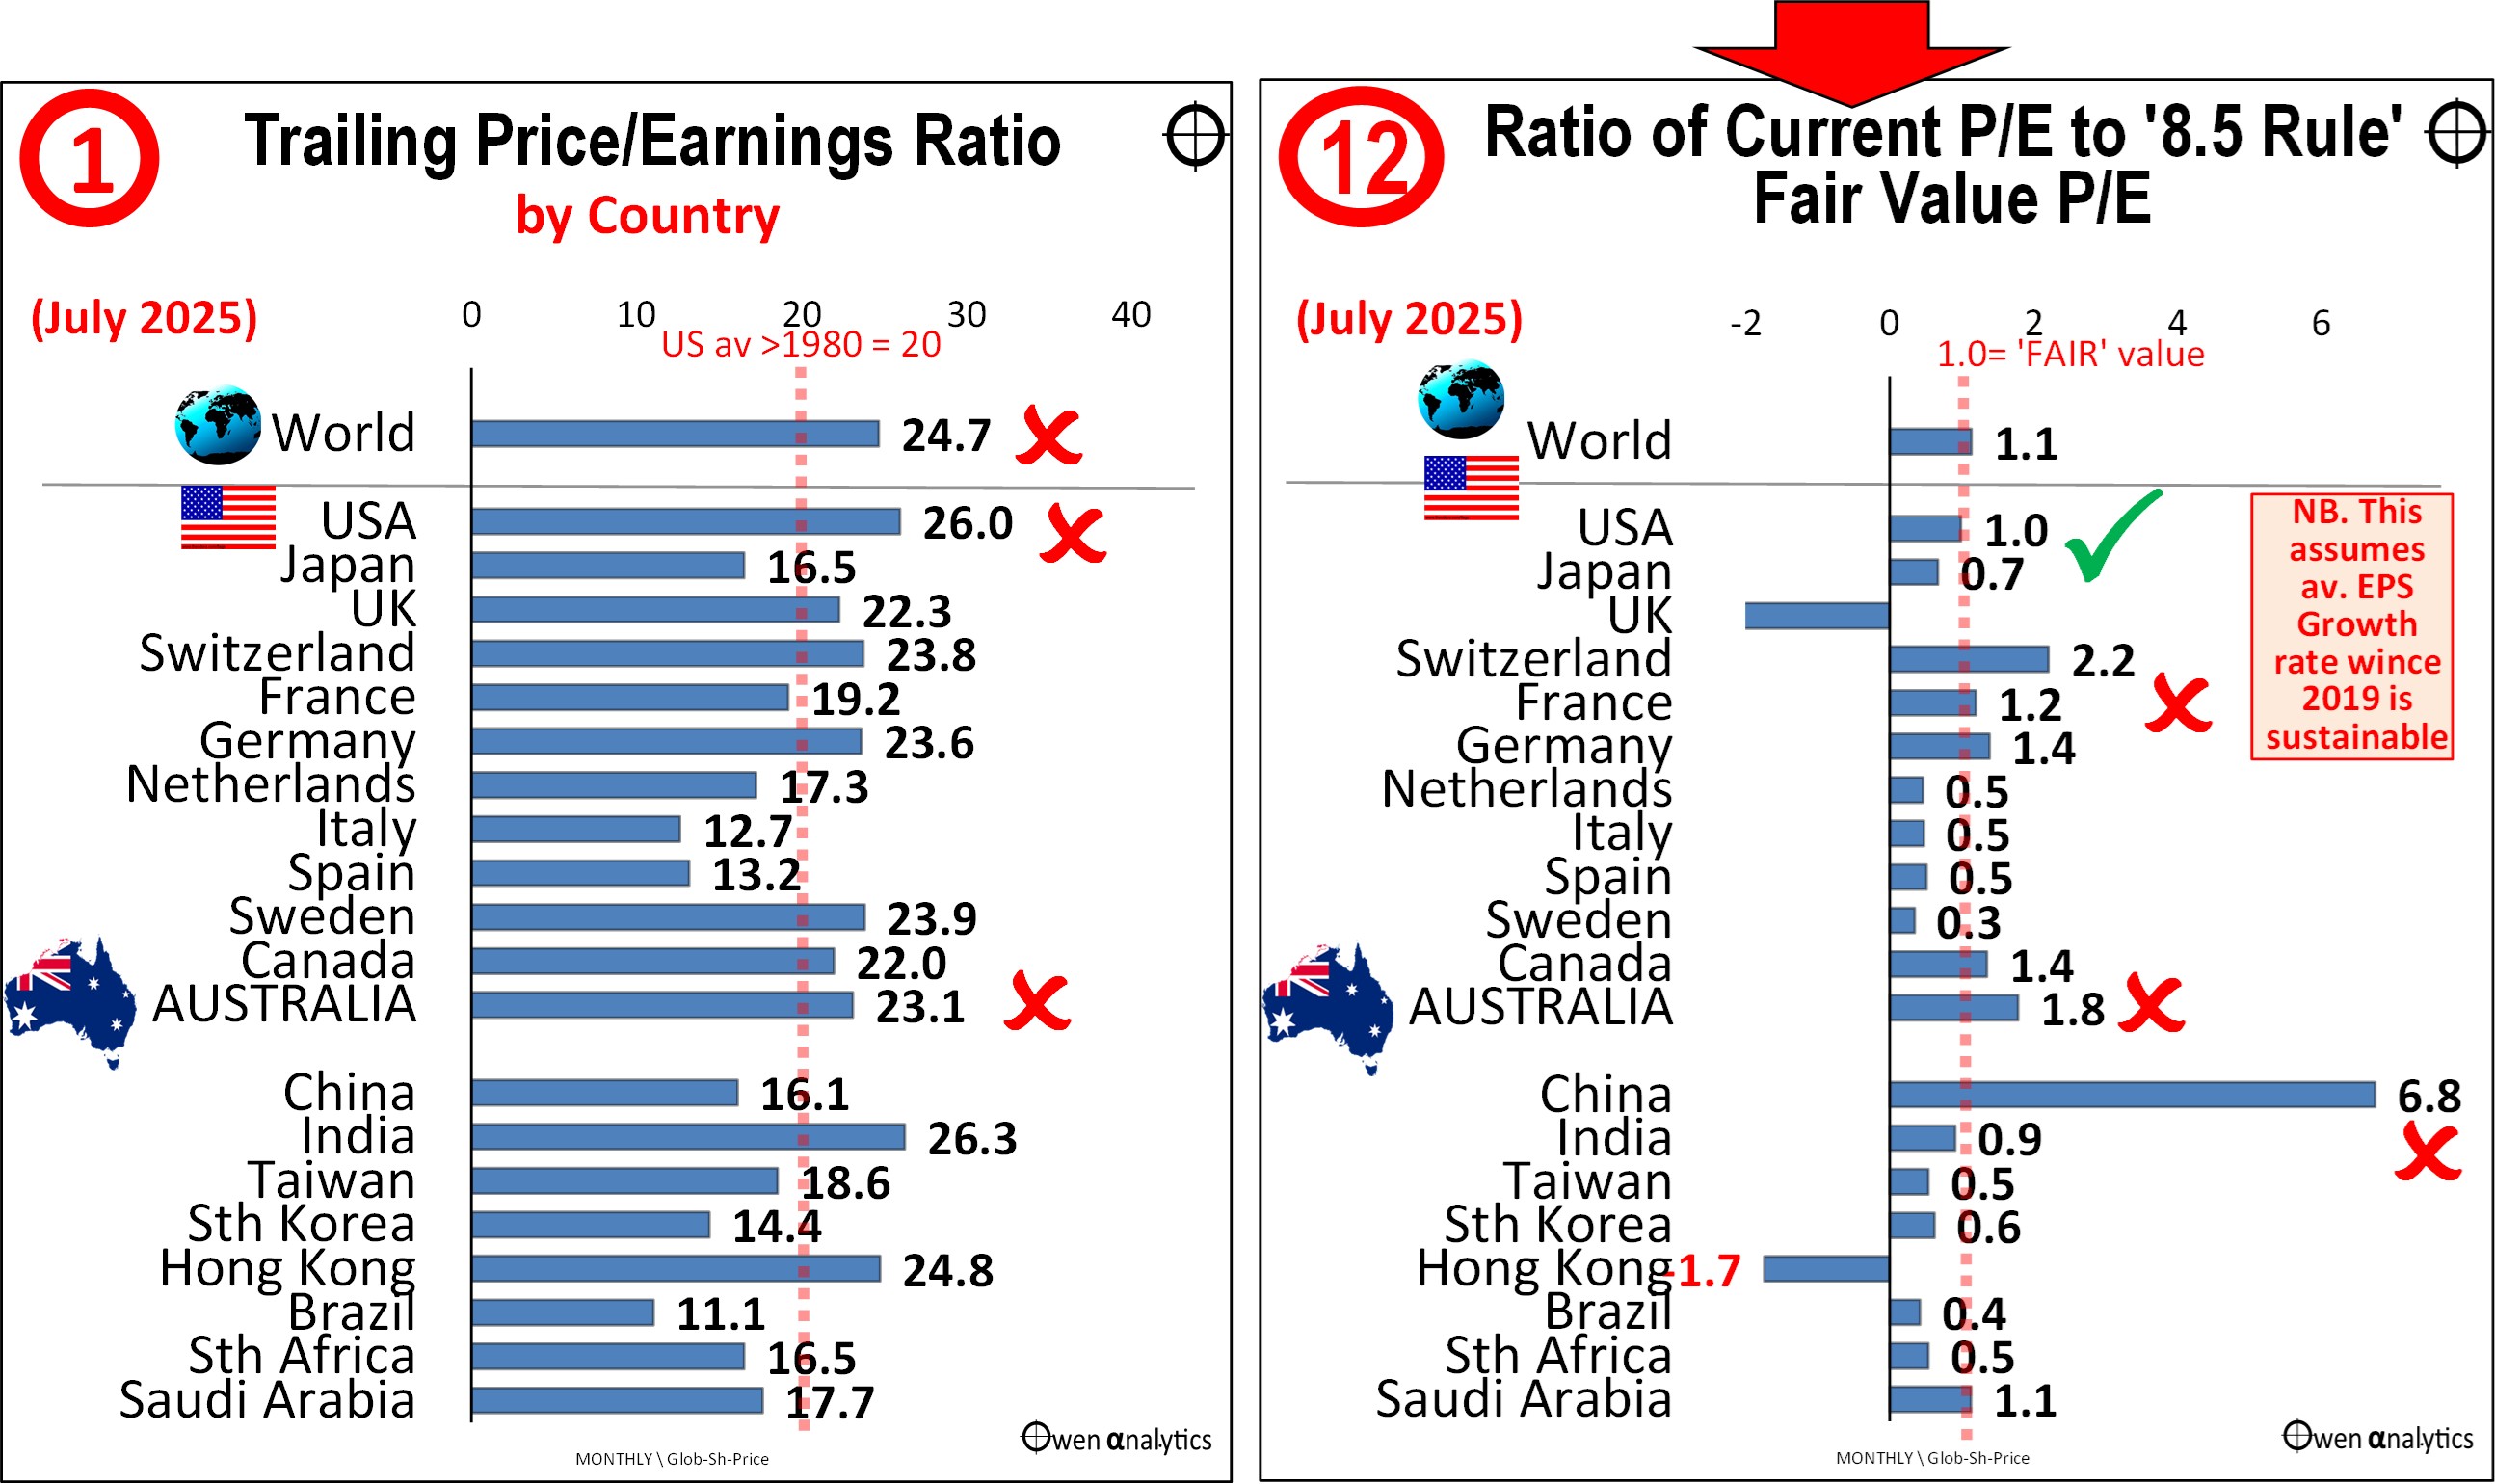
The US market is sitting on 1.0 in chart 12, meaning the current P/E is spot on what it should be under the 8.5 Rule.
For the US market, traditional measures like the regular P/E ratio are high (chart 1), making it appear expensive, but once the 8.5 rule factors in its superior profit growth rates as a result of its high profit margins, high returns on equity, and low dividend payout rates, it is actually around fairly priced for growth.
Japan and India also come up well on this method. France, Germany, Canada and some of smaller markets are not too bad either (but note the problems of concentration and ‘lumpiness’ in some of the smaller markets - eg Spotify in Sweden, ASML in Netherlands, Novo Nordisk in Denmark, etc).
On the other hand, the Australian market is sitting on 1.8 in chart 12, meaning it is current P/E ratio is nearly double what it is justified when adjusted for growth.
Australia’s regular P/E ratio is high like the US (chart 1), so it appears expensive like the US. However, once the 8.5 Rule factors in the Australian market’s very poor earnings per share growth rates (not just in recent years, but for the past two decades, and unlikely to suddenly jump any time soon – see Part 5), due to its lower profit margins, lower returns on equity (Part 4), and higher dividend payout rates, it is actually much more expensive relative to growth than the US market.
The UK, China, and Hong Kong are once again off the charts because of their negative aggregate earnings growth since 2019, and few signs these will magically turn around soon, given their entrenched problems.
Reality check on the PEG ratio and ‘8.5 rule’
The fair value P/E under the ‘8.5 rule’, and indeed under the ‘PEG 1.5 rule’, are based on the assumption that the current running rate of aggregate earnings per share growth (which in this case is the average annual EPS growth rates since 2019), can be sustained at similar types of rates for the next few years.
This may be a fair assumption (as I have argued above), but unusually high growth rates (for example in the US share market) cannot last forever for simple logical reasons. There are natural limits to growth over the longer term.
Longer-term growth rates – two ‘Supply-Side’ models
In estimating the limits to long-term growth in aggregate corporate earnings per share, we can look to ‘macro’ (broad economic) factors, and we can also look at ‘micro’ factors relating to the profitability of companies.
Macro factors - there are limits on how much profit the economy can actually deliver (‘supply’) to the corporate sector.
Micro factors - there are limits on how much profit companies can actually generate from year to year given their returns on equity (ROE), and how much of their earnings they retain in order to earn those returns on equity (if a company pays out all or nearly all of its profits to shareholders, it has no increase in equity capital to generate future growth (‘micro’ supply-side limit to long-term growth).
Macro supply-side limits to future aggregate earnings per share growth
Aggregate corporate profits cannot grow faster than the overall economic pie (nominal GDP growth) unless they increase their corporate profit share of GDP. Therefore the limit to aggregate corporate earnings growth =
= Expected Nominal GDP growth + expected average change in corporate profit share
Expected average Nominal GDP growth rate =
= expected average Real GPD growth + expected average inflation
For the USA this in the order of:
around 2.0% av Real GDP growth + around 2.5% av inflation = around 4.5% pa av nominal GDP growth.
This would be similar for Australia, although estimates for the components may differ slightly.
These are just rough guesses of course, but the important point for this exercise is that any reasonable estimates of nominal GDP growth are far lower than the current 8% running rate for US earnings per share growth.
US GDP or World GDP?
There is a valid argument that for the US share market, we should be using the global economic pie, not just the US economy because US companies are global, not domestic. This is true. However, any reasonable estimate for growth rates for the global economic pie would not be that different from around 5% or so for the US economy. Growth will probably be higher in Africa and Asia ex-China/Japan, but lower in Europe, China, Japan, so the overall global picture would probably not be significantly different.
Corporate earnings share of GDP?
For this purpose I will assume that the corporate earnings share of GDP will remain more or less constant in future, aside from the usual boom-bust cycles.
Logically, if we were to assume that the corporate share of GDP would keep growing at say 0.5% pa, then it will soon eat up the entire economy! There is a limit, beyond which triggers social unrest, revolts, revolutions, and/or massive wealth redistributions like 1930s Great Depression.
The current level of the US share market is ‘fair value’ under the 8.5 rule (and PEG rule) only if the current 8% running rate for EPS growth is sustainable forever.
Bottom line is that we should be assessing the value of the US market not on the current 8% running rate for EPS growth, but more like around 5% or 6%.
This is very close to the US historical average EPS growth rates of 6.2% pa since 1950, 6.1% pa since 1980, and 6.0% pa since 2000.
If we use a macro supply-side limit to aggregate corporate earnings per share growth of say 6% pa, then -
the fair value P/E for the US = 8.5 + (2 x 6) = 20.5
This is close to the US historical average P/E of 17.6 since 1950, 20.1 since 1980, and 22.6 since 2000.
Micro supply-side limits to future aggregate earnings per share growth
We arrive at very similar results using the ‘micro’ limits to US corporate EPS growth by looking at the profit-generating capacity of US listed companies.
Expected average profit growth = Expected average ROE x expected average Div retention rate.
A company can only grow its earnings per share each year if it retains its profits rather than handing it back to shareholders in the form of dividends. The more a company can retain its earnings, the more it can use to generate additional earnings next year.
US Returns on Equity
Average returns on equity (ROE) for the S&P500 market have been relatively stable over the past half century (aside from temporary boom-bust cycles) at around 13% pa, although the current running rate since 2019 is 16% pa in the current tech boom. (see Part 4).
As the current ROE is probably just another boom-time peak in the inevitable boom-bust cycle, it is reasonable to assume a long term average ROE of say 14% at best for the sustainable future.
What about the ‘ai’ revolution?
Will ‘ai’ transform human society and economic life like the hype says it will? Maybe, but so what?
-
-
- Railroads certainly transformed human society and economic life forever – but the euphoria led to frenzied over-investment and massive speculative bubbles that ended in huge losses for most investors.
- Automobile mass production transformed human society and economic life forever – but the euphoria led to frenzied over-investment and massive speculative bubbles that ended in huge losses for most investors.
- Air flight transformed human societies and economic life forever – but the euphoria led to frenzied over-investment and massive speculative bubbles that ended in huge losses for most investors.
- The Bessemer steel production process transformed human societies and economic life forever – but the euphoria led to frenzied over-investment and massive speculative bubbles that ended in huge losses for most investors.
- Electrification transformed human societies and economic life forever – but the euphoria led to frenzied over-investment and massive speculative bubbles that ended in huge losses for most investors.
- Radios transformed human societies and economic life forever – but the euphoria led to frenzied over-investment and massive speculative bubbles that ended in huge losses for most investors.
- Telephones transformed human societies and economic life forever – but the euphoria led to frenzied over-investment and massive speculative bubbles that ended in huge losses for most investors.
- The internet and world wide web transformed human societies and economic life forever – but the euphoria led to frenzied over-investment and massive speculative bubbles that ended in huge losses for most investors.
- The securitisation of debt (from government debt in the early 1700s to mortgage debt in the early 2000s) transformed human societies and economic life forever – but the euphoria led to frenzied over-investment and massive speculative bubbles that ended in huge losses for most investors.
- Steam shipping transformed human societies and economic life forever – but the euphoria led to frenzied over-investment and massive speculative bubbles that ended in huge losses for most investors.
- And so on, and so on.
You get the picture. Just because a new technology or invention or discovery promises to (and indeed does) transform human societies and economic life forever, the euphoria has always led to frenzied over-investment and massive speculative bubbles that ended in huge losses for most investors. The big winners are inevitably the early founders (although the failure rate was extremely high), the shifty promoters, opportunistic swindlers, and of course the brokers.
Instead of the usual ‘History never repeats, but it does rhyme’ (which Mark Twain never actually wrote), I prefer François-Marie Arouet (‘Voltaire’, in Candide, 1759, ch.30) –
‘History never repeats itself. Man always does.’
The problem is humans, who continually do the same old stupid things over and over throughout history. That’s just hard-wired human nature. We can’t help it.
In the current ‘ai’ boom, we are already seeing the early stages of mass euphoria, frenzied over-investment, and a speculative bubble. Will it magically lead to permanently higher aggregate corporate profitability forever? Highly unlikely!
I am happy to stick with my long-term ROE estimate of around 14% pa for the US share market, and not the recent five-year average of 16%, nor the current year 18%.
US dividend retention
Dividend payout rates for the US market have declined slowly but steadily in recent decades – from 55% in the 1950s & 1950s to 38% since 2000, so dividend retention rates have risen from 45% in the 1950s & 1960s to 62% since 2000. (The ’retention’ rate is 1 minus the ‘payout’ rate.)
Share Buybacks
One of the key reasons for the decline in dividend payouts for US companies in recent decades has been the rise of share buybacks, especially since SEC Rule 10b-18 in 1982. A dollar paid out in share buy-backs is a dollar not retained to grow future earnings, but the buy-back reduces the number of shares on issue, so it increases the level of earnings per share.
If we assume that future average corporate ROE in S&P500 companies will continue to be around 14% pa over the long term, and the average dividend retention rate will remain around 40%, then the micro supply-side limit to earnings per share growth of:
= Av ROE x Av retention rate
= 14% x 40% = 5.6% pa average sustainable long-term EPS growth
This also happens to be very similar to long-term historical rates for EPS growth in the US market – ie 6.2% pa since 1950, 6.1% pa since 1980, and 6.0% since 2000.
If we use this micro supply-side limit to aggregate corporate earnings per share growth of say 5.5% pa, then -
the fair value P/E = 8.5 + (2 x 5.6) = 19.7
This is also very close to the US historical average P/E of 17.6 since 1950, 20.1 since 1980, and 22.6 since 2000.
‘US exceptionalism’ has been constrained by supply-side limits to growth
Therefore, for the broad US share market, there are long-term ‘supply-side’ limits to the sustainable growth rates in earnings per share, whether we look at it from the ability of the overall US and global economy to generate (supply) corporate profits (‘macro’), or when we look at the ability for US companies to generate (supply) profits given their rates of return on equity, and how much profits they retain for future growth.
As a long-term investor, I am not buying the US market (eg via broad ETFs) for the short term, so I should assess value on the basis of a fair multiple I pay for sustainable long-term earnings growth.
This curbs my enthusiasm for the idea that the rather encouraging PEG ratios and 8.5 Rule outcomes for the US market suddenly point to ‘this time is different’. Even the so-called ‘US exceptionalism’ has been constrained by supply-side limits to growth, and logically it probably always will be.
Australia’s supply-side limits to long-term earnings per share growth
The macro supply-side limits to future aggregate earnings per share growth for Australia are probably not too different from the US picture – ie nominal GDP growth in the order or 5% to 6% for Australia, and probably not that much different for the gettable economic pie for ASX companies.
Most ASX200 companies are predominantly domestic. However, for the companies with largely foreign revenues (mostly iron ore, gas, coal, gold, and other industrial metals) – demand from China and Japan is slowing and likely to continue to slow, but demand from India, ASEAN and the rest of Asia is growing and likely to keep growing. So my assumption of a ‘macro’ limit to EPS growth of around 5% to 6% still holds.
Personally, I would err on the side of the lower growth rate (eg more toward 5% than 6%) for Australia.
If we use a macro supply-side limit to aggregate corporate earnings per share growth of say 5.5% pa for Australia -
then the fair value P/E for Australia = 8.5 + (2 x 5.5) = 19.5
This is very close to the Australian historical average P/E of 17.6 since 1950, 16.6 since 1980, and 17.3 since 2000.
Micro supply-side limit to EPS growth for Australian market
Here we have some big differences between Australian and US companies.
Australian Returns on Equity
Average returns on equity (ROE) for Australian companies have been much lower than for US companies – see (see Part 4). Average ROEs have been running at 11.1% pa since 1980, 11.4% since 1990, and 11.9% since 2000, but it did rise to 13.2% in the 2000s decade thanks to the China/mining boom.
For future ROEs, it is difficult to see it rising above historical rates, but let’s allow 12% to be generous.
Australian dividend retention rates
Dividend payout rates for the Australian market have been much higher than in the US market. Pay-out rates have rising in Australia in recent decades, whereas they have been declining in the US. Australian payout rates have risen from 62-64% in the 1960s and 1960s, to an average of 81% in the 2000s.
High dividend payout rates are bad for profit growth. The less companies retain of their profits, the less they can invest for future growth.
Buybacks
Australia does not have the share buy-back culture of the US market. Most of the time, Australian companies raise more equity in secondary raisings than they pay out in buy-backs, so the net result is a dilution of earnings per share here, not a boost to earnings per share like in the US market.
If we assume that future average corporate ROE in Australia companies will continue to be around 12% pa over the long term (being generous), and the average dividend retention rate will remain around 25% (being generous), then the micro supply-side limit to earnings per share growth of:
= Av ROE x Av retention rate
= 12% x 25% = 3% pa average sustainable long-term EPS growth
This ‘micro’ supply-side limit to long-term average EPS growth in the order of 3% or so for Australia is much lower than the 5% to 6% pa growth in the US market.
However, our estimate of around 3% for Australia is not dissimilar from historical average EPS growth in Australia: 4.7% pa since 1980, 2.8% pa since 1990, and 4.4% pa since 2000.
EPS growth in Australia did reach a high of 8.1% pa average in the 2000s decade (China/mining boom), but was a much lower 2.1% pa average in the 2010s decade, and 2.2% pa average in the 2020s decade to date.
If we use this micro supply-side limit to aggregate corporate earnings per share growth of say 3% pa,
then the ‘fair value’ P/E = 8.5 + (2 x 3.0) = 14.5 times current earnings
Thus, both the ‘macro’ and ‘micro’ supply-side estimates for the limits to sustainable aggregate earnings per share growth rates are significantly lower for Australia than they are for the US share market.
Summary
-
-
- Most share markets, especially the US, appear very over-priced on traditional valuation metrics like P/E ratios, dividend yields, price/book ratios.
- Here I look at two valuation methods that take into account different earnings growth rates to arrive at a fair price for growth.
- Using ‘PEG’ ratios - Australia has the 2nd highest (most expensive) PEG ratio in the world.
- US PEG ratios are better, but still too high (too expensive) even with the US market’s superior profit margins, returns on equity, earnings & dividend growth rates.
- Using Ben Graham’s ‘8.5 rule’ for valuing share markets, the US is around fairly priced given its superior profit growth rates, profit margins, ROE, and low dividend payout rates.
- Japan and India also come up well on the ‘8.5 rule’ valuation. France, Germany, Canada are close.
- However, Australia is much more expensive relative to growth than the US market on the 8.5 Rule due to its very poor earnings per share growth, low profit margins, low ROE, and high dividend payout rates.
- I also outline two sanity checks on these ‘price for growth’ rules: macro and micro ‘supply-side’ limits to sustainable long-term growth.
- Although the US market comes up more or less fairly valued for growth on the PEG ratio and 8.5 Rule, these assume that current higher than usual rates of profit growth and ROE are permanent, but most likely it just another temporary boom that will end just as every other temporary boom before it.
- So even 'US exceptionalism' has been constrained by supply-side limits to growth.
I apologise to readers for the rather detailed and dense nature of this series of articles.
It looks like a lot of work, but it is actually just part of the regular process I do a couple of times per year, and have done so for the past two decades, for investment committees, and for training, mentoring, and supporting advisers and portfolio managers.
The only difference this time is that I split up the whole report into separate articles so they are more manageable and accessible. Plus I have beefed up the explanations of each chart and section for the benefit of new readers. Hopefully you found some value in it!
Investing is not about buying stuff because the price is rising, in the hope it will keep rising forever. It never does. Investing is about understanding what you are buying, why, and when.
‘Till next time . . . . safe investing!
See other articles in this 6-part series -