Australia and the US have had the best share markets in the world for the past 100+ years, but:
- Why?
- Which market has generated higher returns?
- Which has had the bigger booms and busts?
- Who’s turn is it next?
We are long term investors, so we look beyond the short term market noise to see what is happening in the bigger picture. The Australian share market is now at a major turning point in how it performs in a global context.
The main chart shows the accumulated real total returns from both markets since 1900 – green for Australia and red for the US. ('Total returns' means price returns plus dividends; 'Real' means adjusted for local CPI inflation).
The lower section shows the difference in rolling five-year returns – Australian returns minus the US returns. Positive green bars are when Australia is winning; negative red bars are when the US is winning.
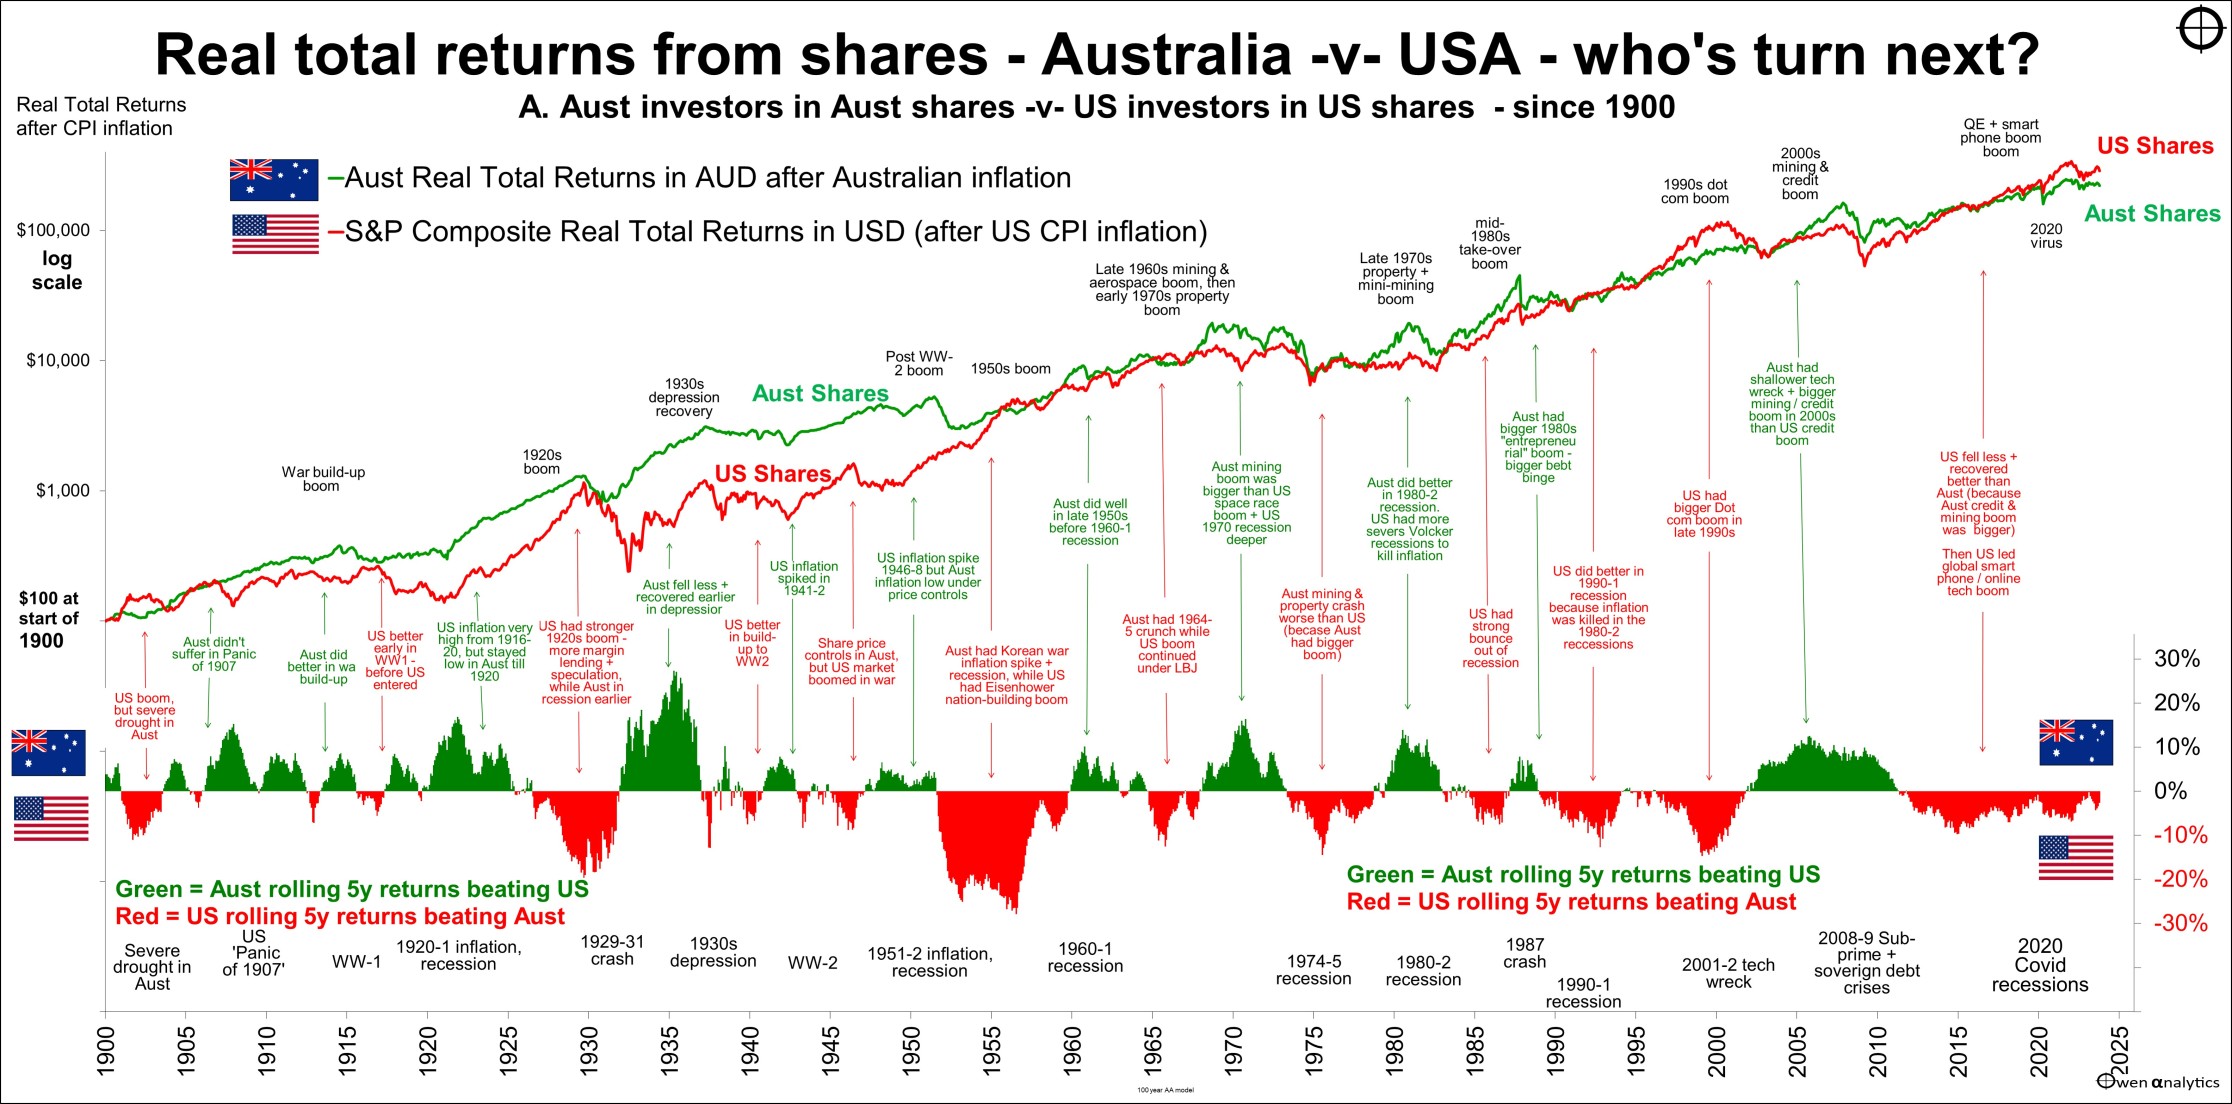
I have deliberately ignored currency effects for this chart – so it just shows returns for Australian investors in Australian shares in Australian dollars after Australian inflation, compared to returns for US investors in US shares in US dollars after US inflation.
Same returns over the past century or so
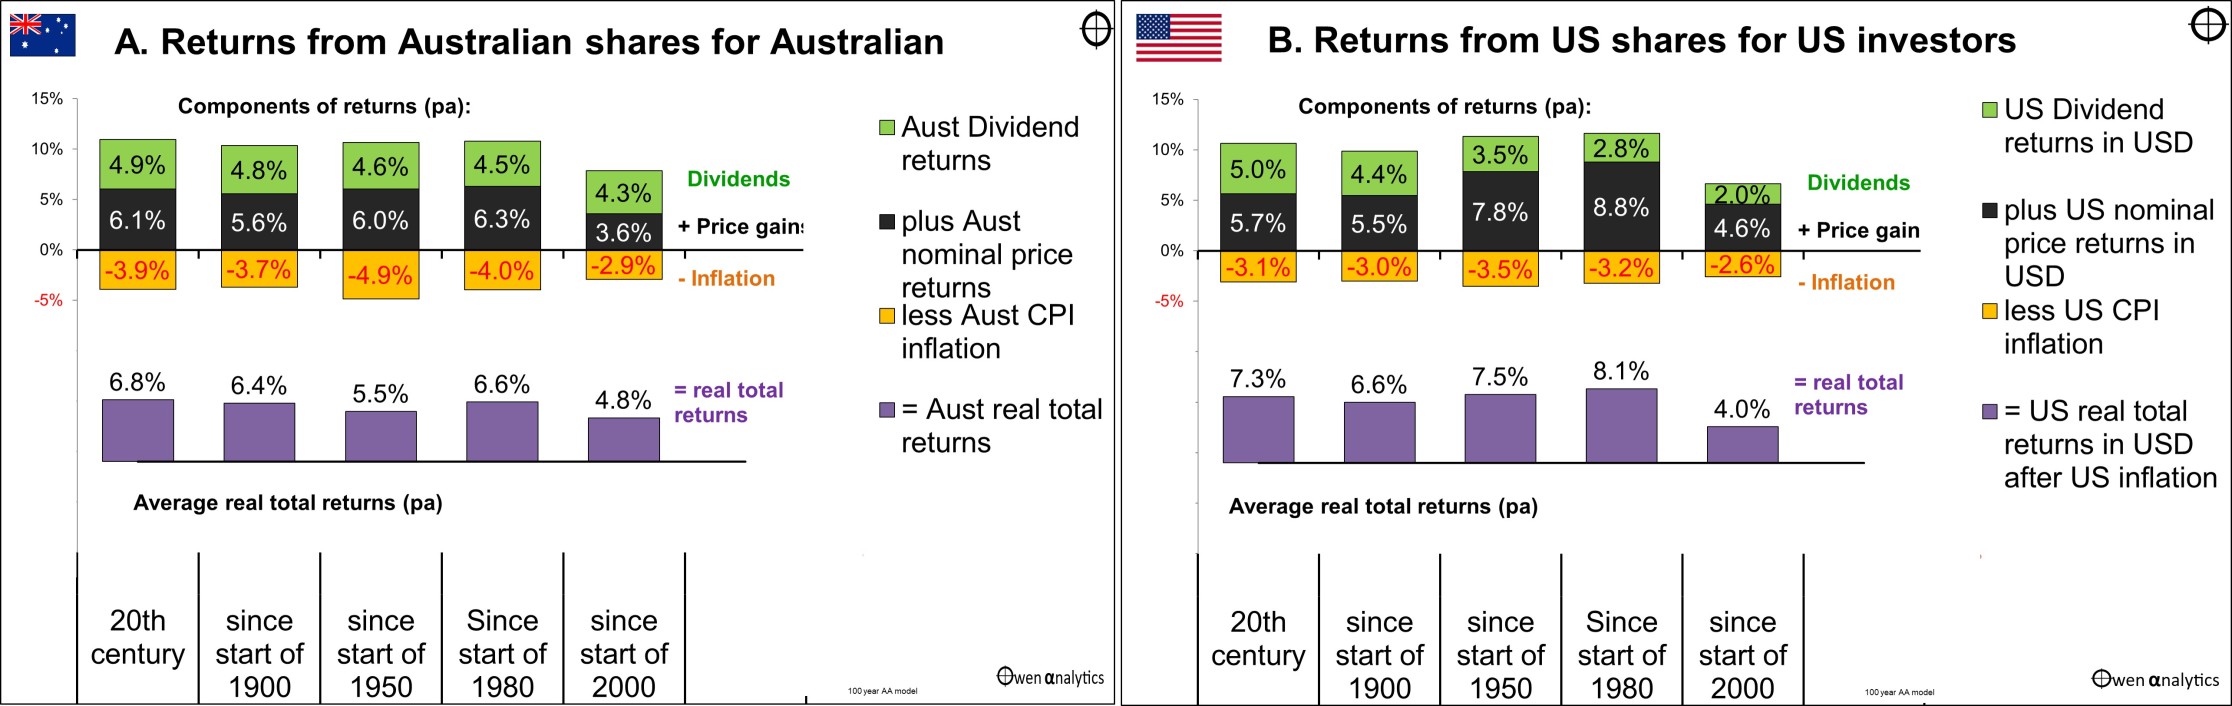
The Australian and US share markets have posted almost exactly the same returns for shareholders for more than a century. Each market has generated ‘real’ total returns (capital gains plus dividends, and adjusted for local inflation), averaging a very decent 6.5% above inflation per year since 1900.
However, because the extent of the boom-bust cycles are different, which market is leading at any one point in time depends entirely on when you choose to measure it.
For example, for the past decade, the US market has been ahead of Australia (negative red bars in the lower right of the chart) because the US is leading in the current US-led tech boom.
It is just ‘their turn’ in the current cycle. The tide will turn, as we shall see.
But different components of returns
While the returns have been the more or less the same in both markets, the components of returns have been different.
Australian shares have delivered higher nominal price growth and higher dividend yields than US shares, but these benefits have been neutralised by Australia’s higher inflation rate, so the real total returns after inflation have been virtually the same for local shareholders in each market.
Different mix of industries and companies
The two markets have generated very similar returns for investors despite very big differences in the types of listed companies in each market.
For example, in 1900 the US share market was dominated by railroad companies, but today it is mostly computing / social media / A.I. companies.
The Australian share market has mostly been dominated by miners and banks, but for the middle decades we also had manufacturers that survived behind high protection barriers until they disappeared when protection was removed in the 1980s reforms.
Favourable conditions – rare in the world
Despite these differences, Australia and the US have been almost unique in the world in providing favourable conditions for companies and private investors for most (but certainly not all) of the time, including:
- Relatively stable political, administrative, regulatory, and judicial systems
- Rule of law, investor protection
- Pro-growth, pro-business governments
- Competition policy (although weak at times)
- Democratic accountability
- Freedom of speech
- Relatively young, growing populations boosted by pro-immigration policies
- Both countries have avoided being invaded and subsumed by foreign powers
Taking turns
Not only have returns been almost exactly the same overall, the two markets have also followed almost exactly the same booms and busts along the way (Or, more correctly, Australia has always followed the US, never the other way around).
Each market has taken turns in having a bigger boom and then a bigger bust.
Australia has led for half the time; the US has led for the other half of the time.
Starting at the left of the main chart we have the US getting off to an early lead in the early 1900s as Australia suffered a severe drought. However, the US had a major fall in the ‘Panic of 1907’ which Australia avoided (this was the only US crash that was not mirrored in the Australian market).
By avoiding the US Panic of 1907, Australia took the lead and kept ahead during the First World War. Australia had less of an inflation problem in the post-WW1 years than the US, so Australia led the US into the 1920s.
The US then had a much bigger mid-late 1920s boom, with much more speculation, margin lending, and accounting trickery, while the Australian market was hit by falling commodities prices in the late 1920s.
However, because the US had a much bigger 1920s boom, it suffered a much deeper and longer crash in the early 1930s than Australia. The lead then changed hands a few times in the 1940s.
The large red negative patch in the 1950s is when the US finally caught up from its 1929-32 crash and took a big lead again as the Australian market fell in the Korean War inflation crisis, which did not affect the US. Australia’s 1951-2 fall was one of the very few times the Australian market fell on its own accord, without following the US lead.
Australia fought back in the 1960s with our speculative mining boom driven by the surge in global demand for metals for the space race and the Vietnam War. Our bigger 1960s boom led to a bigger bust in the early-mid-1970s.
Australia then had a much bigger speculative take-over boom in the 1980s (Bond, Skase, Herscue, Spalvins, Elliott, Goward, Connell, et al), and so it had further to fall in the 1987 crash.
The US then had a much bigger speculative ‘dot-com’ boom in the 1990s, and so it collapsed into a bigger bust for the US in the 2001-2 ‘tech wreck’, giving Australia the lead once again.
Australia then had a bigger 2003-7 boom than the US. Not only did we have a crazy credit boom like the US and the rest of the world, but we also had the mining-China boom that crashed as well. Consequently, our local market fell further in the GFC and took longer to recover than the US.
Post-GFC
As a result of our bigger pre-GFC boom and our bigger GFC bust, the US has been winning since the GFC – shown by the red negative bars to the far right of the lower section.
In the early post-GFC years the US led simply because Australia had a bigger bust from its bigger mining/credit boom. However, during the 2010s, the US tech giants drove the whole US market further ahead in the global smart phone / internet / social media (and now A.I.) boom.
The US market held up better in the Covid lockdowns and rebound because of its heavier weighting to tech/online stocks that thrived during the lockdowns. In contrast, the Australian market was much more reliant on banks and commodities, which suffered more in the Covid lockdown recession.
Where are we now?
With inflation and interest rate hikes putting pressure on spending, and the ending of the wonderful, but artificial ‘ZIRP’/’QE’ era, we are now at another turning point in the battle between the two markets.
The position today is similar in many ways to past ‘tech’ booms, where the US market went to higher, speculative, over-priced levels in the boom, but then crashed further in the busts, handing the lead back to Australia:
- the early 1900s US tech boom (railways, speculative trust companies) – prior to the Panic of 1907
- the late 1920s US tech boom (radios, cars) – prior to the 1929-32 crash
- the late 1990s US tech boom (internet, ‘dot-com’ retailers), prior to the 2001-2 ‘tech-wreck’
Why will Australia re-take the lead?
Two reasons:
First - the US is once again more over-priced than Australia on a range of different measures, so it will fall further when the boom collapses. We saw a partial downward re-pricing in 2022 (with the aggressive rate hikes), but the US tech/online giants are still over-priced on a range of measures.
Speculative booms are never resolved by prices gently and smoothly settling back to ‘fair pricing’ in an orderly fashion. Booms always collapse in devastating crashes that take the rest of the market with them.
It is just a question of when, not if. The trigger could be anything, or a combination of negative factors.
Commodities
Second – we also have a renewed commodities boom.
Not just supply restrictions from lockdowns and the Russia sanctions, but also longer term themes like the race to renewable energy, electrification, battery storage, and a global military build-up.
This also mirrors past baton-changes from the US to Australia:
- When the US-led early 1900s speculative boom collapsed in the Panic of 1907, the Australian market was less over-priced and had less to fall than the US market, and we also had a mining boom with base metals exports to Europe in the military and industrial build-up to WW1.
- When the US-led late-1920s speculative tech boom collapsed in the 1929-32 crash, the Australian market was less over-priced and had less to fall than the US market, and we also had a gold mining boom in the early 1930s, thanks to currency devaluations in the Depression.
- When the US-led late-1990s speculative tech boom collapsed in the 2001-2 ‘tech-wreck’, our market was less over-priced and had less to fall than the US market, and we also had the start of the 2000s China/mining boom.
It is the same today in the current tech boom, where the US market is more over-priced. Our market is less over-priced and has less to fall than the US market, and we also probably at the start of another great commodities boom that will benefit the local market.
History does not repeat of course, but the factors that drive these big shifts are long term in nature and are more or less hard-wired into our economies, and our political, administrative, and social infrastructures.
The details in each cycle are different, but if we stand back from the daily market noise, there are some big picture themes we can observe and learn from when shaping long term investment strategies.
On the relative pricing of the Australian and US share markets – see: US ‘Shiller/CAPE’ ratio It’s flashing orange. . . but what action should we take?
Australian ‘Shiller/CAPE’ ratio – not over-priced like the US. Uncle Sam still calls the tune, but Australia is better placed for growth
See also: Australian share market has gone nowhere for 16 years? Is it ‘broken’? Has it lost its mojo? Will it ever get back to growth?
Franking credits -
NB these returns do not including franking credits that may be available to Australian holders of Australian shares, which have added around 1.5% pa to local returns in the past three decades. See: Frankly my dear - we need to . . . we need to include Franking Credits in reporting and portfolio planning’ Here's what they're worth
‘Till next time – happy investing!