At the start of 2023, media headlines were full of doom and gloom from hordes of experts, from the World Bank, IMF, OECD, down to the usual gaggle of over-paid local bank economists.
They were warning 2023 would be a year of US/global recessions, persistent high inflation, further aggressive rate hikes, negative fall-out from the Russia-Ukraine war, a looming ‘Emerging Markets debt crisis, and the dreaded ‘mortgage cliff’ in Australia.
None of these occurred of course!
Instead, 2023 turned out to be a cracker of a year for patient, passive investors who ignored the so-called ‘experts’. Almost every asset class posted positive returns and most posted returns higher than their long term averages, and most beat inflation.
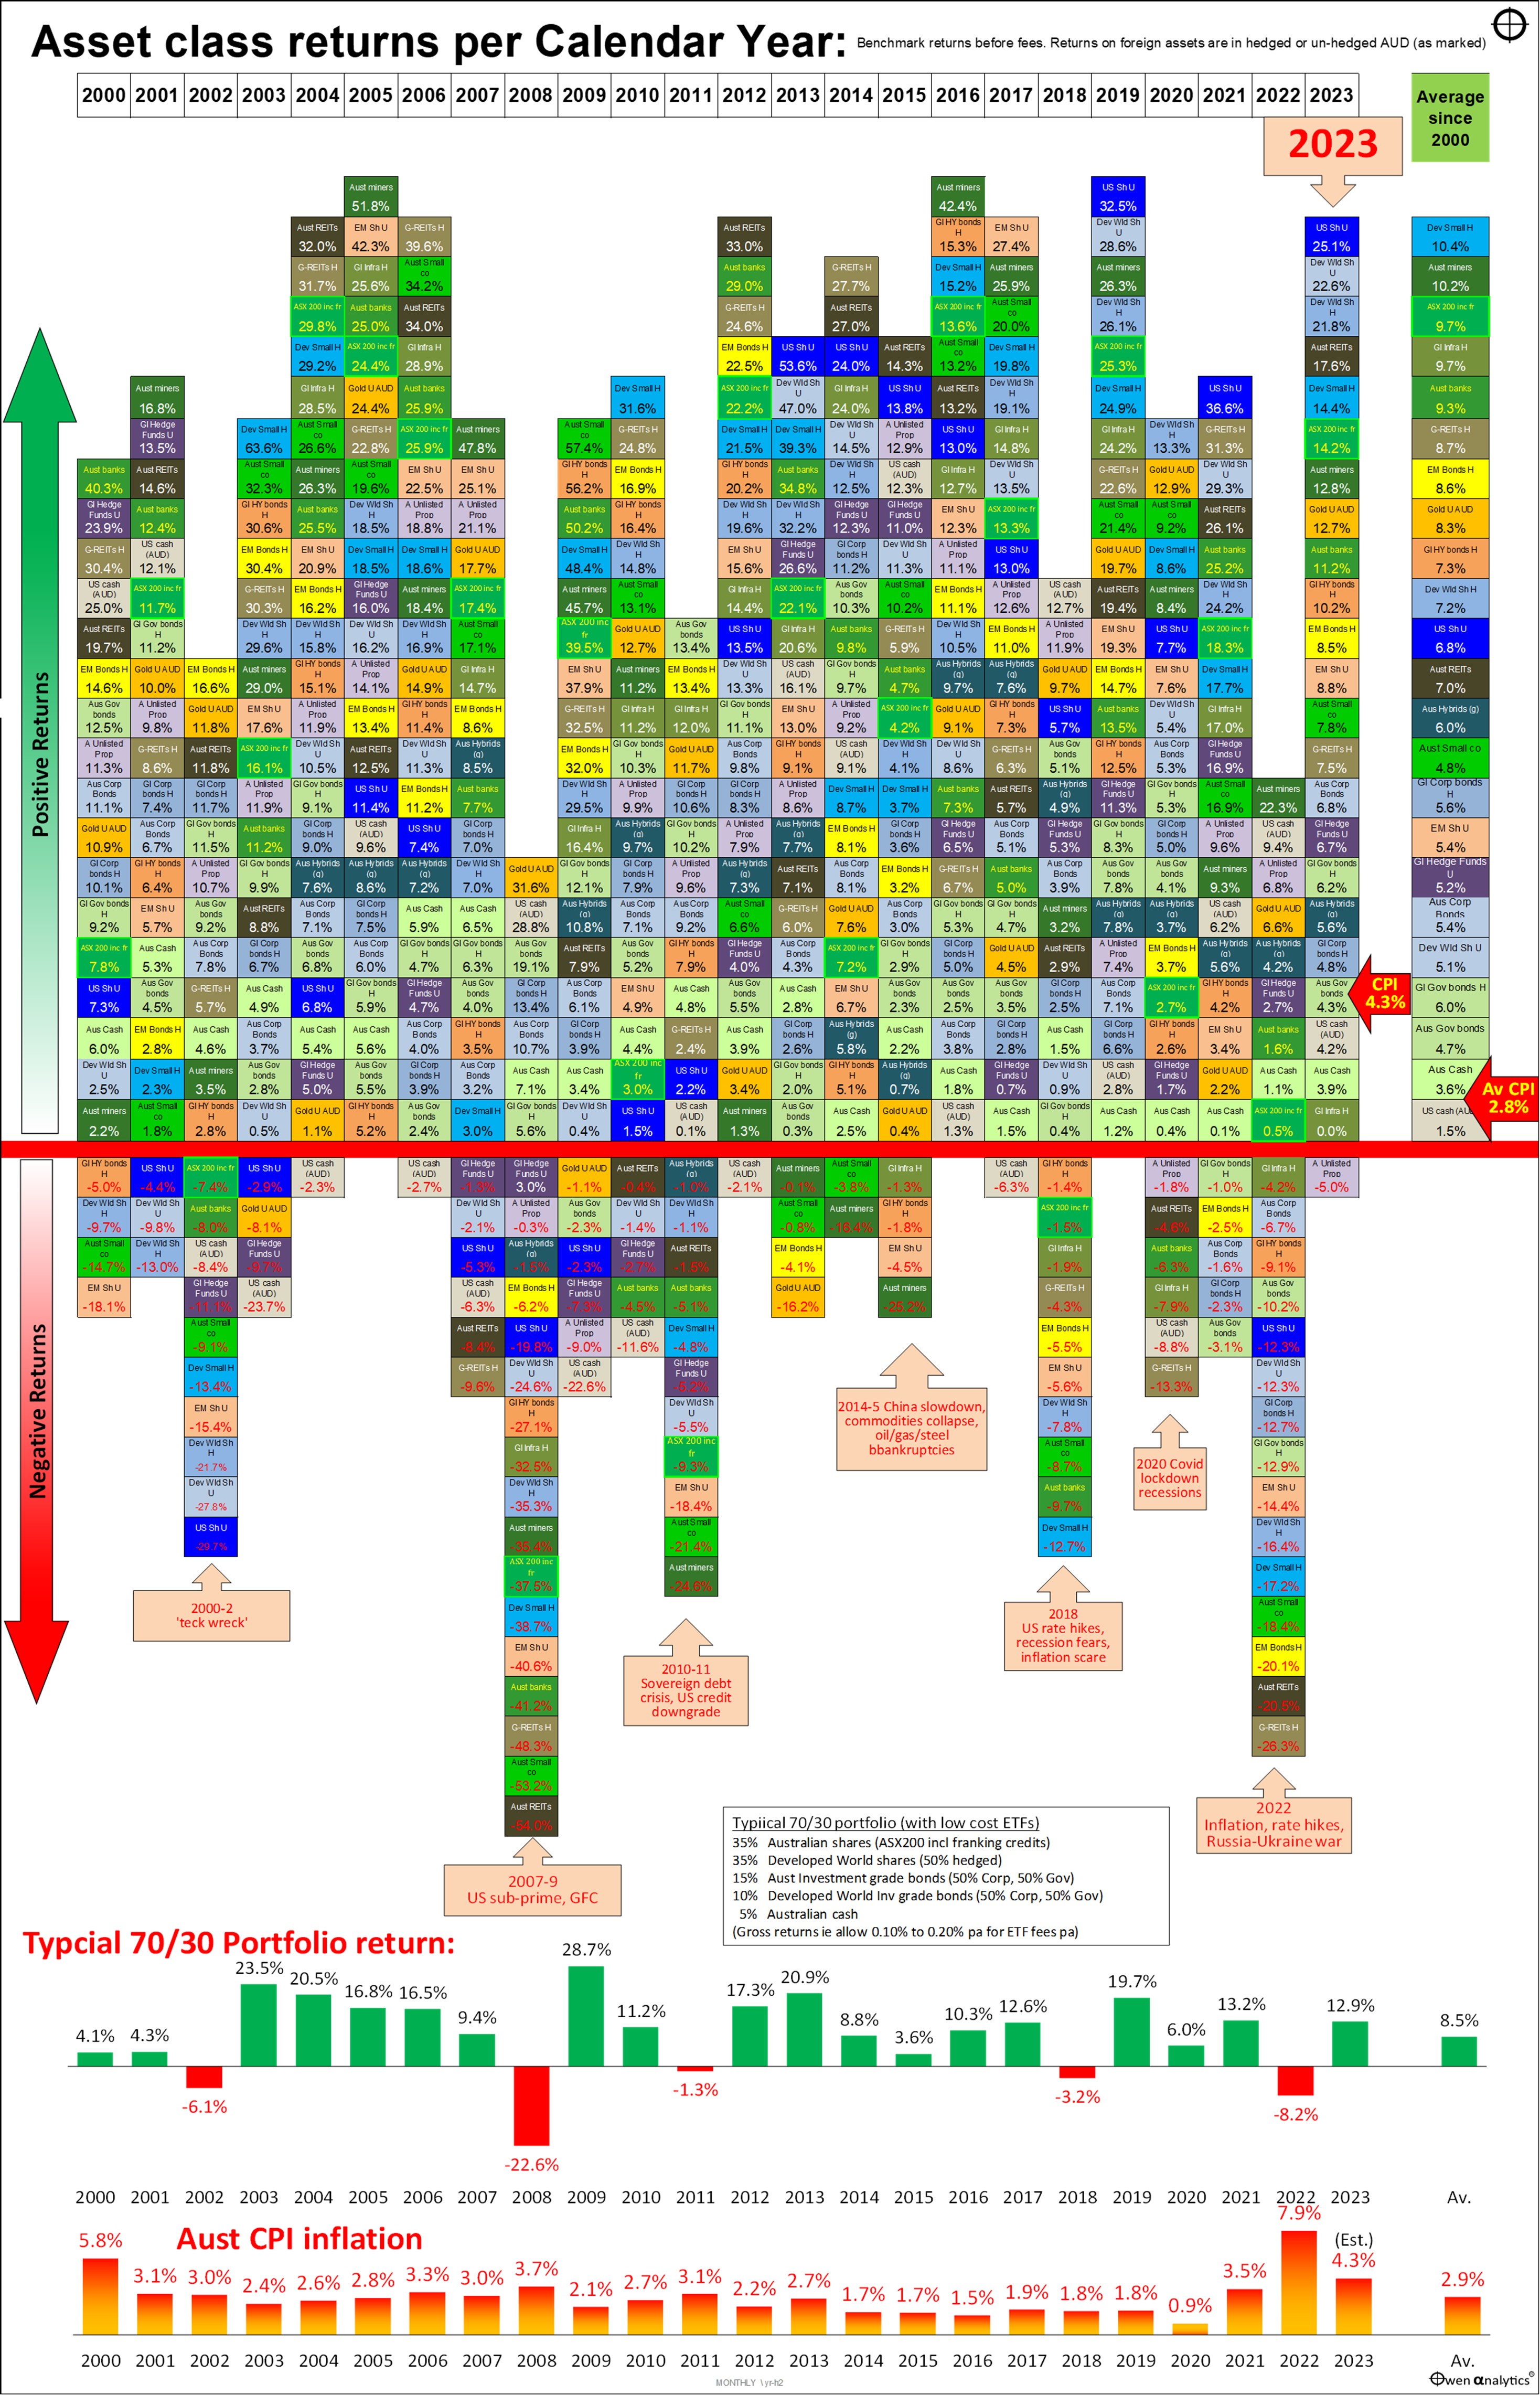
This chart shows total returns (ie price changes plus income) from two dozen of the main types of investment assets per calendar year since the start of the century. Returns above the red line are positive, below are negative.
This is designed primarily for Australian investors, so returns from international (non-Australian) assets come in two flavours – hedged AUD, and un-hedged AUD, as marked.
(A table of benchmarks for each asset class/segment is included at the end of this article)
Portfolios and Inflation
Below the main table are returns from our typical simple ‘70/30’ portfolio:
- 35% Australian shares,
- 35% developed market shares (50% of which is FX hedged),
- 15% Australian bonds (50/50 government/corporate),
- 10% global bonds AUD hedged (also split 50/50 government/corporate),
- 5% cash
- All holdings rebalanced yearly).
All returns are before fees, so you can deduct a fraction of a percent from returns, as all of these asset classes are available in the form of very low cost ETFs (exchange traded funds) on the ASX. (Fees on passive ETFs range from around 0.05% for share ETFs, and from around 0.10% for bond ETFs).
At the bottom we show Australian CPI inflation per year.
Australian CPI inflation for 2023 is estimated at 4.3%, being the rolling 12 months to November on the RBA’s monthly inflation series (ABS 6484 Table 1 col A). This is well down from 7.9% in 2022.
2023 score card
Here are the ‘Good, the Bad and the Ugly’ asset classes for 2023:
The Good
The clear winners were global share markets, led by the US (essentially a small handful of US ‘big-tech’ leaders), and other ‘developed’ markets (notably Japan). ‘Emerging Market’ shares as a whole posted poor, but still positive, returns, mainly dragged down by China’s woes.
Australian shares posted above average returns, with the big miners just beating the big banks, thanks mainly to soaring iron ore prices. Small companies lagged, with lower margins squeezed by rising interest rates and rising input costs.
Bond markets (Australian and global) also posted decent positive returns, but only because bond yields fell sharply in the last two months of the year on (probably over-optimistic) hopes of big rate cuts in 2024.
The Bad
The only negative asset class in 2023 was Australian unlisted property trusts. Negative impacts of rising interest rates on debt and rising bond yields on valuation discount rates. Also weak rental markets for offices (‘work from home’ depressing rental office demand), and retail shops (the ‘Amazon’ effect, accelerated by the Covid lockdown experience), but industrial (warehouses) are doing well from the shift from shops to online retailing.
On the other hand, listed property trusts (REITs) had a good year in 2023 rebounding from a shocker in 2022.
Listed property trust prices are set by the market, where prices tend to move ahead of valuation downgrades, whereas unlisted property trusts prices are set by their executives and directors, who are keen to protect their jobs and bonuses and are slow to report valuation downgrades.
Global infrastructure (hedged) posted zero for the year, as they were hurt mainly rising bond yields, which reduce valuation discount rates on long term ‘income’ assets.
The Ugly
There were no ugly duckling asset classes in 2023, unlike 2022 which saw more than a dozen asset class post returns worse than minus 10%.
Asset class returns since 2000
The overall table looks like a random patchwork quilt of returns, with no apparent rhyme or reason. There are different winners and losers each year, with returns from every type of asset jumping around from year to year.
Some quick observations:
- In most years, most types of investments post positive returns, and ahead of inflation.
- There are occasional years when everything is positive – like 2005, 2016, and 2019.
- But the rest of the time there are some types of assets that go backwards.
- In the big bust years (like 2008 and 2022), most types of assets post negative returns.
- But even in the worst years, several asset types still manage to post positive returns, although the winners are different each time.
The asset types with the most years with the highest returns are:
- Australian miners = 5 years as the highest returning asset type, curtesy of the post-2000 China boom
- US shares (Unhedged) = 4 years – mainly in the recent tech/online boom
- Australian REITS = 3 years
- Global REITS (hedged) = 2
- Developed world small companies (hedged) = 2
- Developed world shares (hedged) = 1
- Australian banks = 1
- Australian small companies = 1
- Emerging Markets shares (unhedged) = 1
- Emerging Markets bonds (hedged) = 1
- Australian government bonds = 1
- Gold (unhedged AUD) = 1 (2008, the year of the GFC sell-off)
- USD cash (unhedged) = 1
Most frequent lowest returning assets
Asset types with the most years with the lowest returns are:
- USD cash (unhedged AUD) = 8 years as the lowest returning asset type – so much for the ultimate ‘safe haven!’
- Global REITS (hedged) = 3 years – mostly in Covid lockdowns and the post-Covid inflation spike
- Australian miners = 2
- Gold (unhedged) = 2
- Emerging Markets shares (unhedged) = 1
- DM shares (hedged) = 1
- US shares (unhedged) = 1
- Global Hi Yield bonds (hedged) = 1
- Australian REITS = 1
- Developed world small companies (hedged) = 1
- Australian government bonds = 1
- Global infrastructure (hedged) = 1
- Australian cash = 1
Average returns since 2000
The far right column shows average annualised returns over the period since the start of 2000.
So far this century:
- every type of asset has generated positive total returns
- everything except USD cash (in un-hedged Australian dollars) has beaten Australian inflation
- 1st place with highest average total returns = Developed world small companies (hedged)
- 2nd = Australian miners
- 3rd = Australian shares (including franking credits)
- 4th = Global infrastructure (hedged)
- 5th = Australian banks
It is notable that global corporate investment grade bonds (hedged) beat development market shares (unhedged). So too did Aussie Hybrids (grossed up). This is mainly because of the poor performance of US, European and Japanese shares in the 2001-2 ‘tech-wreck’.
Portfolio construction
Good portfolio construction is not about trying to pick the best asset classes each year or trying to avoid the worst.
Nor is it about chasing last year's winners (hoping for a ‘momentum’ effect), or last year's losers (hoping for a ‘contrarian’ or ‘reversion’ effect). These strategies almost always destroy wealth.
Good portfolio construction is about selecting the right mix of assets so that the portfolio as a whole has the greatest probability of achieving each investor’s long-term goals, within their tolerance for risk and volatility (ups and downs along the way), and also their liquidity requirements (ie their need for cash when they need it).
Inflation
To far right of the table we see that over the whole period, every type of asset has beaten CPI inflation, except for USD cash (in Australian dollars). This is largely because the AUD has risen from 55 US cents to 68 US cents since 2000, which reduced the AUD value of US dollars.
Sample ‘growth portfolio’ returns
On the pro-forma returns from the simple 70/30 portfolio for Australian investors, these returns are before fees, and they assume no ‘alpha’ and no asset allocation changes, just setting the initial ‘strategic’ asset allocation and then re-balancing back to this mix each year.
Key outcomes for our simple 70/30 portfolio for Australian investors:
- Overall average returns of 8.5% pa this century (before ETF fees of say 0.10%-0.20% pa).
- With Australian inflation averaging 2.8% pa, this simple 70/30 portfolio would have returned an average of CPI+5.7% pa, beating the ‘CPI+5%’ target average return for typical long term ‘growth’ portfolios.
- There have been five years of negative portfolio returns this century (2002, 2008, 2011,2018, and 2022), but four out of five of these were followed by very strong rebound years.
So, despite the doom and gloom from the so-called ‘experts’ at the start of the year, 2023 turned out to be an outstanding year for patient, passive investors who just stuck to their long term strategy and got on with their lives instead of trying to pick markets and pick timing.
Asset classes and sectors, and benchmark index for each:
|
Asset Class
|
Sector / Segment
|
Benchmark index
|
|
Australian Shares
|
ASX 200 (including franking credits)
|
S&P/ASX200 Franking Credit Adjusted Tax-Exempt TR
|
|
Australian Financials (‘banks’)
|
S&P/ASX 200 Financials Ex-A-REIT TR
|
|
Australian Resources (‘miners’)
|
S&P/ASX 200 Resources TR
|
|
Aust Small companies
|
S&P/ASX Small Ordinaries TR
|
|
Global shares
|
Developed World Shares Hedged
|
MSCI World 990100 net TR Hgd AUD
|
|
Developed World Shares Unhedged
|
MSCI World 990100 net TR AUD
|
|
Developed World Small companies Hedged
|
MSCI World Small Cap 106230 net TR
|
|
US Shares Unhedged
|
S&P500 TR AUD
|
|
Emerging Markets Shares Unhedged
|
MSCI Emerging Markets 891800 net TR in AUD
|
|
Property & Infrastructure
|
Australian REITs
|
S&P/ASX 200 A-REIT TR
|
|
Aust Unlisted Property funds
|
MSCI Mercer Australian Core W/s PFI and predecessors
|
|
Global REITs Hedged
|
FTSE EPRA Nareit Developed ex Australia Rental Index AUD Hedged - TRAHRA
|
|
Global listed Infrastructure Hedged
|
FTSE Developed Core Infra 50/50 Hgd AUD FDCICAHN
|
|
Alternatives
|
Global Hedge Funds Unhedged
|
HFRI Fund-weighted Composite index AUD
|
|
Gold Unhedged AUD
|
London PM Fix in spot AUD
|
|
USD cash (unhedged AUD)
|
US 3m T-Bills in AUD
|
|
Fixed/floating income (debt)
|
Australian Government bonds
|
Bloomberg AusBond Treasury 0+ Yr Index
|
|
Australian investment grade Corporate Bonds
|
iBoxx AUD Corporates Yield Plus Mid Price Index
|
|
Global Government bonds Hedged
|
Bloomberg Global Treasury Scaled Index Hgd AUD
|
|
Global Corporate bonds Hedged
|
Bloomberg Global Aggregate Corporate and Government-Related Scaled Index Hgd AUD
|
|
Global High Yield bonds Hedged
|
Markit iBoxx Global Developed Markets Liquid High Yield Capped Index (AUD Hedged)
|
|
Emerging Markets Bonds Hedged
|
J.P. Morgan EMBI Global Core Index (AUD Hedged)
|
|
Australian Hybrids (grossed up)
|
Solactive Australian Hybrid Securities Index (Gross)
|
|
Cash
|
Australian Cash
|
RBA cash target
|
Thank you for your time – please send me feedback and/or ideas for future editions!