All active fund managers peak early in their careers (in terms of beating their market index anyway) - and then it is all downhill from there. Even for the best in the world.
This story is about how and why it happens, and how it impacts fund selection decisions.
In ‘Most Active Managers continue to destroy value and line their pockets with your money’ - I showed how the vast majority of ‘active’ managed funds under-perform their benchmark over any given holding period. About half of the under-performance is due to higher fees, and the other half is due to incompetence (bad stock-picking). This is nothing new. The results are more or less the same every year.
Investors would be better off using low-cost ‘passive’ index funds/ETFs in each asset class, which just buy all the stocks in the index, instead of paying expensive portfolio managers and analysts to pick stocks and try to ‘beat the market’.
Simple, low-cost, passive index funds beat most active funds most of the time. It is the same in all markets everywhere. ‘ETFs’ (Exchange Traded Funds) also offer other advantages of transparency and tax-effectiveness. With the power of compounding, even small differences in annual returns add up to big differences in wealth and incomes over many years.
Ok, so we know that only a small minority of active funds add value. So we just find them and invest in them, right?
Well, no. There is a further problem – out-performance almost always fades over time – even for the best fund managers, here and around the world, from Warren Buffett down.
Even Buffett?
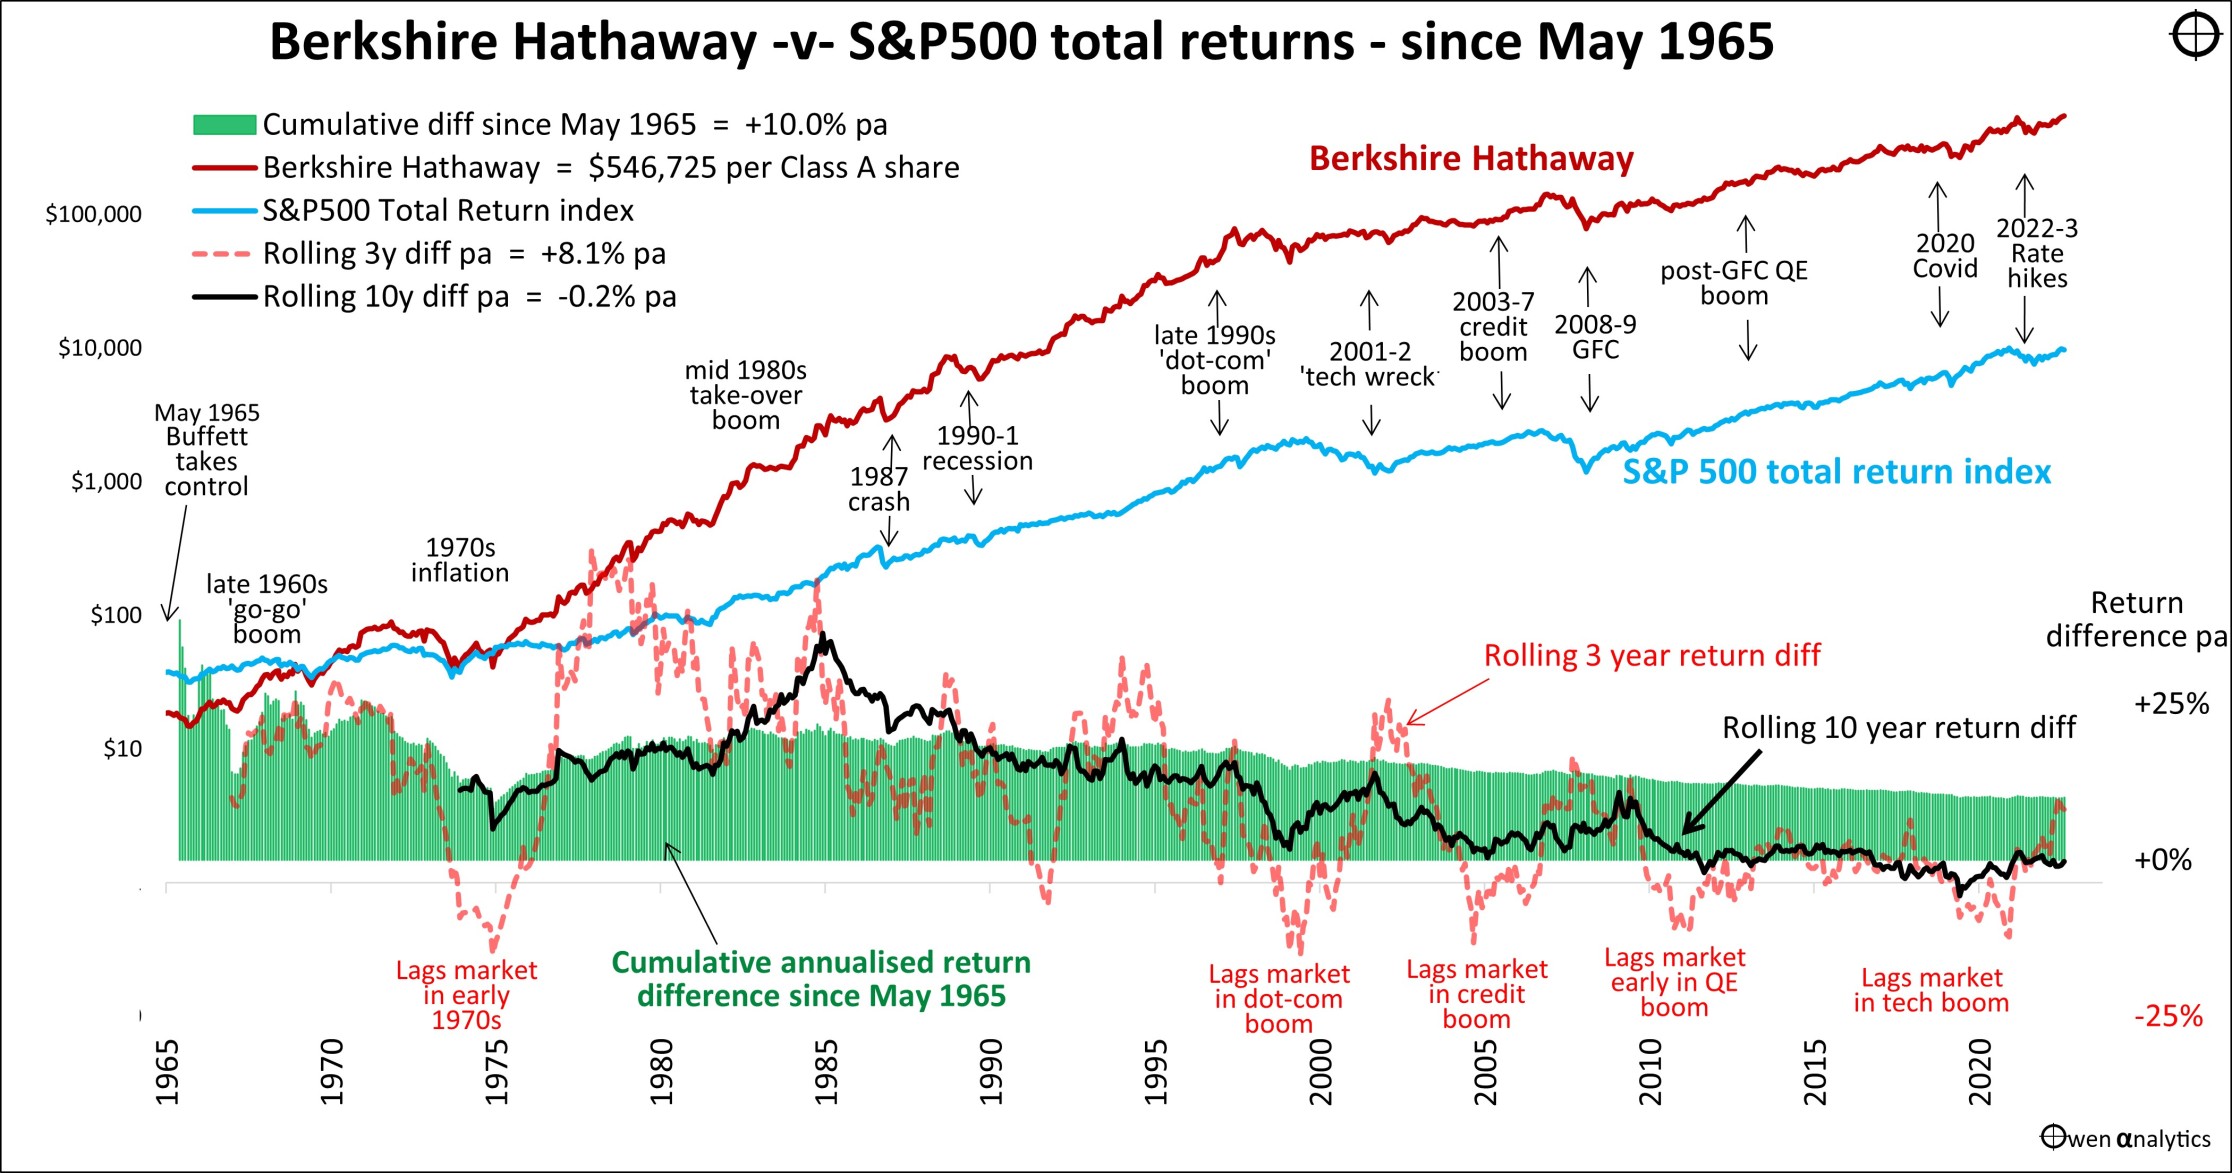
I am a long-term shareholder in Berkshire Hathaway. It has beaten the S&P500 total return index by an astounding 10.0% pa since May 1965 when Buffett took over, but most of that was in the early decades.
It has not added value against the S&P500 index since 2002 – and it’s out-performance fade curve is exactly the same as the funds highlighted here.
But that's another story for another day! This story relates to Australian share funds.
How do we know when performance will fade and they turn into expensive ‘index-huggers’ or value-destroyers, like most funds?
Performance declines over time
The SPIVA reports also show consistently that active manager performance also declines over longer holding periods.
This would tend to support the idea that the initial out-performance was luck, not repeatable skill, and the declining performance over time is just the ‘luck running out’. We look at the reasons below.
New funds usually start with out-performance
The way most new active funds are born is when a market-beating portfolio manager in an existing fund leaves their firm to start out on their own. They need at least some track record of good returns to attract initial investors.
They might have picked some tech stocks in a tech boom, or mining stocks in a mining boom, or biotechs in a biotech boom, or whatever. As booms generally last a few years, new funds set up in a boom often keep adding value while the boom lasts. If they don’t keep adding value, they don’t build viable scale and they close.
So, almost by definition, new funds generally start out with good returns, because only the winning/viable funds survive (‘survivorship bias’).
The problem is that booms don’t last. Fund managers that thrived in the initial boom often confuse luck with skill, and they think they can pick the next cycle, and the next, and the next.
They can’t. The results prove it every year!
Problems with typical performance tables
Fund reports, and research house reports (Morningstar, Zenith, Lonsec, SQM, FE, etc) use tables that show annualised performance versus the benchmark over different periods, and ‘since inception’.
For example:
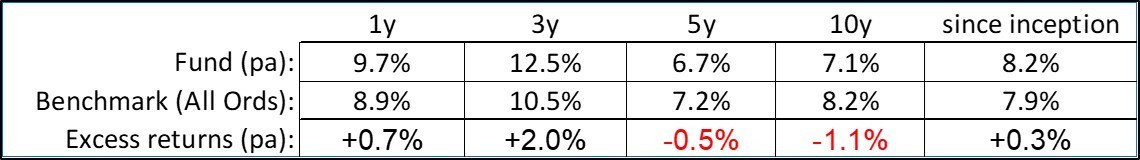
sample fund performance table
This fund looks like it has added value in recent years and also since inception.
The problem with short- and medium-term rolling period returns is that they can change significantly as each month is added. One great (or poor) month will make all rolling periods look better (or worse), so the picture changes each month.
Also, rolling period returns vary greatly through short-medium term cycles – like Covid, 2021 tech boom, 2022 rate hike sell-off. It is hard to get a sense of when, where, and how a fund added or detracted value in different market conditions.
The ‘since inception’ number is the most problematic – as we shall see.
(The above table is an actual fund – Perennial Value Wholesale share fund – IOF0206AU - included purely as an example).
Problems with typical performance charts
Fund reports and research reports also have charts like this:
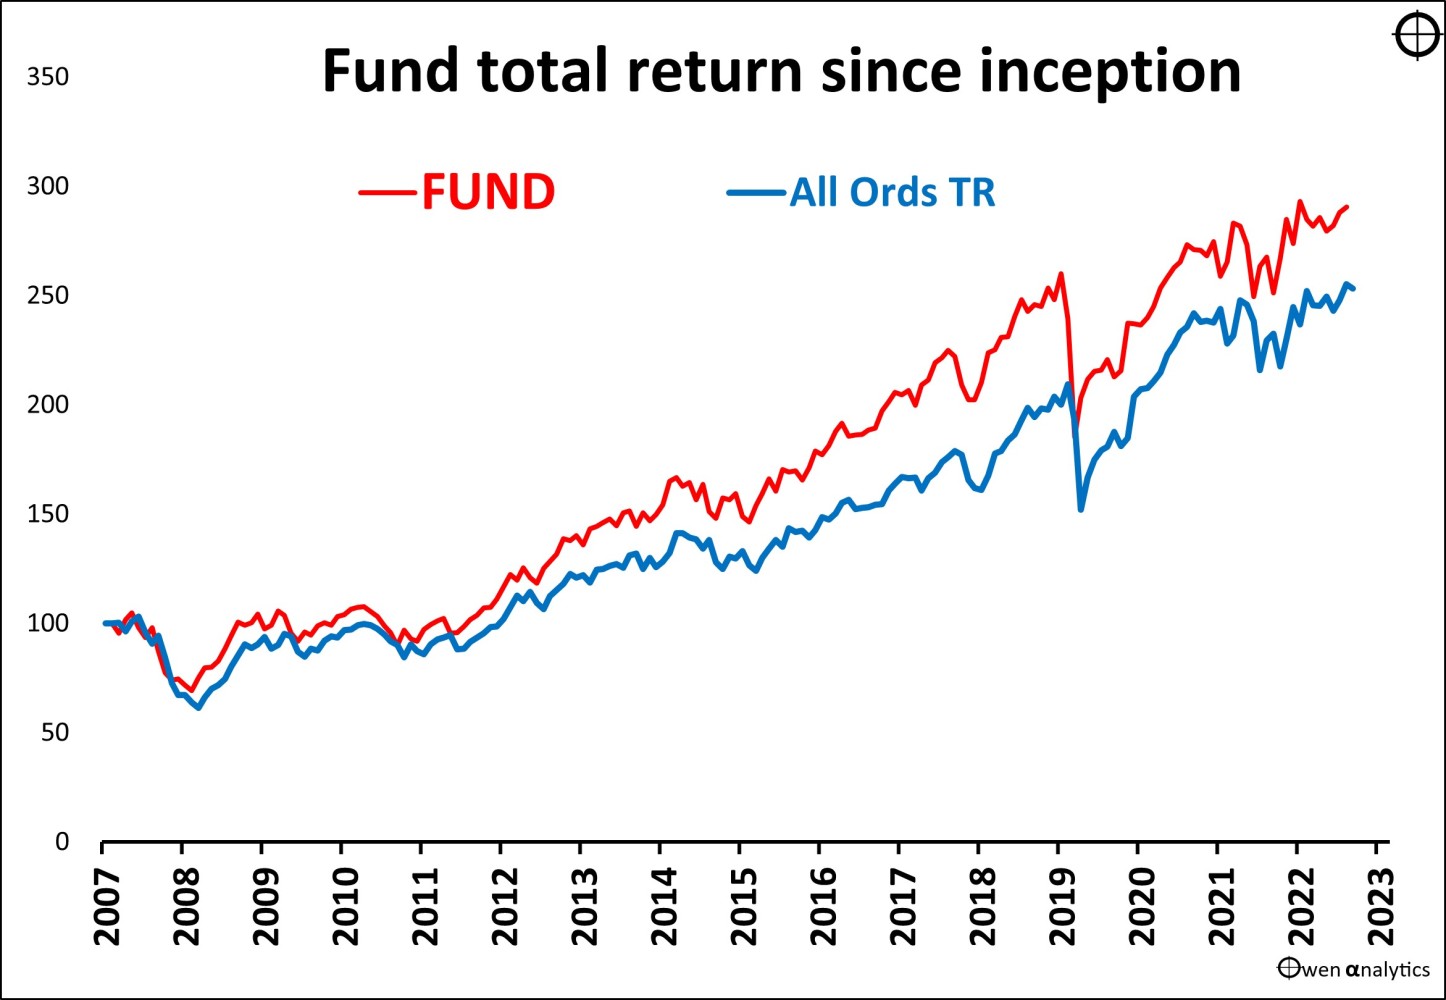
sample fund performance chart
This is a great looking fund! The fund (red line) has remained above the benchmark (blue line) for the whole period – including through the big downturns - the 2008-9 GFC, the 2020 Covid sell-off, and the 2022 rate hike sell-off.
(This is an actual fund – Solaris Core Aust Equity - WHT0012AU – included purely as an example).
What’s not to like?
The problem is that the common performance tables and charts mask the inevitable performance fade over time. (These two funds are in included in the charts below – highlighting fading out-performance over time).
‘Since inception’ returns
Fund managers love to show you their returns ‘since inception’. Why?
‘Since inception’ performance versus the market benchmark index are misleading because, in almost all cases, the best performance was when the fund was young, and those great returns are long gone. We are interested in returns in the future, not many years or even decades ago.
Tricks to improve ‘since inception’ returns
‘Gaming the start’
It is quite easy for a fund to ‘game’ their start-point by picking a good month or quarter as the ‘official’ inception date. Setting up a fund is a long process involving dozens of stages over a couple of years. Selecting a good starting point makes the historical ‘since inception’ returns look better for the rest of the fund’s life.
‘Carving out cash’
Market booms always produce a flood of new start-up funds to capitalize on the boom, but establishing a new fund takes a year or two of preparation. Often, by the time the new fund is ready to go, the boom has ended and started to turn down. Funds that started in downturns (like the GFC, etc) were probably sitting on cash waiting to be deployed. This cash holding in the initial downturn artificially boosts the historical ‘since inception’ performance versus benchmark forever.
If you ask the fund for the fund’s actual holdings over time, you can ‘carve out’ the cash holdings and measure the true returns on the funds deployed in the market.
Tracking a fund’s performance decay over time
The best way to see a fund’s performance decay curve over time is to chart the annualized cumulative excess returns since inception relative to the benchmark index over time. (You will see this for a couple of dozen funds below).
We take the fund’s monthly net return series (after fees and costs) and compare it to the monthly return series for the market benchmark index they are trying to beat (which is what we could get from a low-cost index fund/ETF).
(We also look at the shape of annualized performance versus the benchmark over periods like rolling 10 years, rolling 5 years, rolling 3 years – but they are not on the charts below. These rolling period returns are useful for seeing how the fund added value through cycles and changes in market conditions. They are much more meaningful than the 1y, 3, 5y returns on standard return tables as those are snapshots at a single point in time.)
600+ share funds, but only a handful added value
Here we focus on Australian share funds because that is the largest segment of managed funds in our market. (The performance of international share funds is significantly worse – refer to SPIVA reports).
There are more than 600 Australian share funds available to the ‘retail’ (individual investor) market. If we exclude duplications/variations, and funds that are very small and/or very new, this reduces to around 400 investable funds. Of these, only around 20% have added value over five or ten years, and only a couple of dozen funds have added value with reasonable consistency and without excessive volatility.
Below are charts for 20 popular Australian share funds that have added value – so they are among the ‘best’ of the 600+ available (on the basis of past returns, anyway).
On the chart for each fund:
- the red line is the fund’s accumulated total returns (ie capital gains plus distributions reinvested),
- the green/red line is the total returns from the benchmark index (green in booms/red in busts). In all cases the red fund line is above the blue benchmark line – ie the fund has added value overall (which is rare).
- The black line shows annualized rolling 10-year excess returns over time. These also decline in most cases.
- The important element is the green bars in the lower section of each chart – which is the annualized cumulative excess returns versus the market benchmark since each fund’s inception.
Although the charts are small, the overall picture is very clear. Excess returns (green bars) start out with a bang early in the fund’s life, but then fade over time in every case.
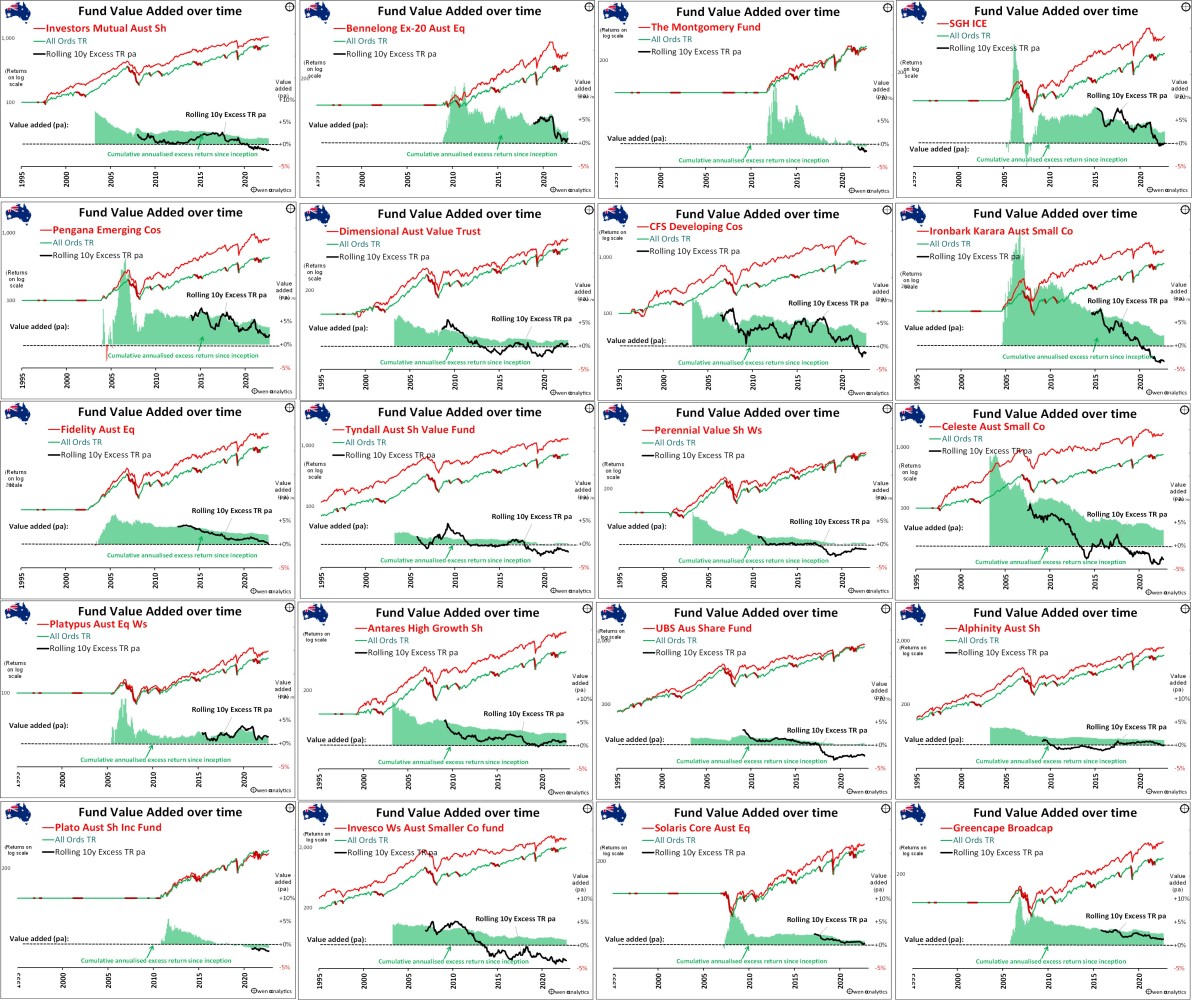
performance charts for 20 Australian share funds
There are some well-known funds here – including Investors Mutual, Fidelity, Tyndall, Perennial, Invesco, Bennelong, Montgomery, Pengana, etc. Many of these funds have won multiple awards.
Those awards were for past returns, but that has faded over time – in every case. Would we invest in them now? We KNOW that their perforance will keep fading over time.
‘Past performance is not a reliable guide to future performance’
All funds must, by law, provide a standard disclaimer like this. We are interested in future performance, of course, not how a fund might have performed in the past. Future market conditions will always be different from the past.
However, since history shows that fund manager performance never improves over time, but almost always fades - if a fund has not added value in the past, there is almost zero chance it will magically ‘find an edge’ in the future.
The problem is - if we should not look at a fund manager’s past performance as a guide to how they might go in the future, what can we look at? What school they went to? What qualifications they hold? The number of years of experience?
In reality, a fund manager’ past performance is probably the best place to start, but it is just the start.
We cannot simply extrapolate past returns into the future:
- Fund manager value add almost always FADES over time. This means:
- FUTURE performance will almost always be LOWER than PAST performance.
- Performance NEVER improves with time and experience, and they never ‘get it back’.
They fade. The only question is when and why.
Reasons for fading performance
Finding value-adding fund managers is hard enough, but even when we do fund a rare fund manager that has a track record of beating the market over more than one cycle, we know that it will fade in the future. That’s depressing!
Every fund manager in history suffered declining out-performance over time. This includes the greats like Warren Buffett, Peter Lynch, George Soros, John Templeton, and local ‘stars’ like Kerr Neilson, Hamish Douglas, and everybody else.
Declining out-performance over time is almost guaranteed - but the reasons are different in each case.
Here are what I have found to be the main reasons for fading active fund manager performance over time (not in any particular order):
- The initial boom they rode ended, and they were unable to pick the next boom, and the next, etc. It may have been skill in having an edge in the initial boom, but that edge was not transferrable into later booms. Eg what works in a mining boom might not work in a tech boom, etc.
- They just rode the boom by taking more speculative bets than other funds, and then suffered big losses when the boom inevitably ended. It is hard to recover from leveraged bets or ‘high-beta’ bets that go wrong when the boom ends.
- The market anomaly/edge they found was ‘arbitraged away’ as more and people discovered it and jumped on board, destroying the advantage.
- The market anomaly/edge disappeared as market conditions changed, so the strategy no longer works (eg the strategy might work only when interest rates, commodities prices, or exchange rates, are rising or falling, or when inflation is low, etc).
- Early successes were essentially just lucky bets, and they start to believe it was skill that never actually existed (pure survivorship bias, with no initial skill at all).
- Loss of initial drive and focus and as they got rich - no longer ‘hungry’ for success once they have ‘made it’.
- They have sold out of the business (or sold down) and no longer have the same financial incentive to succeed.
- They simply grew old/tired/bored.
- Sometimes they get distracted with the trappings of wealth and start spending more time on their outside interests and toys.
- Distracted into too many funds, strategies, structures, complexities that come with increased size. This includes product proliferation, eg LICS, new markets.
- Distracted by family problems. This may seem trite, but family distractions have played a role in the demise of several high profile ‘star’ fund managers.
- Early successes were with very small amounts of money that were easy to deploy, but now it is harder to replicate out-performance with much larger amounts that are harder to deploy (this is Buffett’s main problem).
- Increased size and layers of management and oversight make them less nimble and less willing to back their judgement than when they were smaller, with fewer stakeholders and fewer layers, and less oversight.
- More conservative now they are managing a lot of money for a lot of people who are relying on this for their life savings.
- Lack of self-reflection and introspection that is needed to critically assess their approach, leading to lack of ability to adapt and adjust when needed. I am looking for humility, not hubris.
Quantitative -v- Qualitative
Performance charts like these are purely quantitative – they just use numbers. They show us the problem but not the causes.
This is where qualitative analysis comes in. This includes interviewing portfolio managers, analysts, compliance staff, looking at ownership structures, remuneration, incentive plans, succession plans, decision processes, technology, etc.
Meeting fund managers
I have spent countless thousands of hours over the past 20 years meeting fund managers. In almost every case I am impressed by their reasons and strategies for their stock holdings. They always have very convincing stories about their stocks. But I am looking at something else.
While we are talking, what I am really thinking (and sometimes tell them) is:
‘I love the stock stories but that is not the main issue. The issues is - I KNOW your performance is going to fade. I can see how much it has faded already, and I know that it will probably continue to fade in the future. What I’m really trying to do is identify what are the causes of performance fade in your particular case, and whether they are likely to accelerate the decline’.
That comes at a shock to most fund managers! The fact is that all fund managers peak early in their careers (in terms of beating the market index) - and then it is all downhill from there. Ouch.
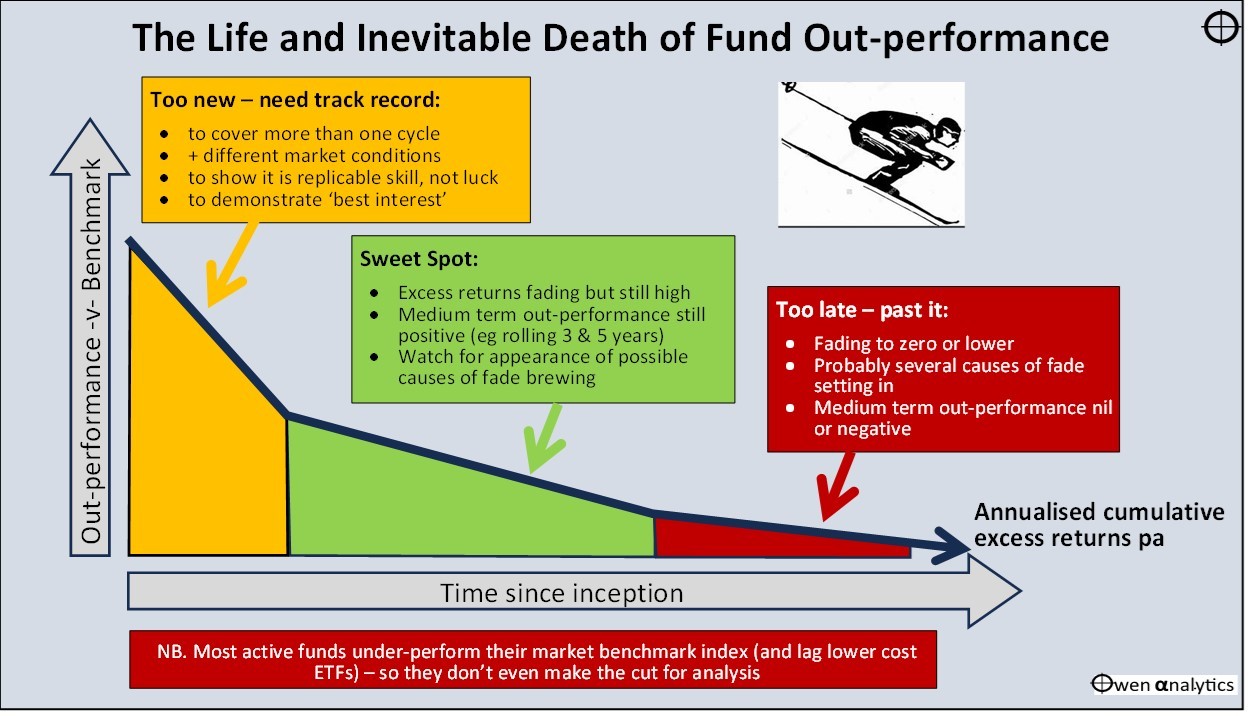
Life and inevitable death of fund out-performance
Most active funds are serial under-performers relative to their market benchmark index (and they lag lower cost ETFs) – so they don’t even make the cut for further analysis.
For the few out-performing active funds that are worth looking at, there are three phases in the life of a fund:
When a portfolio manager retires or is fired, the whole process must start again with the new portfolio manager, even if they claim to use the same strategy.
Stage 1 – ‘Too New’
We can’t invest our (or our investors’) hard-earned money on a kid with a great idea but no track record. That would be speculating or gambling, not investing.
We would need to see a track record of out-performance over at least a few years or so:
- to cover more than one market cycle
- to experience different market conditions
- to show it is replicable skill, not luck
- to demonstrate ‘best interest’ duty, or at least prudence
That would knock out all of those Johnny/Jenny-come-lately funds that jump on the current boom/fad of the day – crypto mining, lithium stocks, fin-tech etc.
Stage 2 – ‘Sweet Spot’
The sweet spot is when a fund has survived the end of the initial conditions in which the early great returns were made, and continues to beat the market for several years, in different market conditions.
- Excess returns are fading but still high
- Medium term out-performance still positive (eg rolling 3 and 5 years)
- We need to watch out for the appearance of possible causes of fade brewing or starting to affect behaviour or returns
We need to keep a close eye on it because it will inevitably transition to the next stage –
Stage 3 – ‘Too Late’
Unfortunately, this is the graveyard for even the best fund managers.
- excess returns fading to zero or lower
- probably several causes of fade have been setting in for a while
- medium term out-performance nil or negative
Just as there is no such thing as a reliable, ‘set-and-forget’, ‘buy-and-hold’, ‘blue chip’ stock, there is also such thing as a reliable, ‘set-and-forget’, ‘buy-and-hold’, ‘blue chip’ share fund.
A note on forecasting fund returns
As portfolio managers, we can’t avoid the need to forecast returns (‘Forecasting is dangerous – especially about the future!’)
Where I use active funds in portfolios, I never forecast any excess returns from the active funds. Eg for the Australian shares part of a portfolios, I would use my forecast for the overall market, less the fees on the lowest cost broad index fund - eg an ASX300 ETF).
That way, any excess returns from active funds is a surprise bonus! It does happen from time to time - just not often as I would like…
Thank you for your time. Please let me know your thoughts.
If you think this does not apply to the best investor in the world - Warren Buffet - you may want to read this:
· Warren Buffett: world’s greatest investor, but even he lost it 20 years ago. How I still scored a free lunch! (24 Sep 2023)