The US share market is soaring on strong profit rebounds in the past year, and bullish future profit growth forecasts for the next couple of years.
Pricing levels are nearing ‘dot-com’ boom levels at the end of the 1990s. Here is a quick snapshot on:
- Current price/earnings ratios – expensive but extreme yet?
- Profit outlooks – also bullish, but how outlandish are they?
- Short and long-term interest rates are both relatively low given the inflation task
- Why pricing is different to timing and triggers
Bullish profit forecasts, plus bullish multiples of those profits and forecasts, gives us a ‘double-whammy’ of over-pricing.
Today’s chart shows the US market and key drivers - through recent boom-bust cycles over the past three decades:
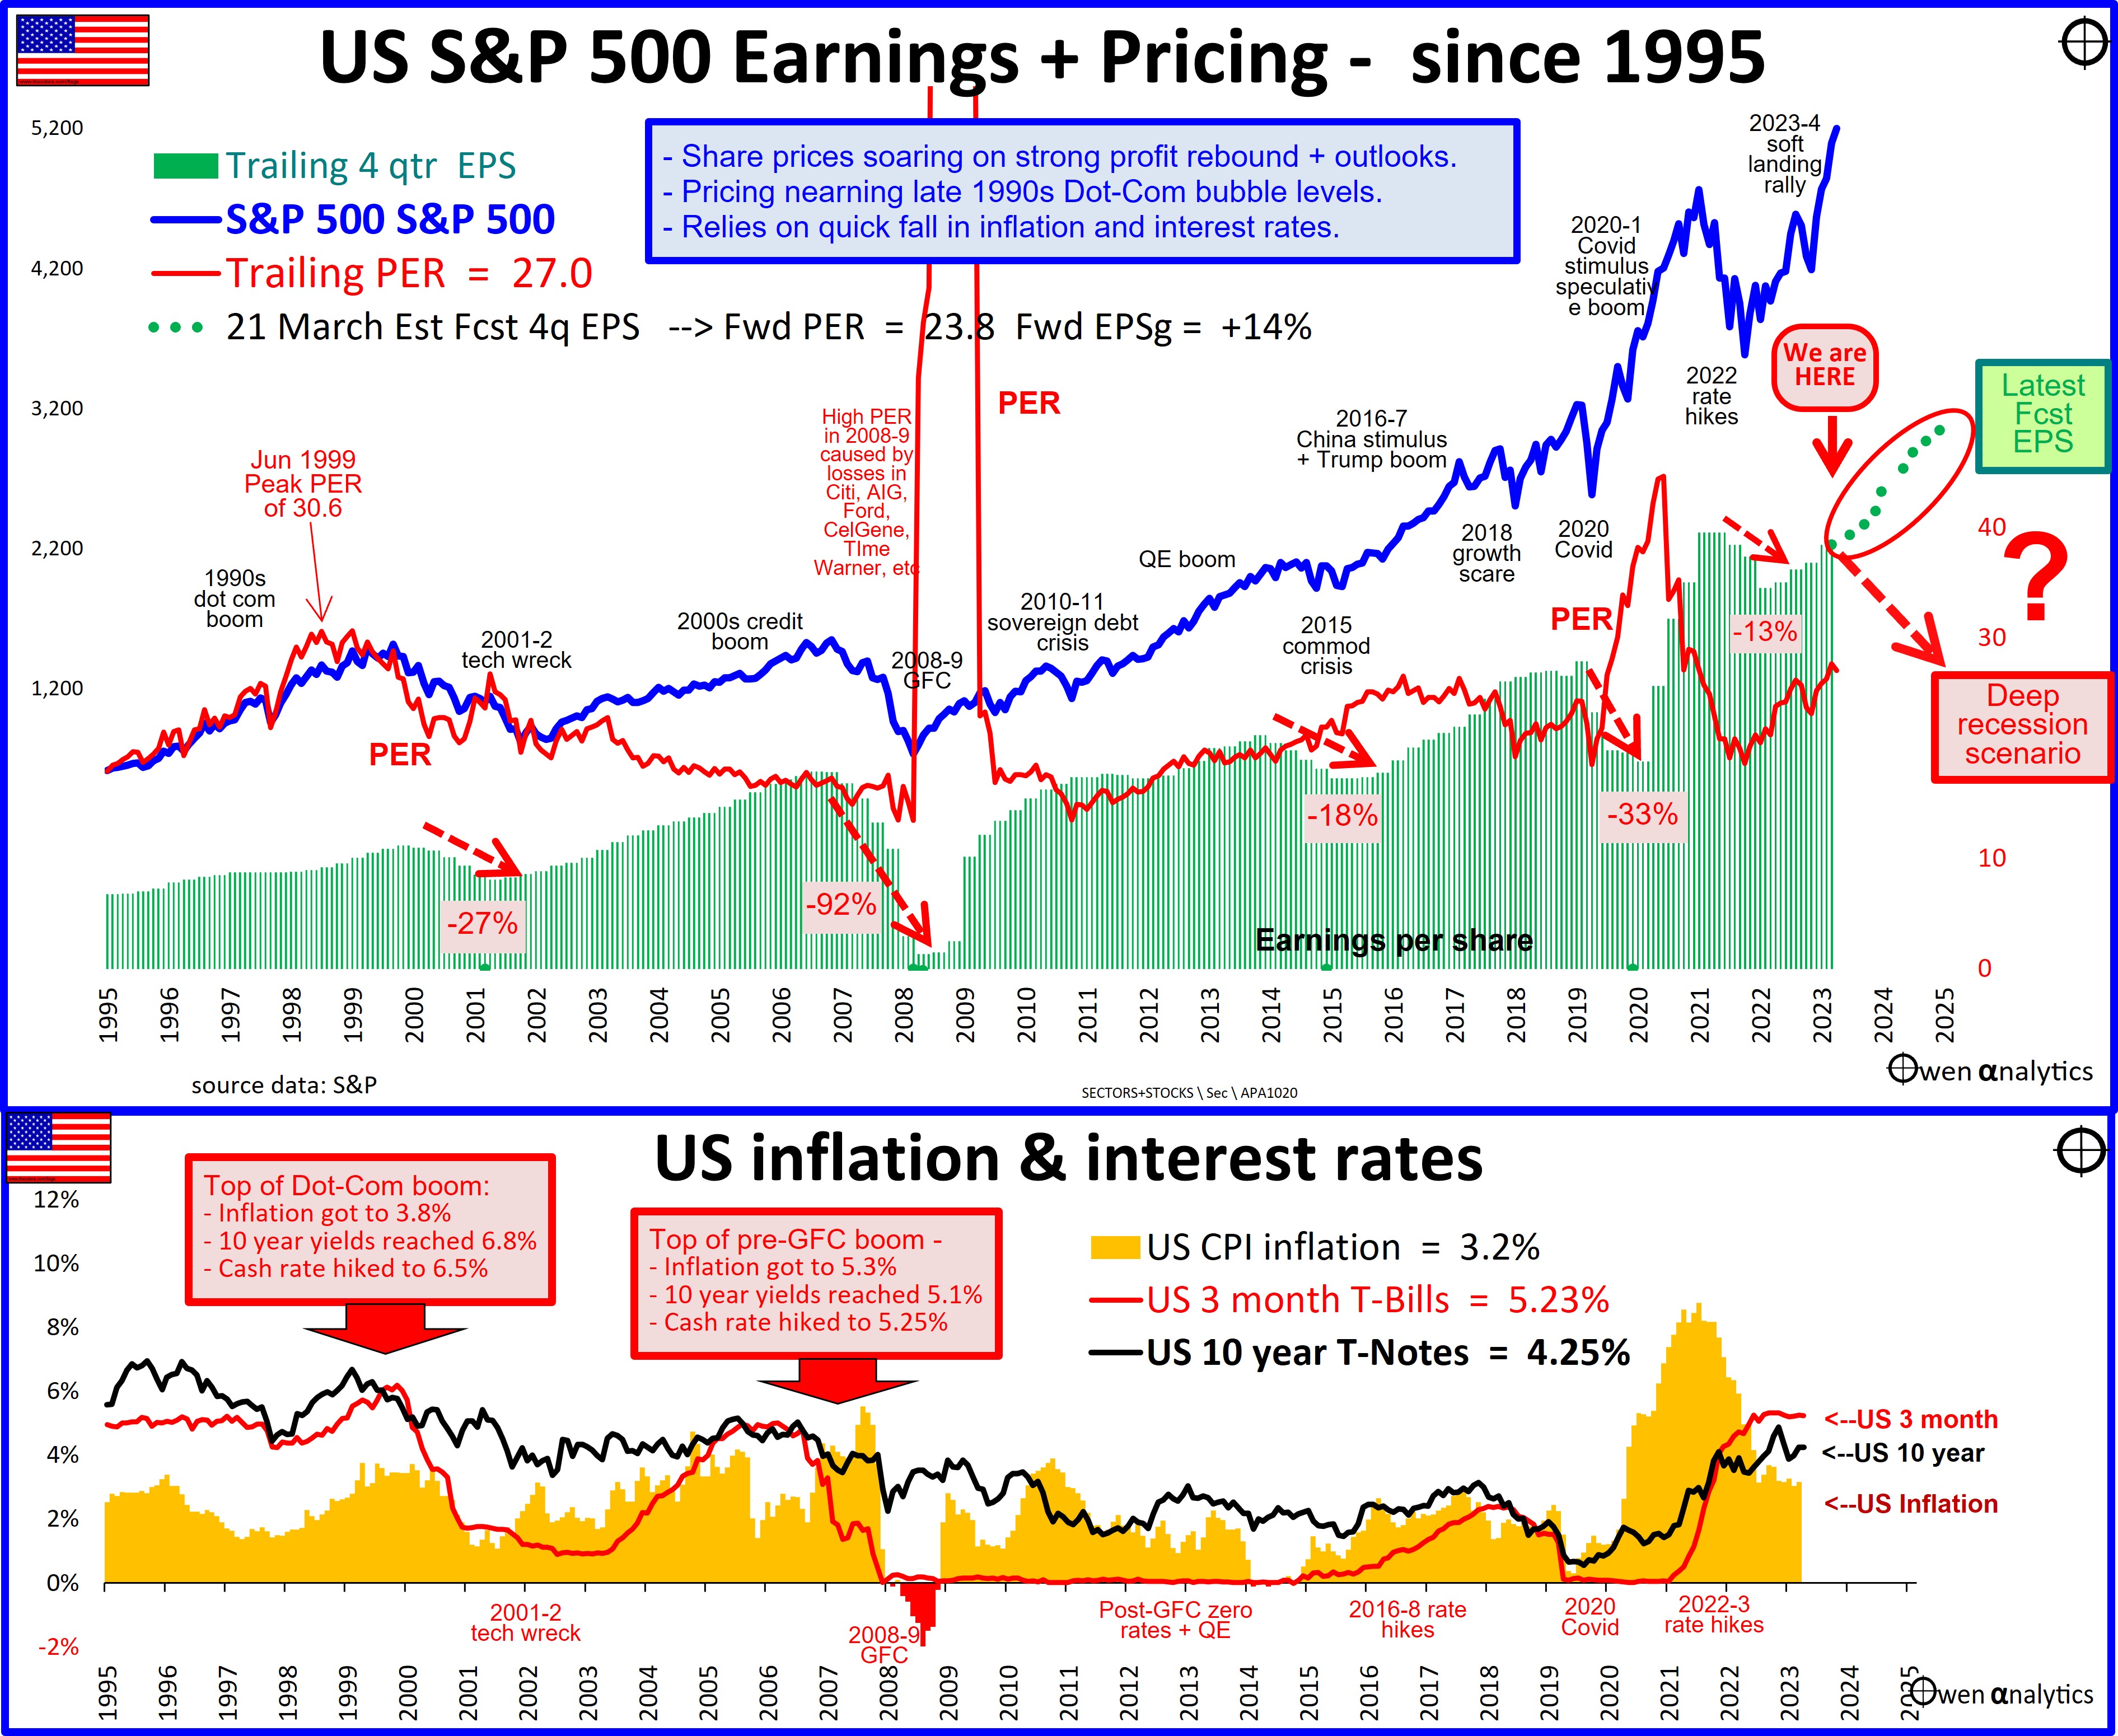
The main sell-offs during this period were:
- 2001-2 ‘tech-wreck’ following the 1990s ‘dot-com’ boom,
- the 2008-9 ‘global financial crisis’ following the 2003-8 China/credit boom,
- the mid-2000s commodities collapse following China’s GFC stimulus boom. This was not a major share-sell-off or recession, but the commodities collapse did trigger a oil/gas/steel bankruptcy crisis that resulted in a US / global ‘earnings recession’,
- the recent 2022 rate hike sell-off. This, too, did not result in the much-feared, and much-forecast US/global recession, but it did cause a moderate earnings contraction.
To the far right we can see that the S&P500 index is sky-rocketing to new record highs in 2024.
2 . Aggregate earnings per share (green bars)
Aggregate earnings per share (EPS) also rises and falls through the boom-bust cycles. Profits collapsed after share prices fell in the busts.
Or, put another way, share prices do NOT fall because, or when, company profits collapse. Share prices fall in advance of, and in anticipation, of profits collapsing in the near future.
Profit collapses
The aspect to focus on with aggregate EPS is the profit collapses. There have been five significant collapses in market-wide profits over the past three decades – about once every half decade on average.
- Aggregate earnings per share fell by -27% in the 2001-2 tech-wreck after the ‘dot-com’ boom,
- fell by -92% in the GFC following the 2003-7 China/credit boom (the main contributors to this collapse are noted on the chart),
- fell by -13% in the mid-2000s commodities collapse following China’s GFC stimulus boom,
- fell by -33% in the Covid lockdown recession,
- fell by -13% with the Fed’s aggressive rate hikes in 2022.
3 . The ‘trailing’ price/earnings ratio for the S&P500 market (red line).
The price/earnings ratio (p/e ratio or PER) is the index price divided by the ‘trailing’ (ie backward-looking) aggregate earning per share over the most recent four quarters.
Contrary to a common market myth, high p/e ratios usually don’t mean the market is ‘expensive’. Most of the high p/e ratios have been when profits collapse, which is usually in the early stages of share price. The highest p/er ratio in the past 30 years an extraordinary 148 in 2009 due to the collapse in profits in the GFC.
The current trailing p/e ratio for the S&P500 market is a rather high 27.
How high?
For the US market (S&P500) – the median trailing price/earnings ratio has been 17.4 times earnings.
However, most people use median p/e over a more recent period. For example, since 1980 the median has been 19.8.
Using a period like ‘since 1980’ sounds nice, but the post 1980 period was the wonderful era of disinflation, deregulation, laissez-faire, smaller government, free trade, and globalisation.
That golden era is clearly over, and the median p/e ratio of 20 since 1980 is probably not that relevant any more.
We are now into a new era of re-inflation (or at least no more disinflation), re-regulation, interventionist, big government, protectionism, and de-coupling, so let’s base or median p/e ratio on a longer period which includes more than just the recent post-1980 golden era.
Either way, the current price/earnings ratio is very high.
4 . Current broker consensus forecasts for EPS
Current consensus EPS forecasts (based on analysts estimates and company guidance) is indicated by the green dots to the right of the green EPS bars, and highlighted in the red oval. This is the basis of current sentiment and pricing.
In the three months so far in 2024, consensus earnings forecasts have been rising – driven primarily by evidence of slowing inflation, confidence in a ‘soft landing’, and expectations that the Fed will soon cut interest rates significantly. Another element has been the gathering of momentum in the ‘A.I.’ frenzy.
Profit forecasts are very bullish
After aggregate earning per share fell by -13% in 2022, profits recovered almost all of the 2022 fall with a rise of +11% in 2023. Current consensus forecasts are for another rise of +14 in calendar 2024 and then a further rise of +15% in calendar 2025.
This is extraordinarily bullish, given that nominal GDP growth is likely to be in the order of say 5% to 6% (being real GDP growth of say 3% to 3.5% plus inflation of say 2.5% to 3%).
This limits top-line revenue growth because the US giants already have dominant market shares globally (and China increasingly shutting out access to US companies already selling into China).
With wages rising, the forecast big jumps in bottom line growth is based on big cuts to interest rates - back down near the wonderful days of ZIRP (zero interest rate policy). The only way we will get big cuts to inflation and interest rates is another deep recession.
Broker/analyst forecasts: USA -v- Australia
A side-note on consensus earnings forecasts: US broker/analyst forecasts have for many years been systematically under-forecasting actual reported profits. In recent decades, actual reported profits have ‘beaten’ consensus forecasts by around 70%-75% of the time.
So far this year, the ‘Beats’ are running at around 74% - ie 74% of companies have beaten their consensus earnings forecasts.
This gives us some confidence that profit forecasts are probably going to be exceeded in the absence of a recession or other major crisis. Even if profit forecasts appear to be optimistic, they turn out to be exceeded three quarters of the time.
It is the opposite of Australia. In our local market, company forward guidance and broker forecasts are chronically over-optimistic, and are inevitably toned down during the course of the year as reality sets in. Australian companies, on the whole, seem to have a hard-wired ability to come up with new and innovative ways to fall short of their grandiose promises and bullish broker reports at the start of each year.
How bullish are the profit forecasts?
The average earnings per share growth for S&P500 companies has been 6.0% pa since 1980, and 6.1% pa since 1950. These are rather modest growth figures, but that is what the US market has delivered for many decades.
It makes sense that US earnings growth has been more or less in line with the growth in the overall US economy. US nominal GDP has grown by 5.4% pa since 1980, and by 6.5% since 1950, which are more or less the same as US EPS growth rates.
The current forecast growth rates for earnings per share for 2024 and 2025 are two to three times historical average growth rates.
It is not as if profits are rebounding from a big profit crash like the GFC or the Covid recession, where high post-crash profit growth is really just getting back on to the pre-existing trend.
The green dotted forecast line on the current cuart is clearly soaring well ahead of recent and long-term trend growth.
‘Recession scenario’
Also on the right end of the green EPS bars is our ‘recession scenario’, which would see profits collapse by say 30-40% or, so as in previous recessions.
Investors sold down shares heavilyl in 2022 anticipating a big recession crash in profits, but profits only fell by -13%, so investors cut their losses and jumped back into the market in the current 2023-4 rally.
Then, after the aggressive rate hikes of 2022, the majority of economists at the start of 2023 were predicting a recession in 2023. That did not eventuate either.
Clearly, the broker earnings forecasts are not predicting a recession, but a three times the rate of growth in the overall economy!
5 . ‘Forward’ p/e ratio
The forward price/earnings ratio is the current price index level divided by forecast earnings over the coming (forward) 12 months. The forward p/e ratio for the S&P500 market is currently 24.
This is overly bullish for two reasons: First, because the forecast earnings growth rates appear overly bullish, and second, because the multiple I am paying for those overly bullish earnings is also too high.
Inflation and interest rates
The current tech boom is similar to the late 1990s tech boom in many, but not all, respects.
One of the lessons from the last big tech boom and bust is the fact that the tech bubble only affects a handful of speculative stocks in one corner of the market does not mean that it cannot bring down the entire market, and the economy with it into a deep and broad economic recession and a collapse in market-wide profits.
The lower section of the chart shows US inflation (orange bars), yields on 10-year Treasury notes (black line), and 3-month Treasury bills (red line).
The Fed’s target range for cash is currently 5.25%-5.5%, but 3-month T-bills are at the bottom of this range, at 5.23%.
Long term interest rates are just as important as cash rates as they form the basis for setting discount rates for pricing/valuing long term assets including shares and real estate. The higher the discount rate, the lower the value of the asset.
Covid stimulus inflation spike
The stand-out feature of the lower chart is the Covid stimulus inflation spike, which towers over previous inflation spikes in the period covered by the chart.
The problem is that, although inflation has been higher now than in past two cycles, cash rates and bond yields are not.
The two key comparisons are highlighted in the two boxes – indicating what happened at the end of the two previous share market booms, right before the share market collapses.
At the top of the late 1990s ‘dot-com’ boom right before the 2001-2 ‘tech-wreck’:
-
- US 10-year yields rose to 6.8%,
- and cash rates were hiked to 6.5%
- to kill inflation running at 3.8%.
- (but when rates here hiked to 6.5%, CPI inflation was just 3.1% - like today)
At the top of the 2003-7 China/credit boom before the 2008-9 GFC:
-
- 10-year yields rose to 5.1%,
- and cash rates were hiked to 5.25%
- to kill inflation running at 5.3%.
- (but when rates here hiked to 5.25%, CPI inflation was just 4.0%)
Today, cash rates are still just 5.25% (not 6.5% as they were before the ‘tech-wreck’), and 10-year yields are just 4.25% (a good 1%-2% lower than they were in the prior cycles.
Short-term and long-term interest rates are still lower today than they were in the prior cycles, when inflation was more subdued than in the current cycle.
The only thing that would bring inflation and interest rates down significantly would interest rates down would be a broad economic recession, like the tech-wreck or the GFC. Clearly that is not priced into current market pricing.
Conclusions
The US share market is soaring on strong profit rebounds and bullish future profit growth forecasts.
Pricing levels are nearing ‘dot-com’ boom levels at the end of the 1990s that collapsed into the 2001-2 ‘tech-wreck’ and broad US/global recession.
Although US consensus profit forecasts are historically conservative most of the time, the current set of market-wide profit forecasts appear overly bullish, well above trend, and well above the economy’s growth potential.
In addition, the pricing multiples being paid for those profits and profit forecasts also appear overly bullish. So it’s a ‘double-whammy’ of over-pricing.
Short-term and long-term interest rates are still lower than they were in the prior cycles, when inflation was more subdued and much quicker to come down than in the current cycle.
Short and long term interest rates cash rates, and bond yields turned the last two big share market booms into busts. They were not the triggers for the bust, but they were the enabling conditions.
Short- and long-term interest rates are still relatively low given the inflation task, so short- and long term rates are not going to quickly come down, short of a recession, which would also end the share market boom.
'But it’s just a handful of tech stars!'
The 2001-2 ‘tech-wreck’ taught us that the fact that the overall market pricing is due mainly to a handful of over-priced tech stocks in one corner of the market does not mean that it cannot bring down the entire market, and the economy with it into a deep and broad economic recession.
Pricing -v- timing & triggers
On the pricing front, the US share market as a whole appears to be in a ‘double-whammy’ of over pricing, but this tells us nothing about timing.
An over-priced boom can run on for several years into even more over-priced territory until the final trigger for collapse.
For the US share market, the 1990s was virtually a straight line upward until it finally came undone in 2001-2 tech-wreck.
(In Australia we had a slower and choppier decade in the 1990s – we has the 1992-3 banking crisis, and our market suffered more in the 1994 bond crisis, 1997 Asian currency crisis, and 1998 Russian default crisis).
The US also had an almost straight line upward from 1921 to 1929 (and we know what happened next!).
The current boom is not even two years old yet (since the -25% fall in January-October 2022). It could run on for several more years. It could even break the pricing records set in 1999 and 1929. Records are meant to be broken!
Although expensive pricing does not cause busts, it does increase the vulnerability and sensitivity to triggers that will one day end the party.
As to the trigger for the next bust, I have some ideas – that’s another story for another day!
See also:
‘Till next time – happy investing!
Thank you for your time – please send me feedback and/or ideas for future editions!