Recessions do NOT cause or trigger share market sell-offs. Nor do share markets crash because, or when, they become expensive.
Share markets fall when shareholders en masse suddenly start to expect imminent big cuts to profits and dividends.
Economic growth numbers (including ‘recessions’) are outcomes, not inputs or drivers of share prices.
Share market crashes are actually a good thing for long term investors!
Timing
Share prices fall before profits fall, and well before economic recessions are announced. Conversely, shares rebound before profits bottom out and start to recover.
In fact, share markets do best in the middle/late stages of recessions, when losses are being reported, dividends are being cut, media headlines are full of bankruptcies and collapses, and economies are contracting.
For example - the great share market surges out of the middle of economic contractions and recessions in 2020-1, 2009, 1991, 1982-3, and numerous prior cycles.
Current US snapshot
To see where we are now, these charts track the critical factors through the past five boom/bust cycles.
Before looking out our local market (Australia), it is always better to start with the US market first, because it is the largest and most influential market that affects all global markets, asset classes, and investors.
What happens on our local market is almost always driven by what happens on Wall Street, regardless of local conditions, events, or pricing. (I will follow this story up with the Australian picture in a few days.)
US share market pricing, earnings, dividends, interest rates, inflation, bond yields, economic growth, recessions, price/earnings ratios, dividend yieldss
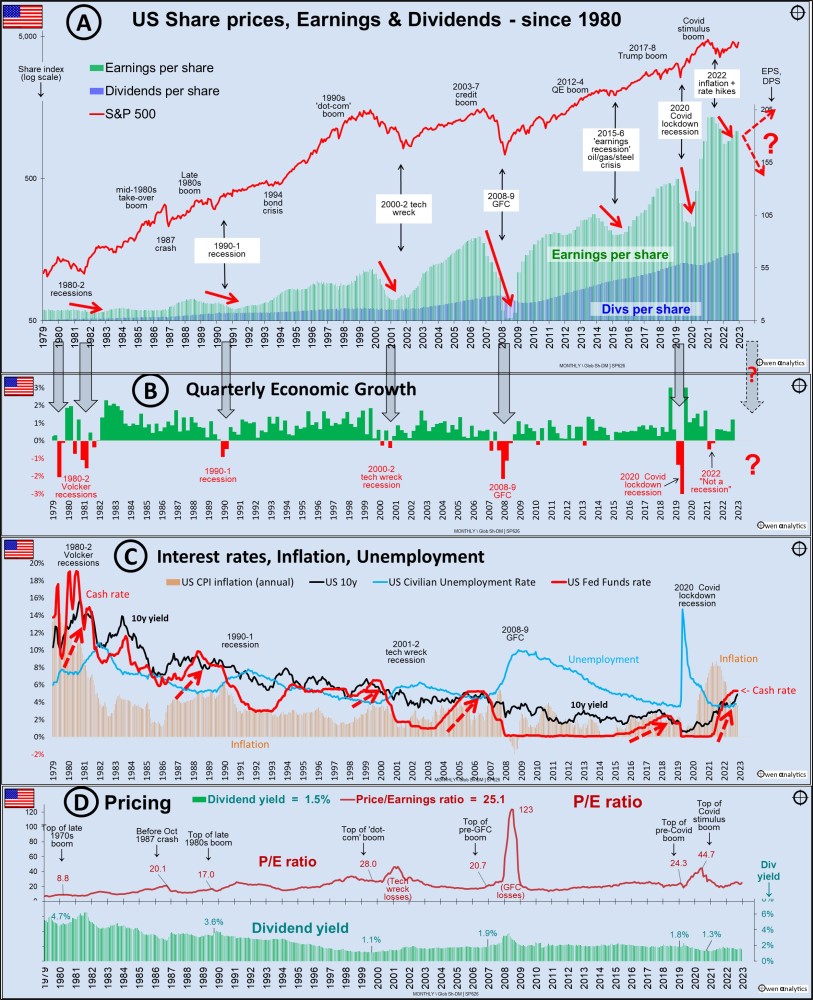
A: Prices, earnings, dividends
Chart A shows the US S&P 500 price index. The bars in the lower section of Chart A show aggregate profits (earnings per share) (blue bars), and dividends per share (green bars).
The big share market falls start BEFORE profits and dividends are cut (red arrows). Likewise, share prices start to rebound BEFORE profits and dividends start to recover.
B: Economic growth and Recessions
Chart B shows quarterly economic growth rates, highlighting the major contractions and recessions. Economic recessions start AFTER cuts to profits and dividends start. Dividends are usually still being cut well after share prices have started to recover.
C: Macro factors
Chart C shows the main ‘macro factors’ - inflation (orange bars), cash rates (red line), bond yields (black line), and unemployment (blue line).
Each economic recession occurred after periods of rising inflation and interest rates. In most cases, inflation and interest rates had been rising for some time, and it was the late stage rate hikes that triggered the collapses in share prices, spending/revenues, profits, economic growth, and employment - in that order.
D: Market pricing
Chart D shows two common measures of stock market pricing: ‘price/earnings’ ratios (maroon) and dividend yields (green). These are not as critical as many people think.
Share markets can crash when pricing is expensive or cheap, so high pricing does not mean a crash is imminent. The market can remain expensive, and become even more expensive, for years before finally crashing.
The current overall market price/earnings ratio of 25 times earnings is on a par with levels prior to four out of the past five crashes that preceded recessions, and also prior to the October 1987 crash.
However, share markets do not fall when, or because they are expensive. The ‘moderate’ pricing just before the GFC did not prevent the market from collapsing.
The main reason is that the ‘e’ (earnings) are often fudged, inflated, and/or unstainable in booms, so the price/earnings ratio is artificially and deceptively low and under-states the true level of over-pricing.
See also: US ‘Shiller/CAPE’ ratio It’s flashing orange. . . but what action should we take?
Dividend yields
Dividend yields are probably a better measure of value. Dividends are hard cash, whereas reported ‘profits’ are very rubbery and easily fudged by accounting trickery.
The current dividend yield of 1.5% for the S&P500 market is very low historically, and lower than it was before prior to every crash except the ‘tech-wreck’.
This makes the market more vulnerable to fall when it does fall, as almost all crashes were accompanied by (or triggered by) cash rate hikes, making low dividend yields less attractive as cash rates rise.
Where are we now?
At the far right of Chart A we see what has happened to aggregate profits in recent years:
- profits fell heavily (-33%) in the second half of 2020, while share prices rebounded strongly back after the Covid crisis
- rebounded strongly to peak in early 2021
- profits fell -14% during 2022
- but profits have been heading back up again during 2023
Where to next?
The key question for investors is - are profits going to keep rising to new record levels, or are we now at the cusp of the next big collapse in aggregate profits – indicated by the potential red arrow on the right side of Chart A?
2008-9 GFC
At the top of the early-2000s boom before the 2008-9 GFC sell-off, the US Fed hiked cash rates 17 times from 1% to 5.25% (the same as now), to kill off inflation that was running above 4% by late 2007.
Cash rates were held at 5.25% for a year while inflation fell from above 4% back below the 2% target.
Those rate hikes, plus oil prices at $140 per barrel, would have been enough to cause big profits cuts (and economic recession) anyway. Then Lehman hit, turning it into a ‘global financial crisis’.
2001-2 ‘tech wreck’
At the top of the late 1990s ‘dot-com’ tech boom before the 2001-2 ‘tech wreck’ sell-off, the US Fed hiked cash rates from 4.75% to 6.5%, to kill off inflation that was running at 3.5% by 2000.
Even though it was ‘only’ a narrow tech bubble that didn’t really affect other ‘real companies’ with ‘real earnings’ in the ‘real economy’, the collapse of the speculative tech stocks managed to bring down the entire S&P500 market.
Aggregate profits fell by -55%, the S&P500 index fell by -46%, and it caused an economy-wide recession. A lot of damage from a relatively narrow tech bubble.
Current tech boom
The current tech boom is similar to the late 1990s tech boom in many respects. The fact that it only affects speculative stocks in one corner of the market does not mean that it cannot bring down the entire market, and the economy with it.
Most important are cash rates, inflation, and pricing.
This time around, cash rates have been hiked to 5.5%, but inflation on various measures (‘CPI’, ‘core’, ‘PCE’) are all still running well above target, and above what they were in the past few cycles.
Cash rates are probably going to be raised further and/or retained flat for an extended period.
The current market chatter boosting share prices is the hope of rate CUTS. Rates would only be cut when inflation drops back below 2% - and the most likely cause would be a broad economic recession.
Cash rates certainly are not going to return to the post-GFC and post-Covid ultra-low levels that many people started to take for granted.
Pricing still stretched
On the pricing front, with profits running well above sustainable trend, and share prices at elevated multiples of those elevated profits, the market is highly vulnerable. Not as extreme as it was at the end of the 1990s tech bubble, but there is no margin for error.
The fact that the current over-pricing is caused by a narrow handful of tech giants is no comfort. It was the same in the late 1990s tech boom, and the bust brought down the entire market and the broad economy.
There will be a fall in share prices, profits, and economic slowdown (in that order). What we don’t now is the timing, and the trigger.
We have had a few isolated trip-ups so far – FTX, the regional bank crisis, and WeWork – but nothing major yet.
The trigger might be a major Lehman-like crisis, or it might just be the cumulative impact of interest rates, inflation, and fuel prices grinding down consumer spending and confidence.
No calm, flat lines
One theoretical outcome would be that there is no ‘Lehman’ moment that triggers a major fall this time. Maybe share prices could just settle down and remain flat for a year or so while profits catch up?
That would be nice, but the problem is the market never remains flat or calm. Take a look at the top chart. There are no flat horizontal lines. Nor are there any smooth, steady, gently upward-sloping straight lines.
Share markets are not driven by quiet, calm, rational logic.
They are driven by human emotions. Prices are always either surging strongly in a ‘FOMO’ frenzy, or falling sharply in a mad panic. That’s just hard-wired human nature!
Panic buying/selling frenzies are a good thing!
Long term investors ignore market chatter. During the wild booms they ignore the FOMO buying frenzy and spend time researching and finding great companies. In the busts they ignore the panic selling and buy their targets when they are over-sold.
Great companies are hard enough to find, but they are even harder to buy, because they are almost always too expensive. Usually, it is only in the broad sell-offs that great companies are cheap enough to buy.
Rather than spending time trying to pick the market ups and downs, it is usually better to spend the time making sure our ‘buy list’ of target companies is up to date and ready to be actioned when sell-offs arrive.
I might not know when the next big sell-off will be, but I know what I will be doing when it does.
Stay tuned for the equivalent analysis of the Australian share market – it is quite a different picture.
See also:
US ‘Shiller/CAPE’ ratio It’s flashing orange. . . but what action should we take?
US profits - recession or rebound? - Where are we now?
Australia v US share markets – it’s our turn next!
‘Till next time – happy investing!