Key points:
-
-
- In the March quarter reporting season, S&P500 companies posted good earnings growth of +13% for the past 12 months, following decent +9% growth in the previous 12 months.
- Consensus forecasts for the NEXT two years have been CUT over the past month (tariff impact fears), but they are still forecasting an ACCELERATION of earnings to +15% growth in calendar 2025, plus another +15% growth in 2026. That’s still incredibly ambitious.
- Current S&P500 pricing is also at a very bullish 28 times trailing (past 12 months) earnings, and 25 times next year’s ambitious earnings forecasts. These are very optimistic multiples on very optimistic, accelerating earnings outlooks – a double layer of over-confidence, and highly vulnerable to negative shocks.
- But so far, investors have shrugged off Trump’s tariffs, a negative quarter of US real GDP, and also Moody’s credit downgrade. Are US company earnings and investor optimism invincible?
US profit and pricing cycles – where are we now?
A couple of weeks ago I reported on the current CAPE ratio measure for the US share market:

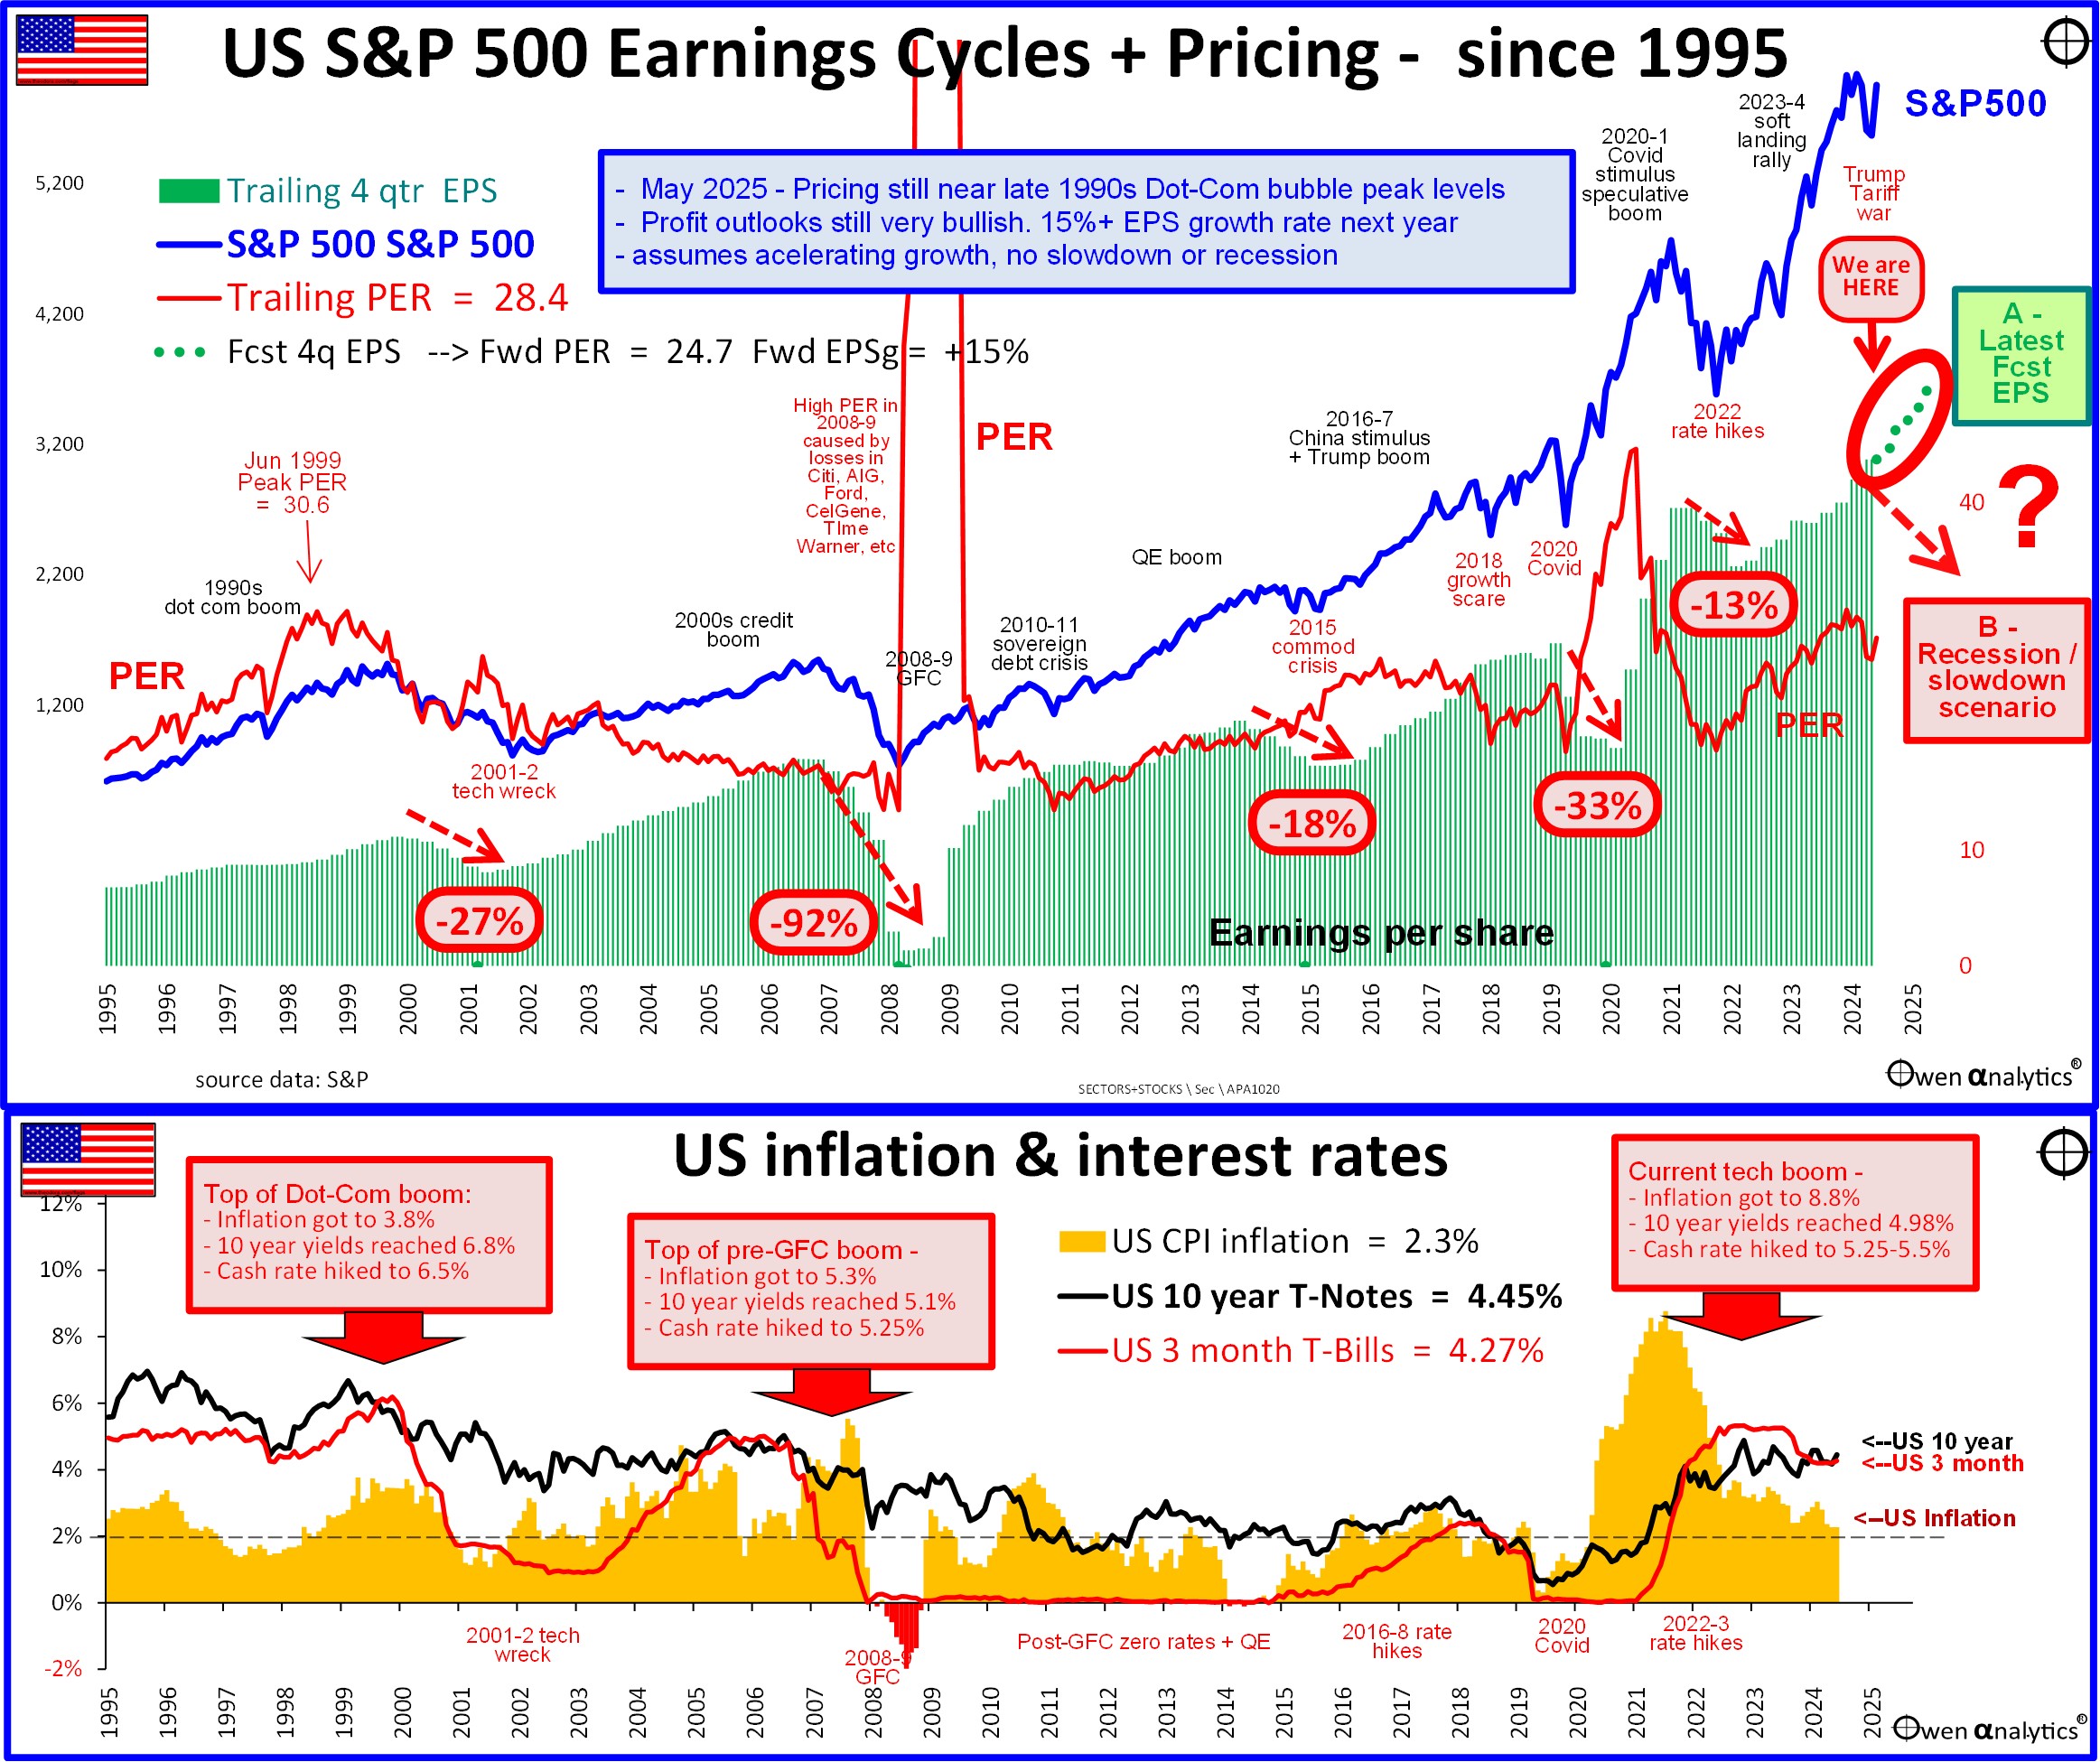
Today’s chart drills down into more detail on how the current levels of profits and pricing relate to the recent profit and share prices cycles in the past three decades. Where are we now?
The key challenge is this – can aggregate earnings per share keep accelerating as predicted (green dots highlighted to the right of the upper chart) – or will earnings fall back as they have always done in prior cycles?
Here are the main components of the charts:
1. S&P500 price index
The blue line in the upper section is the S&P500 price index – showing the main boom-bust cycles:
-
-
- The 2001-2 ‘tech-wreck’ following the late-1990s ‘dot-com’ boom,
- the 2008-9 ‘global financial crisis’ following the 2003-8 China/credit boom,
- the mid-2000s commodities collapse following China’s GFC stimulus boom. This was not a major share-sell-off or recession, but the commodities collapse did trigger an oil/gas/steel bankruptcy crisis that resulted in a US / global ‘earnings recession’,
- the recent 2022 rate hike sell-off. This, too, did not result in the much-feared, and much-forecast US/global recession, but it did cause a moderate earnings contraction.
To the far right we can see that the S&P500 index sky-rocketed to new record highs in early 2025. There was a sharp 19% dip after Trump announced his ‘reciprocal tariffs on 2 April, but quickly rebounded after Trump’s backflip a week later. The market is now back to within 3% of its all-time highs.
2. Aggregate earnings per share (EPS)
The green bars in the upper section show aggregate earnings per share (EPS) for the S&P500 companies. This also rises and falls through the boom-bust cycles, but the timing is slightly different. Profits collapsed after share prices fell in the busts.
Or, put another way, share prices do NOT fall because, or when, company profits collapse. Share prices fall in advance of, and in anticipation, of profit declines. (Timing is everything!)
Profit declines
The aspect I would like to focus on here is the declines in aggregate earnings in each cycle. There have been five significant declines in market-wide profits in the past three decades – about once every half decade on average. (NB The terms ‘earnings’ and ‘profits’ are interchangeable in this context).
-
-
- Aggregate earnings per share fell by -27% in the 2001-2 tech-wreck after the ‘dot-com’ boom,
- fell by -92% in the GFC following the 2003-7 China/credit boom (the main contributors to this collapse are noted on the chart),
- fell by -13% in the mid-2000s commodities collapse following China’s GFC stimulus boom,
- fell by -33% in the Covid lockdown recession,
- fell by -13% with the Fed’s aggressive rate hikes in 2022.
3 . The ‘trailing’ price/earnings ratio for the S&P500 market (red line)
The price/earnings ratio (p/e ratio or PER) is the index price divided by the ‘trailing’ (ie backward-looking) aggregate earning per share over the most recent four quarters. How much am I paying per dollar of actual reported profits?
(Contrary to a common market myth, high p/e ratios don’t always mean the market is ‘expensive’. In fact, most of the high p/e ratios have been when profits collapse, which is usually in the early stages of share price rebounds in the middle of economic recessions or slowdowns. The highest p/er ratio in the past 30 years an extraordinary 148 in 2009 due to the collapse in profits in the GFC.)
The current trailing p/e ratio for the S&P500 market is a rather high 28 times earnings – I am paying $28 for every $1 of reported profits. That is very high, whichever way you look at it.
How high is the current p/e ratio?
For the US market (S&P500) – the median trailing price/earnings ratio since 1950 has been 17.4 times earnings. However, most people use median p/e over a more recent period. For example, since 1980 the median has been 19.8. Rule of thumb: anything over 20 is high.
Using a period like ‘since 1980’ sounds nice, but the post-1980 period was the wonderful era of disinflation, deregulation, laissez-faire, smaller government, tree trade, and globalisation. That golden era is clearly over, and the median p/e ratio of 20 since 1980 is probably not that relevant any more.
We are now into a new era re-inflation (or at least no more disinflation), re-regulation, interventionist, big government, protection, and global, de-coupling, so it makes sense to base our median p/e ratio on a longer period which includes more than just the recent post-1980 golden era of disinflation and declining/low interest rates.
Either way, whatever historic period you use, the current price/earnings ratio is still very high. Ie the market is very expensive relative to the level of underlying corporate profits.
4. Current broker consensus forecasts for EPS (green dots)
Now we get to the big problem with the current market pricing.
Current consensus EPS forecasts (based on analysts’ estimates and company guidance) is indicated by the green dots to the right of the green EPS bars, highlighted in the red oval. This is underpinning the current optimistic sentiment and pricing.
At the start of 2025, the consensus forecast for earnings growth was an astronomical +25% for 2025. That made no sense at all, coming on top of good profit growth of +9% in calendar 2024, and +11% in 2023 (which was a recovery of the profit decline in 2022).
However, over the past month in April/May, broker consensus forecast earnings growth rates have been cut by 5-10% because of fears of tariff impacts on company earnings.
The problem is that these reduced outlooks are still forecasting aggregate earnings growth of +13% over the 12 months. This is no ‘soft landing’ scenario – this is a very bullish forecast for a further acceleration of corporate profits?
Likely Fed cut rates?
Much of this bullishness is due to widespread expectations of several more Fed rate cuts this year. Is this reasonable?
The Fed cut rates three times in late 2024 as inflation fell back from 8.8% down to 3%. But in 2025 the Fed has been sitting on its hands waiting to see the impacts of the tariffs. The Fed may well deliver several rate cuts but if it does, it will be because of an economic slowdown or recession, and that would likely be accompanied by a decline in corporate profits, not double-digit growth!
Profit forecasts are still very bullish
The current consensus forecasts of 15% EPS growth in 2025 and another 15% growth in 2026 is extraordinarily bullish, given that nominal GDP growth is likely to be in the order of say 4% to 5% at best (being real GDP growth of say 2.5% to 3% plus inflation of say 2% to 2.5%). US real GDP growth was a fraction negative in the March quarter 2025 (caused by a surge in imports before the tariffs), but it was so small we can say it was effectively zero.
Nominal growth in the overall US economy of say 4% to 5% pa limits top-line revenue growth for US companies because the US giants already have dominant market shares globally (and China is increasingly shutting out access to US companies already selling into China).
With wages rising, the forecast big jumps in bottom line profit growth is based on big cuts to interest rates - back down near the wonderful days of ZIRP (zero interest rate policy). The only way we will get big cuts to inflation and interest rates is another deep recession.
US earnings per share growth tracks US nominal economic growth
Here’s the problem. Despite US companies growing to dominate the world in a wide range of industries (not just tech), growth in aggregate earnings per share for US companies has more or less tracked the rate of growth in the US economy over time.
Historically, the aggregate earnings per share for S&P500 companies has grown by an average of 6.0% pa since 1980, and 6.1% pa since 1950. These are rather modest growth figures, but that is what the largest 500 US companies have delivered for many decades.
At the same time, growth in the US economy (nominal GDP) has averaged 5.4% pa since 1980, and 6.5% since 1950. This is more or less the same as the growth rate for aggregate US company earnings per share. No big surprise there, so what’s the big deal?
The current forecasts are earnings growth of 15% in 2025, and then another 15% growth in 2026. These are at least three times the likely growth rates for the US economy and the overall global economy.
It is not as if company profits are rebounding from a big profit crash like the GFC or the Covid recession, where high post-crash profit growth is really just getting back on to the pre-existing trend. The green dotted forecast line on the current chart is clearly soaring well ahead of recent and long-term trend growth.
‘Recession scenario’
Also on the right end of the green EPS bars is my ‘recession or slowdown scenario’, which would see aggregate profits collapse by say 20-30% or so as in previous recessions. This sounds scary, but it is along the lines of five previous declines in aggregate earnings per share in the past three decades.
5 . ‘Forward’ price/earnings ratio
The forward price/earnings ratio is the current price index level divided by forecast earnings over the coming (forward) 12 months. The forward p/e ratio for the S&P500 market is currently 24.7. (anything above 20 is a fed flag).
This is overly bullish for two reasons: First, because the accelerating forecast earnings growth rates appear overly bullish, and second, because the multiple investors are paying for those overly bullish earnings is also too high
This is a valuation/pricing indicator – NOT a timing tool
The US share market as a whole appears to be in a ‘double-whammy’ of over pricing – as it is with the CAPE ratio and many other valuation measures - but this tells us nothing about timing.
An over-priced boom can run on for several years into even more over-priced territory until the final trigger for collapse.
For example - the 1990s was a decade-long boom into vastly over-priced levels until it finally collapsed in the 2000-2 tech-wreck and deep US recession. The 1920s was also a decade-long boom into vastly over-priced levels until it finally collapsed in the 1929-32 crash and Great Depression.
The current boom is just three years old (since the -25% fall in January-October 2022). It could run on for several more years into even more over-priced territory before finally collapsing. It could even break the over-pricing records set in 1999 and 1929. Records are made to be broken!
Although expensive pricing does not cause or trigger busts, it does increase the vulnerability and sensitivity to triggers that will one day end the party. The longer and higher the boom, the bigger the eventual bust.
So far, investors have shrugged off China’s DeepSeek ai surprise, Trump’s reciprocal tariffs, the negative quarter of US real GDP growth, and also Moody’s credit downgrade. It is going to take a lot more than these to break US investor confidence!
I did not ‘buy the dip’, nor did I panic sell, so I am positioned for more upside (and have been over-weight gold) – for the time being anyway.
See also:
For pricing on the Shiller/CAPE ratio -

For my report on the 31 dips of -10% or more on the US market – which ones recovered quickly, and which ones turned into major crashes -

For my most recent monthly update on global markets for Aussie investors:

‘Till next time – safe investing!