Key points:
-
-
- Big moves in share and bond markets with Trump's 'reciprocal' tariffs, then their sudden deferral a week later. More rebounds, or more falls ahead?
- Big moves also in currency markets – Trump talking down the dollar is working.
- Will Trump's tariffs bring inflation or recession, or both?
- Why tariff-induced price rises are not necessarily 'inflation'.
- US GDP contraction + updates on commodities, gold, bitcoin, inflation, interest rates, credit.
Greetings fellow investors! - Here’s my monthly snapshot on global markets for Aussie investors.
A lot happened in April – so apologies in advance for a longer than usual report.
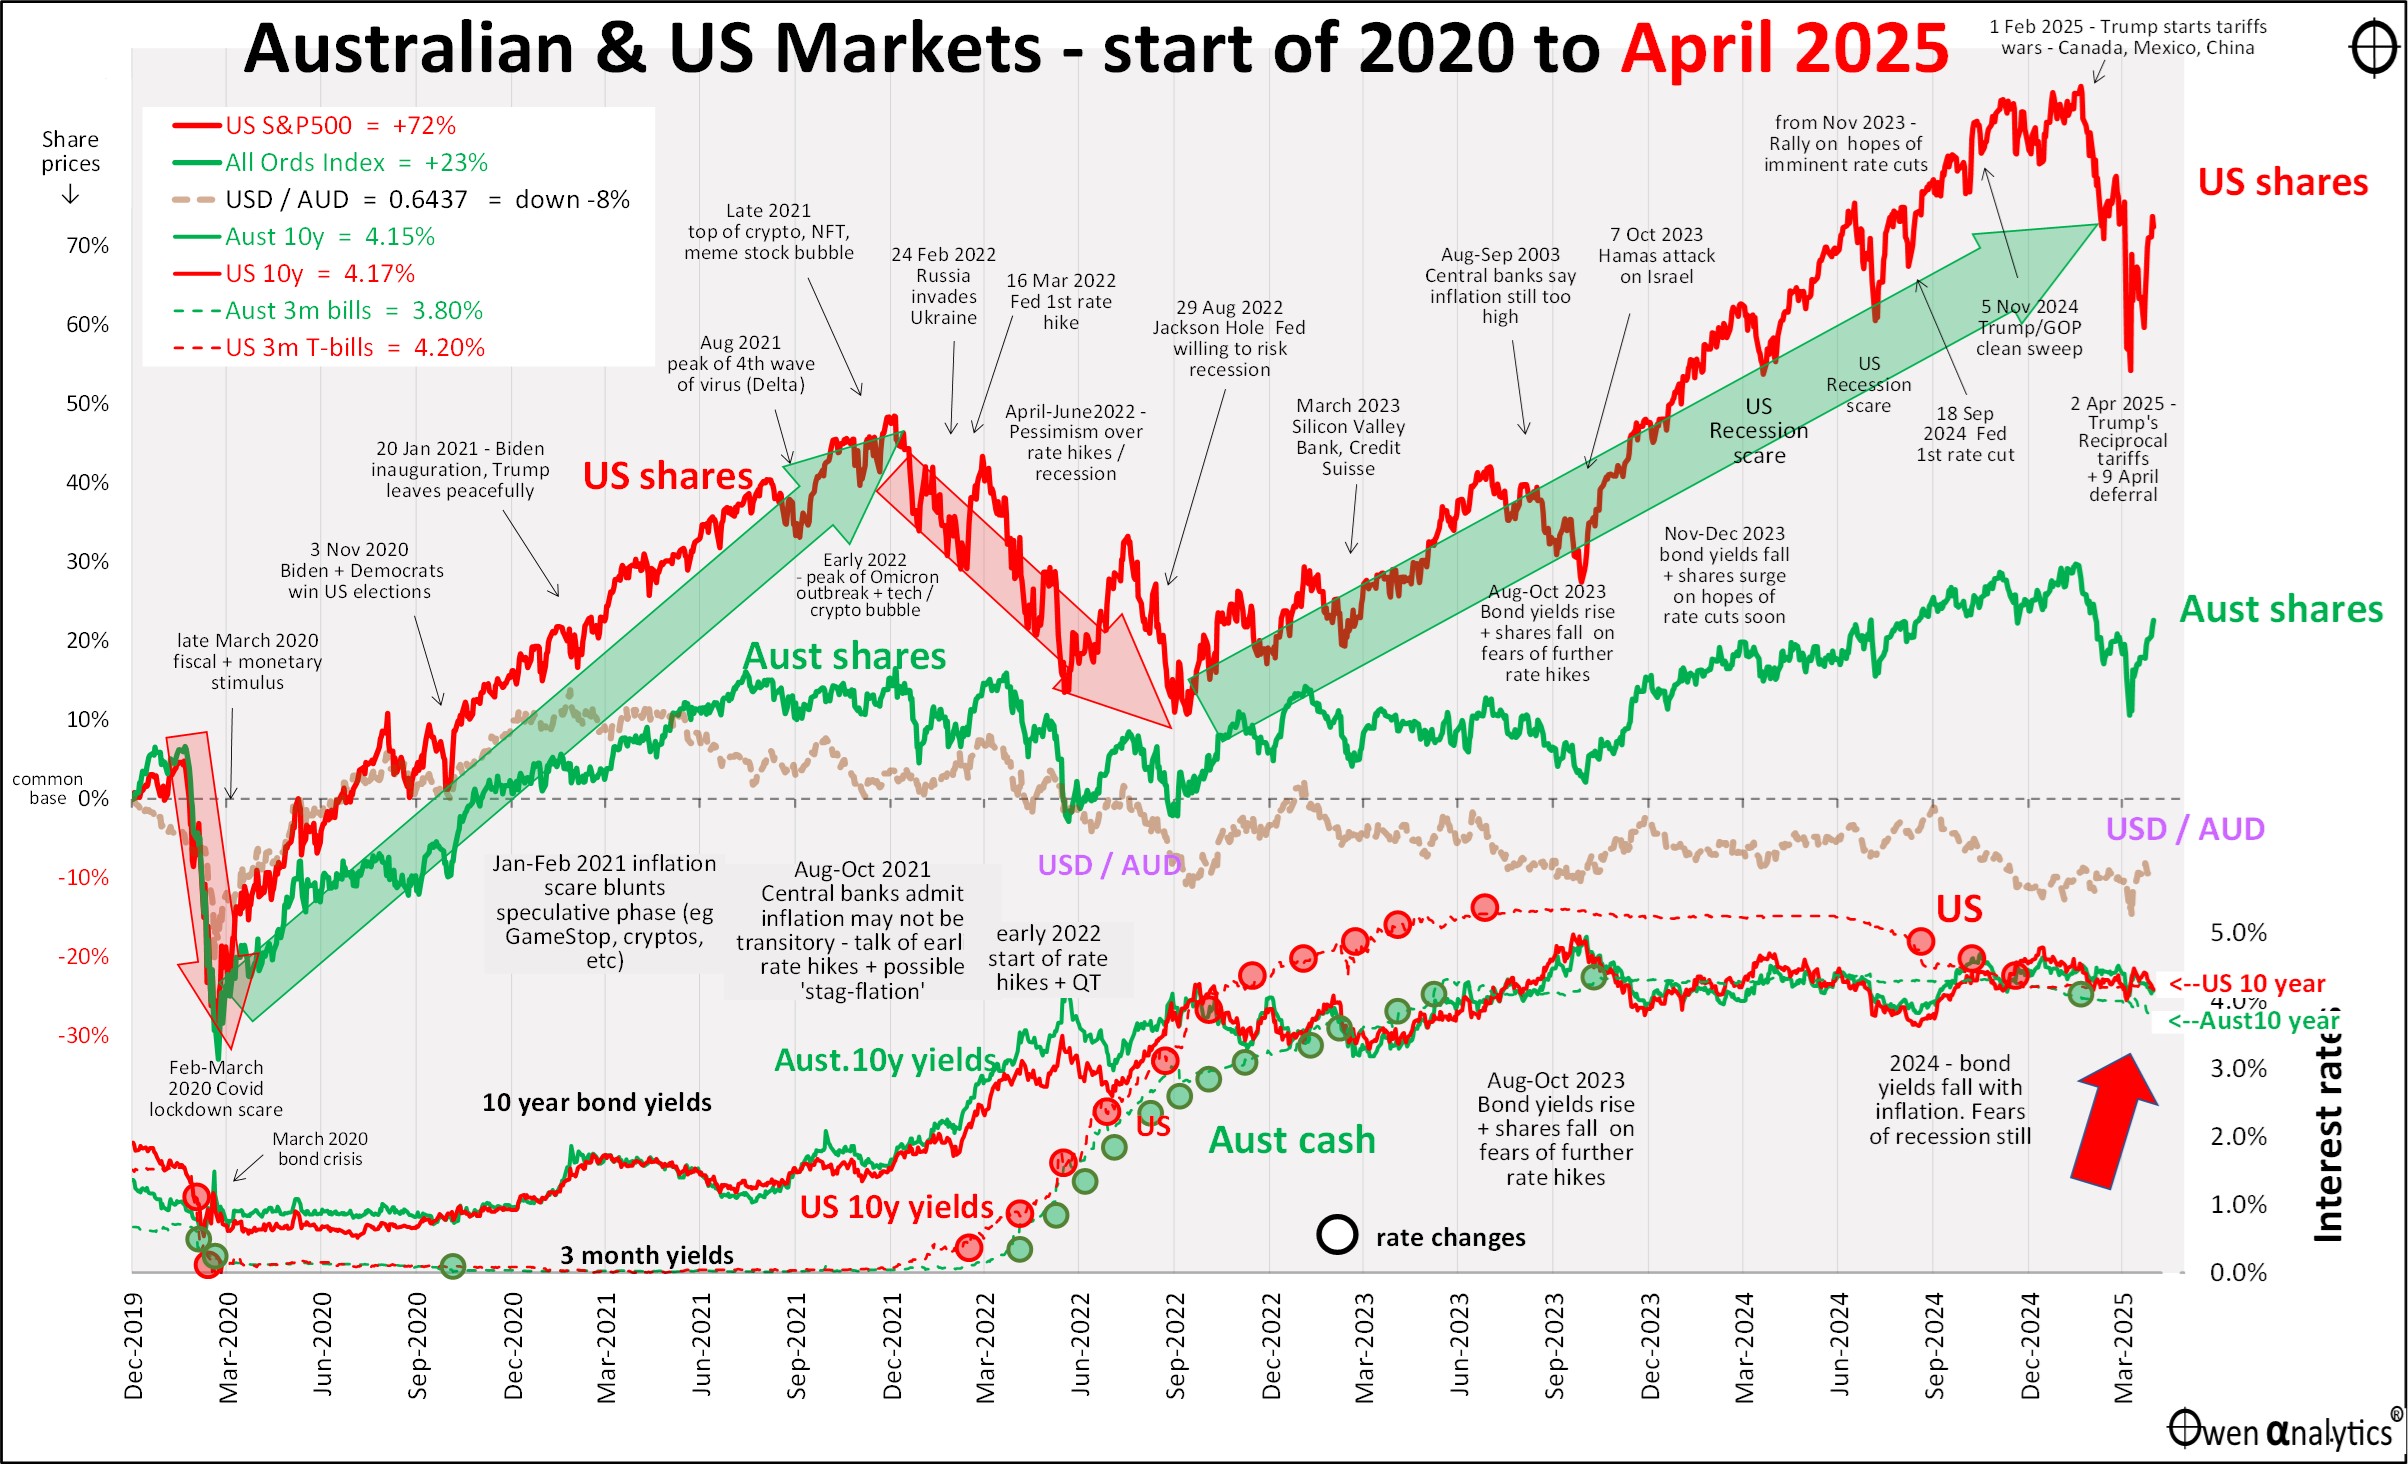
First - my essential 1-page snapshot chart - covering Australian and US share markets, short and long-term interest rates, inflation, and the AUD/USD exchange rate. As usual, there are two versions – first is the traditional version on a single chart:
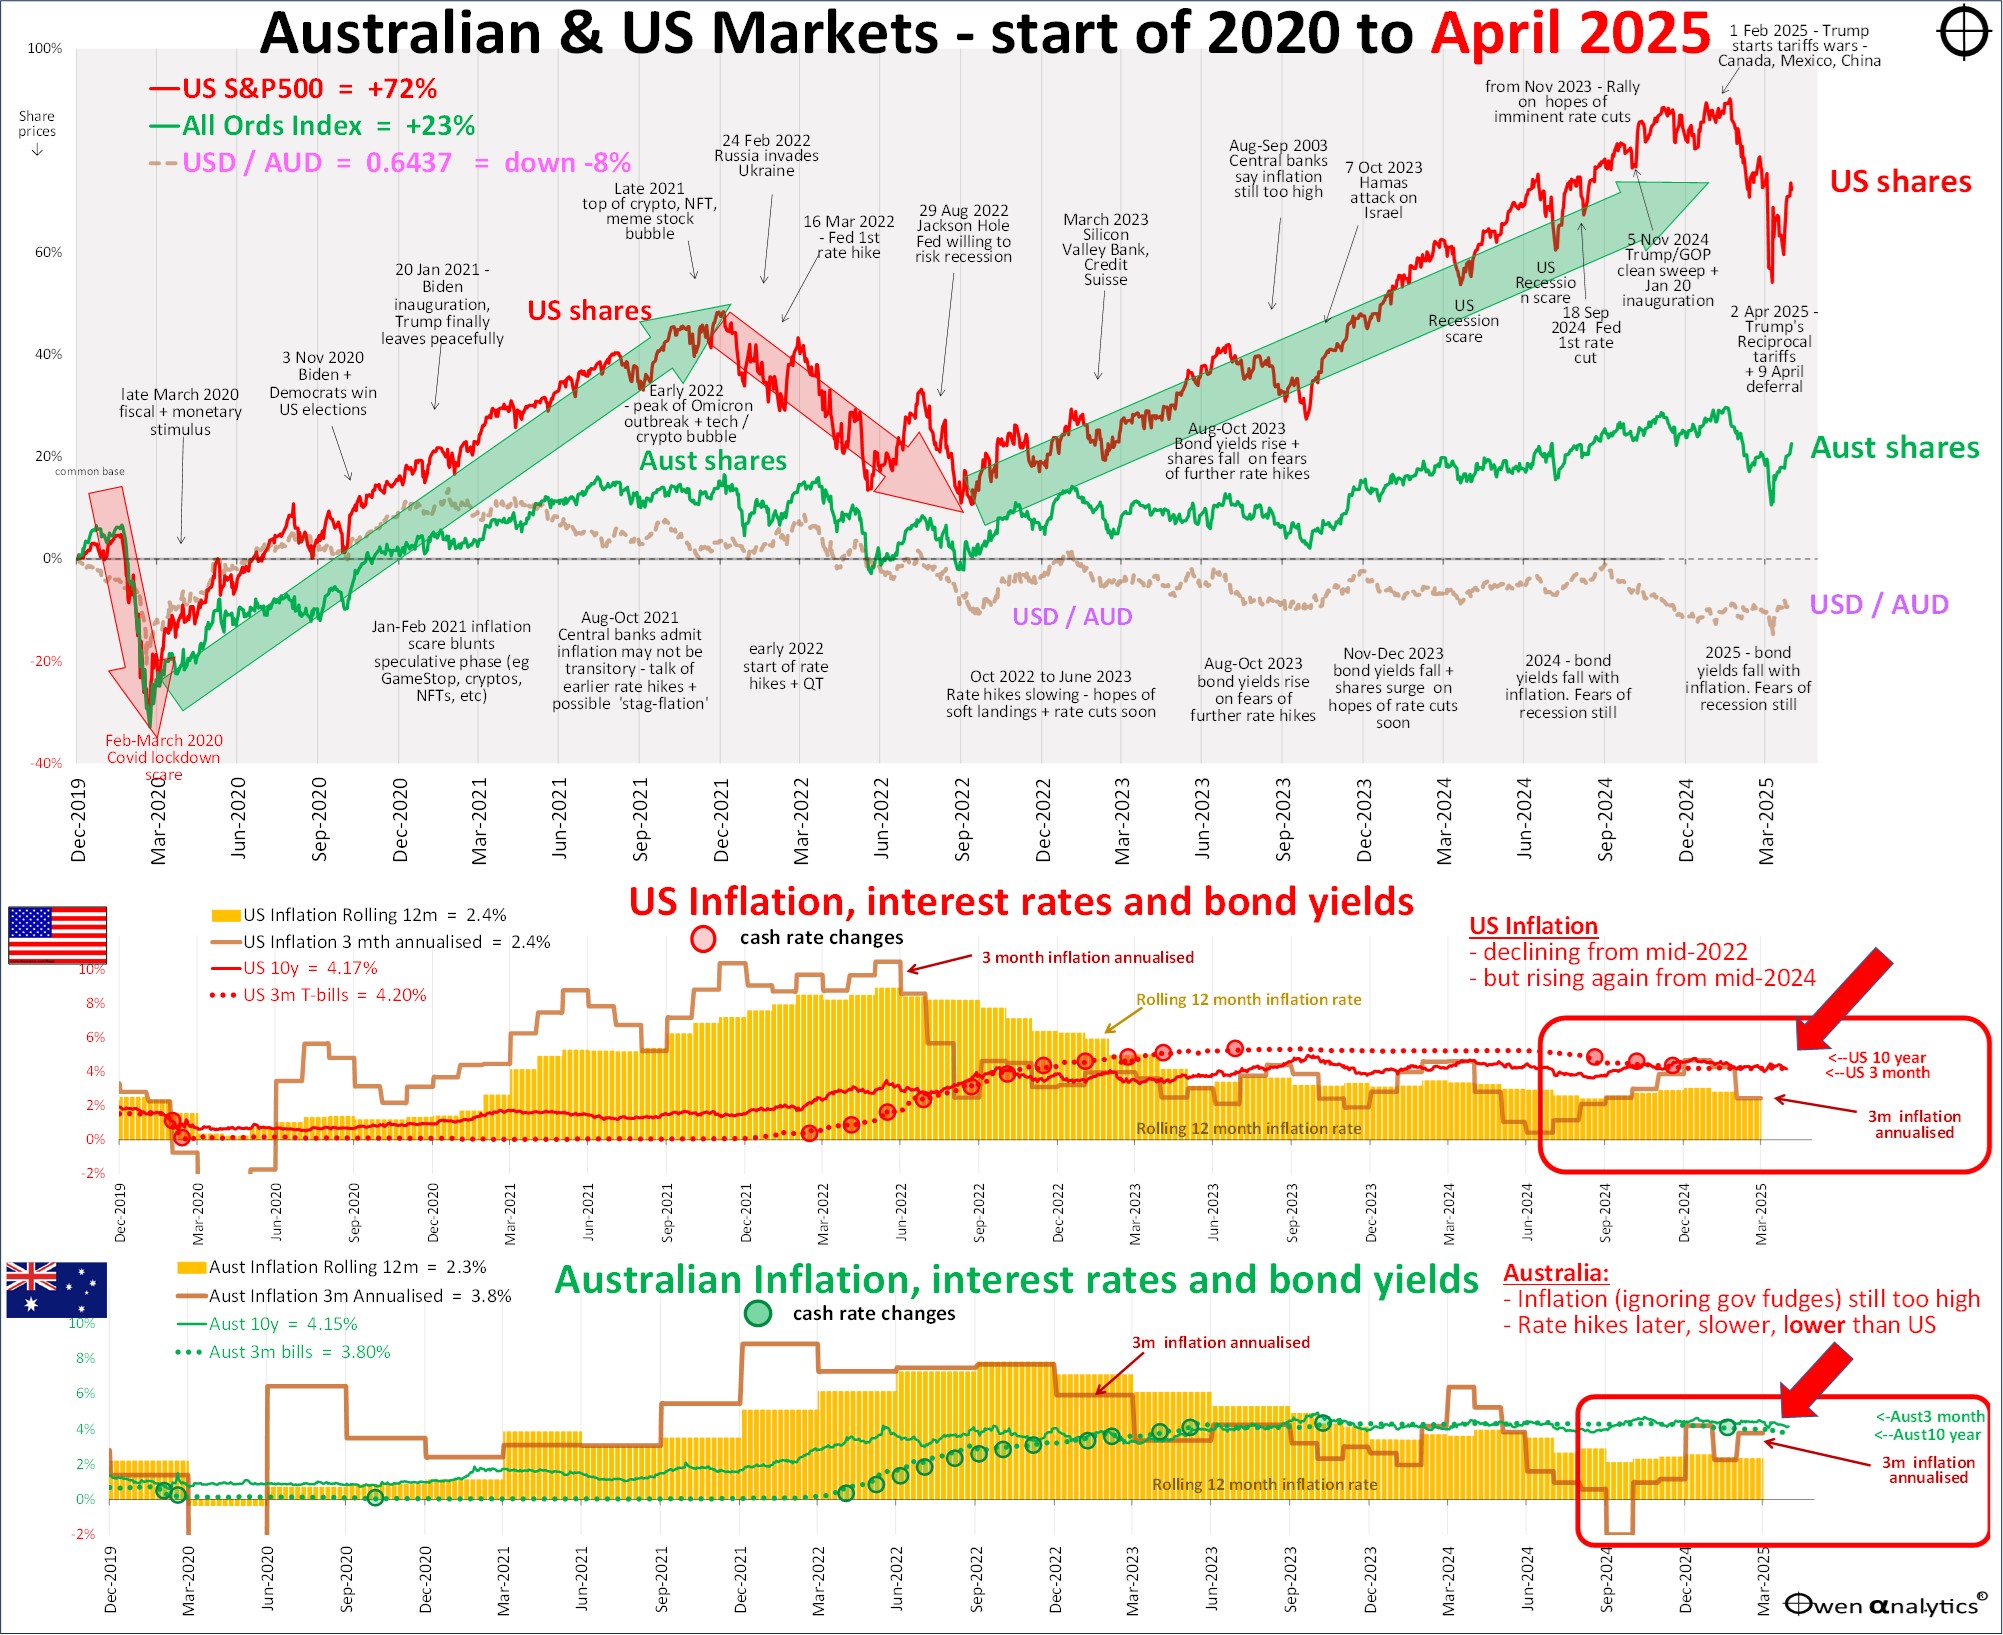
Plus the alternate version below, requested several advisers - showing Australian and US inflation separately in the lower sections (I deal with inflation in greater detail below):
Tariffs then deferrals
The main event in share markets was the mini-sell-off that started in mid-Feb, accelerated with Trump’s ‘reciprocal tariffs’ announced on 2 April, then partially recovered after the tariffs were deferred on 9 April.
Trump supporters say the deferral was part of a pre-determined plan to ‘escalate then de-escalate’ as a standard Trump negotiating tactic. The rest of the world say he was slapped down by the bond market (like Clinton in 1993-4 and Liz Truss in 2022).
Which was it? It doesn’t really matter. Neither Trump nor markets are predictable. What is likely is that there will be more policy announcements and counter-announcements as he battles to get is agenda implemented, across a wide range of issues.
Share markets – minor hiccup? or start of the BIG one?
It was certainly a wild ride but, to put it in context, the above charts of US and Australian markets show that both markets have seen two deeper dips in the past few years:
US (S&P500):
-
-
- Fell -33.9% in the Feb-March 2020 Covid lockdown crisis – recovered quickly with the stimulus.
- Fell -25.4% in the 2022 inflation/rate hike sell-off – recovered quickly as inflation and rate hikes slowed.
- Fell –18.9% (from 19 Feb to 8 April) – strong partial rebound with tariff deferral.
Australia (All Ords):
-
-
- Fell -37.1% in the Feb-March 2020 Covid lockdown crisis – recovered quickly with the stimulus.
- Fell -16.6% in the 2022 inflation/rate hike sell-off – recovered quickly as inflation and rate hikes slowed.
- Fell –14.7% in 2025 (from 17 Feb to 7 April) – strong partial rebound with tariff deferral.
The 2020 and 2022 sell-offs were each deeper than the 2025 mini-sell-off (so far). That does not mean that the current sell-off is over, of course. But it does show how common these kinds of sell-offs are.
Will share markets rebound, or are there more falls to come?
It’s impossible to forecast of course. Some minor sell-offs turn into deeper and longer busts, others recover quickly. For my recent study of the dozens of times the US and Australian share markets have dropped by -10% or more in the past – see:


Valuations matter
My conclusions from these studies is that valuations matter. Out of the dozens of -10% corrections in the US and Australian share markets, one of the key determinants of whether they turned into much deeper and longer sell-offs, was the level of the valuation of the market at the time.
Where are we now on valuations? For my update a few days ago on the US market – see:

My conclusions are:
- The US market is still significantly over-priced relative to fundamentals (underlying earnings),
- Over-priced markets are almost always followed by below-average returns over subsequent 7-10 year periods,
- But pricing measures like these are NOT timing tools. The big correction will come, but not necessarily yet. Over-priced markets can keep running upward for a decade before the big one finally hits – like in the 1920s and 1990s.
Big falls are a part of life
If you invest in shares, even ‘diversified’ across hundreds of companies in a broad spread of industry sectors and countries, you soon realise that big sell-offs are a part of life.
For example, the US share market has fallen by more than -30% on thirteen occasions since 1900 (taking Australia and the rest of the world with it almost every time). That’s about once per decade on average. Some decades have none, some have more than one.
Big falls are common. We will all see several in our lifetimes.
Rather than worry about trying to pick the high points to get out, and the low points to get back in, or ‘waiting on the sidelines until things settle down’, long-term investors focus instead on:
- understanding and diversifying risks, rather than chasing high returns,
- learning to resist the temptation to follow the crowd (and the frenzied media hype) into gearing up or chasing fads in the booms,
- and learning to resist the temptation to follow the crowd (and the frenzied media panic) into panic selling in the busts.
Booms and busts aren’t what make us rich or poor. What determines the future wealth and living standards of ourselves and our families is the decisions and actions we take (or avoid) as investors through those booms and busts.
Share markets in April
Industry Sectors
All global industry sectors were more or less flat in April, except for fossil fuel burners (‘Energy’) down -10% with big falls in oil, gas, and coal markets. Oil prices plunged below $60/barrel on fears of global slowdown and over-production.
Major stocks
Here is the picture for the major global stocks (all of which are US based):
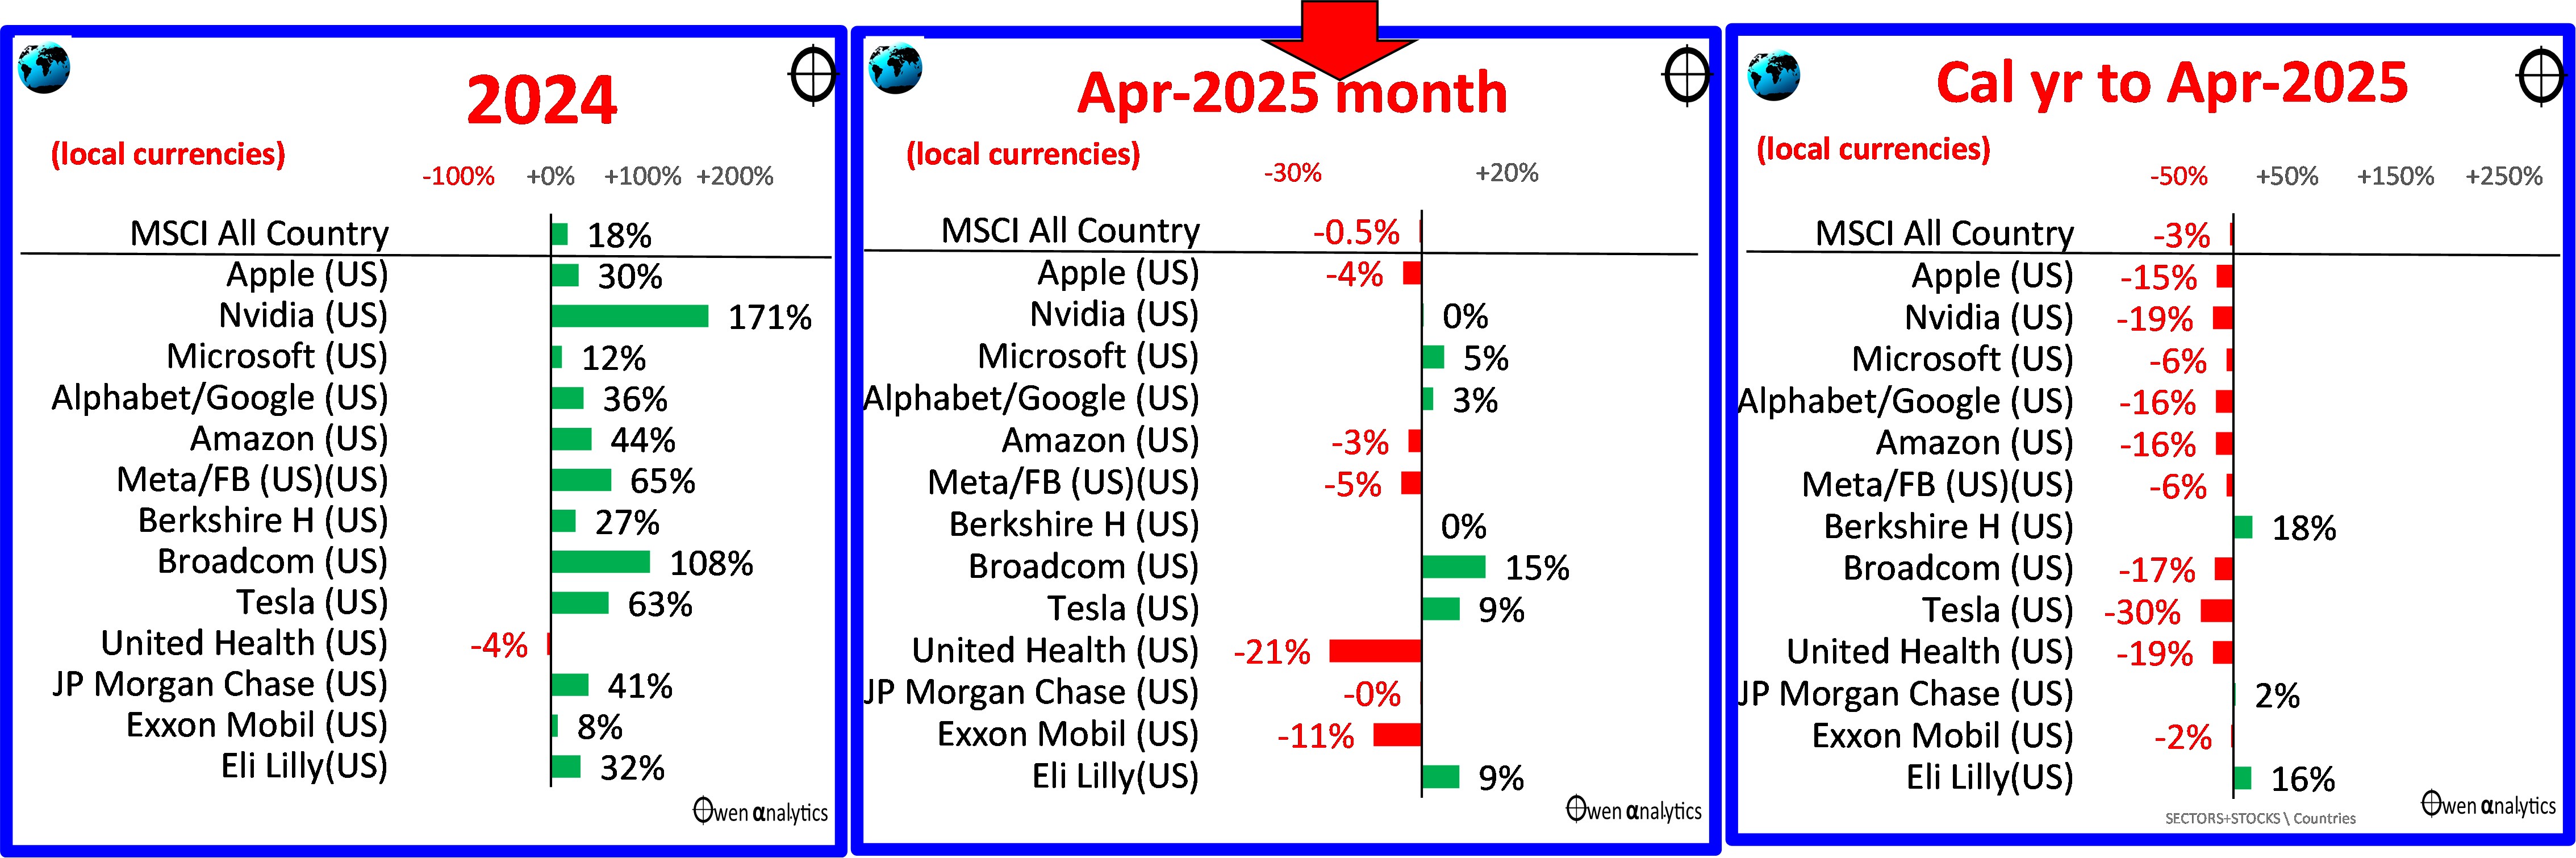
The overall market was flat in April (middle chart), but year to date (right) all of the major tech giants are down – especially Tesla.
For context, here are the share prices of the so-called ‘Magnificent Seven’ stocks over the past decade -

There is no Y-axis scale trickery going on here – the vertical y-axes all start at zero and have regular, nominal scales, highlighting their explosive growth from very low levels in the past decade. All of their share prices are down so far this year, but all are still up hundreds of percent over the past few years.
They are also still very expensive on a range of metrics. See my recent report on how they stack up individually on revenues, profits, dividends, and pricing -

Major country share markets
The overall global share market ended down a fraction in April. The main markets were more or less flat in April (middle), except Australia (below). The countries that were down reflected perceived reductions in exports to the US – notably China, Canada and most of Europe.
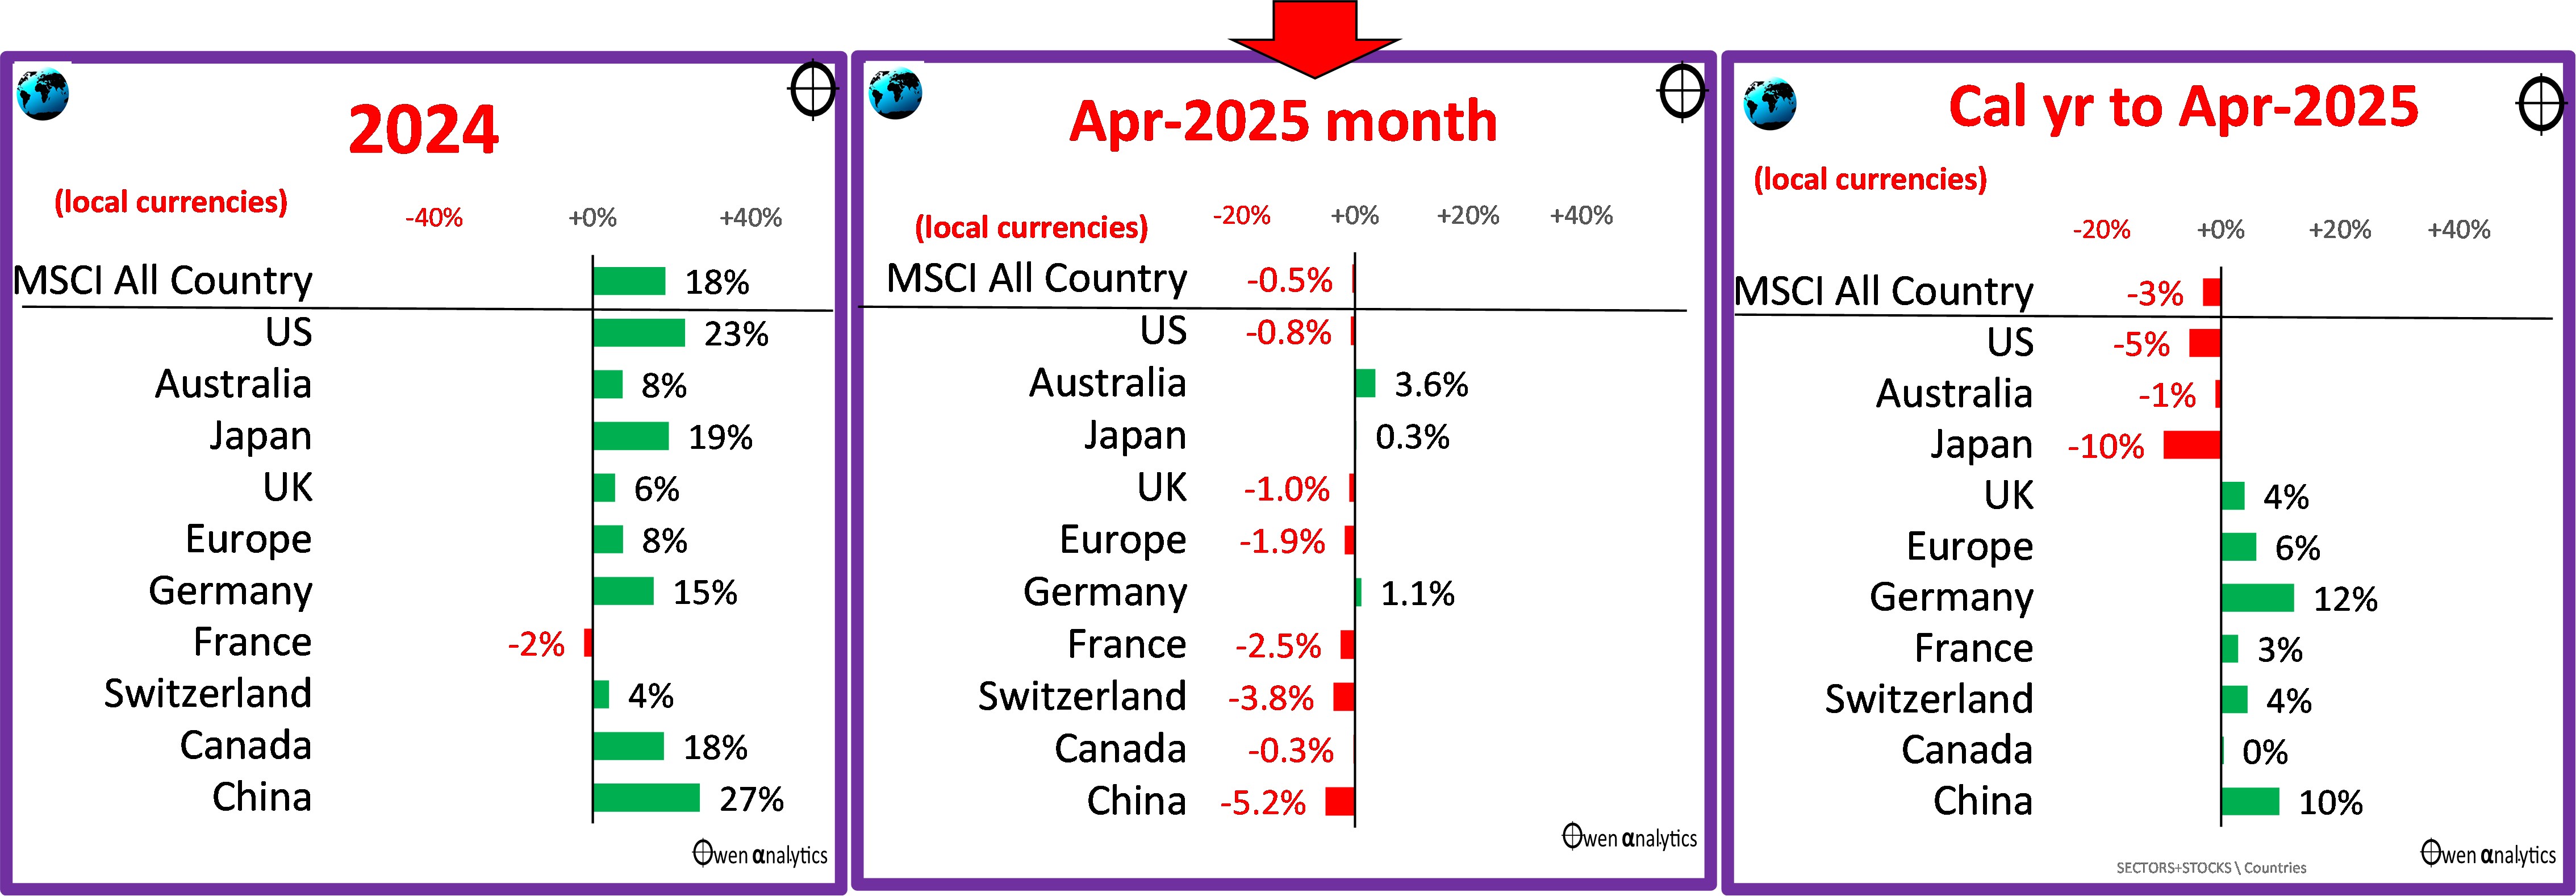
Year to date (right chart), the US market is down – mainly over-due falls in the over-priced tech giants. The only other major market down this year is Japan, but it is mainly due to falls in Softbank (stacked with over-priced tech holdings) plus also the rising yen (see currency section below) hurting exports.
Germany is the star so far this year – mainly due to gains in industrial giants like Bayer and BASF, and also Allianz (insurance).
China is also up - led by Alibaba and Tencent. There are two main reasons for the recent min-revival in Chinese stocks – the first is Xi Jinping welcoming previously exiled tech oligarchs back into the fold. Xi has suddenly realised he needs them for China to dominate world markets in new high-tech industries like ai, surveillance tech, EVs, solar panels, wind turbines, etc. (Trump loves his billionaire buddies – Xi philosophically detests and despises China’s billionaires, but he tolerates them as a necessary evil).
The second factor is the recently announced plans to re-capitalise six of China’s state-controlled banks, to allow them to boost lending in an effort to stimulate China’s stalled economy, plus additional measures to support the economy with US tariffs likely to hit export industries.
Australian shares
The local share market was the star in April (middle chart below). Here are the main stocks:
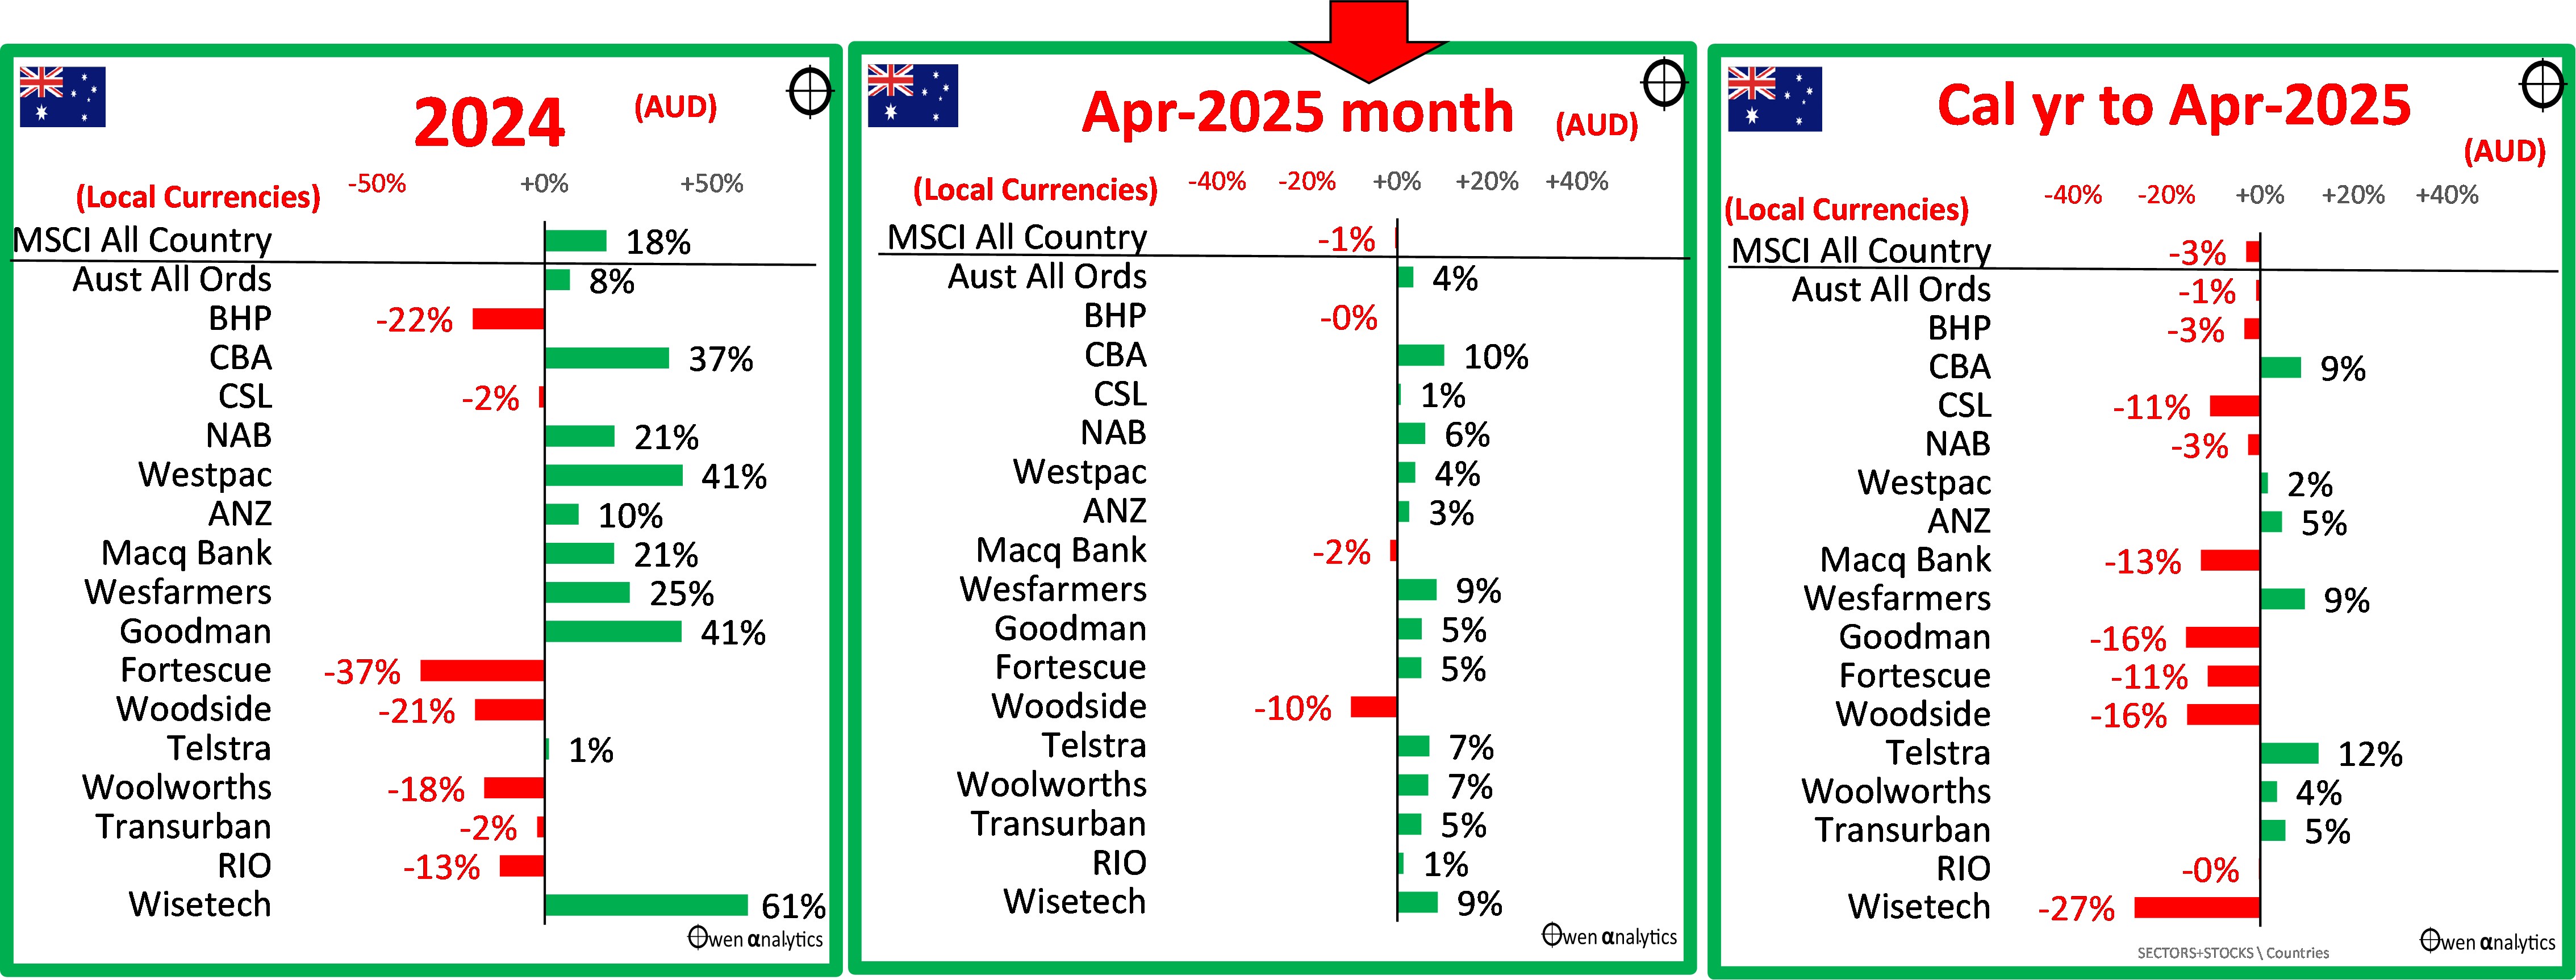
Woodside is down -10% (with oil/gas prices down), but the big banks and other domestically oriented giants were up, perhaps reflecting Australia’s relatively safe position having a trade surplus with USA, and possibly shielded from global recessions.
Year to date (right), the market is being dragged down by Wisetech (founder dramas still), Mac Bank (slower deal flow in the US), CSL (Vifor and tariff problems), and the iron ore miners (lower iron ore prices with slowing China).
Domestic ‘safe havens’ are the order of the day – CBA, Wesfarmers, Telstra, Woollies, Transurban.
Inflation & interest rates
First, to the US market - After three rate cuts in September, November and December 2024, the Fed hit the pause button and said they are in no hurry to cut rates further. The problem is that US inflation is on the rise again – the 12-month rate at 2.4%, and annualised 3-month running rate also at 2.4%. The Fed’s preferred measure, Personal Consumption Expenditure (PCE) is still above target and has been drifting up over the past year.
On top of that, the jobs market remains relatively strong. The unemployment rate rose from 4.1% to 4.2% but is still relatively low. Here is the US picture:
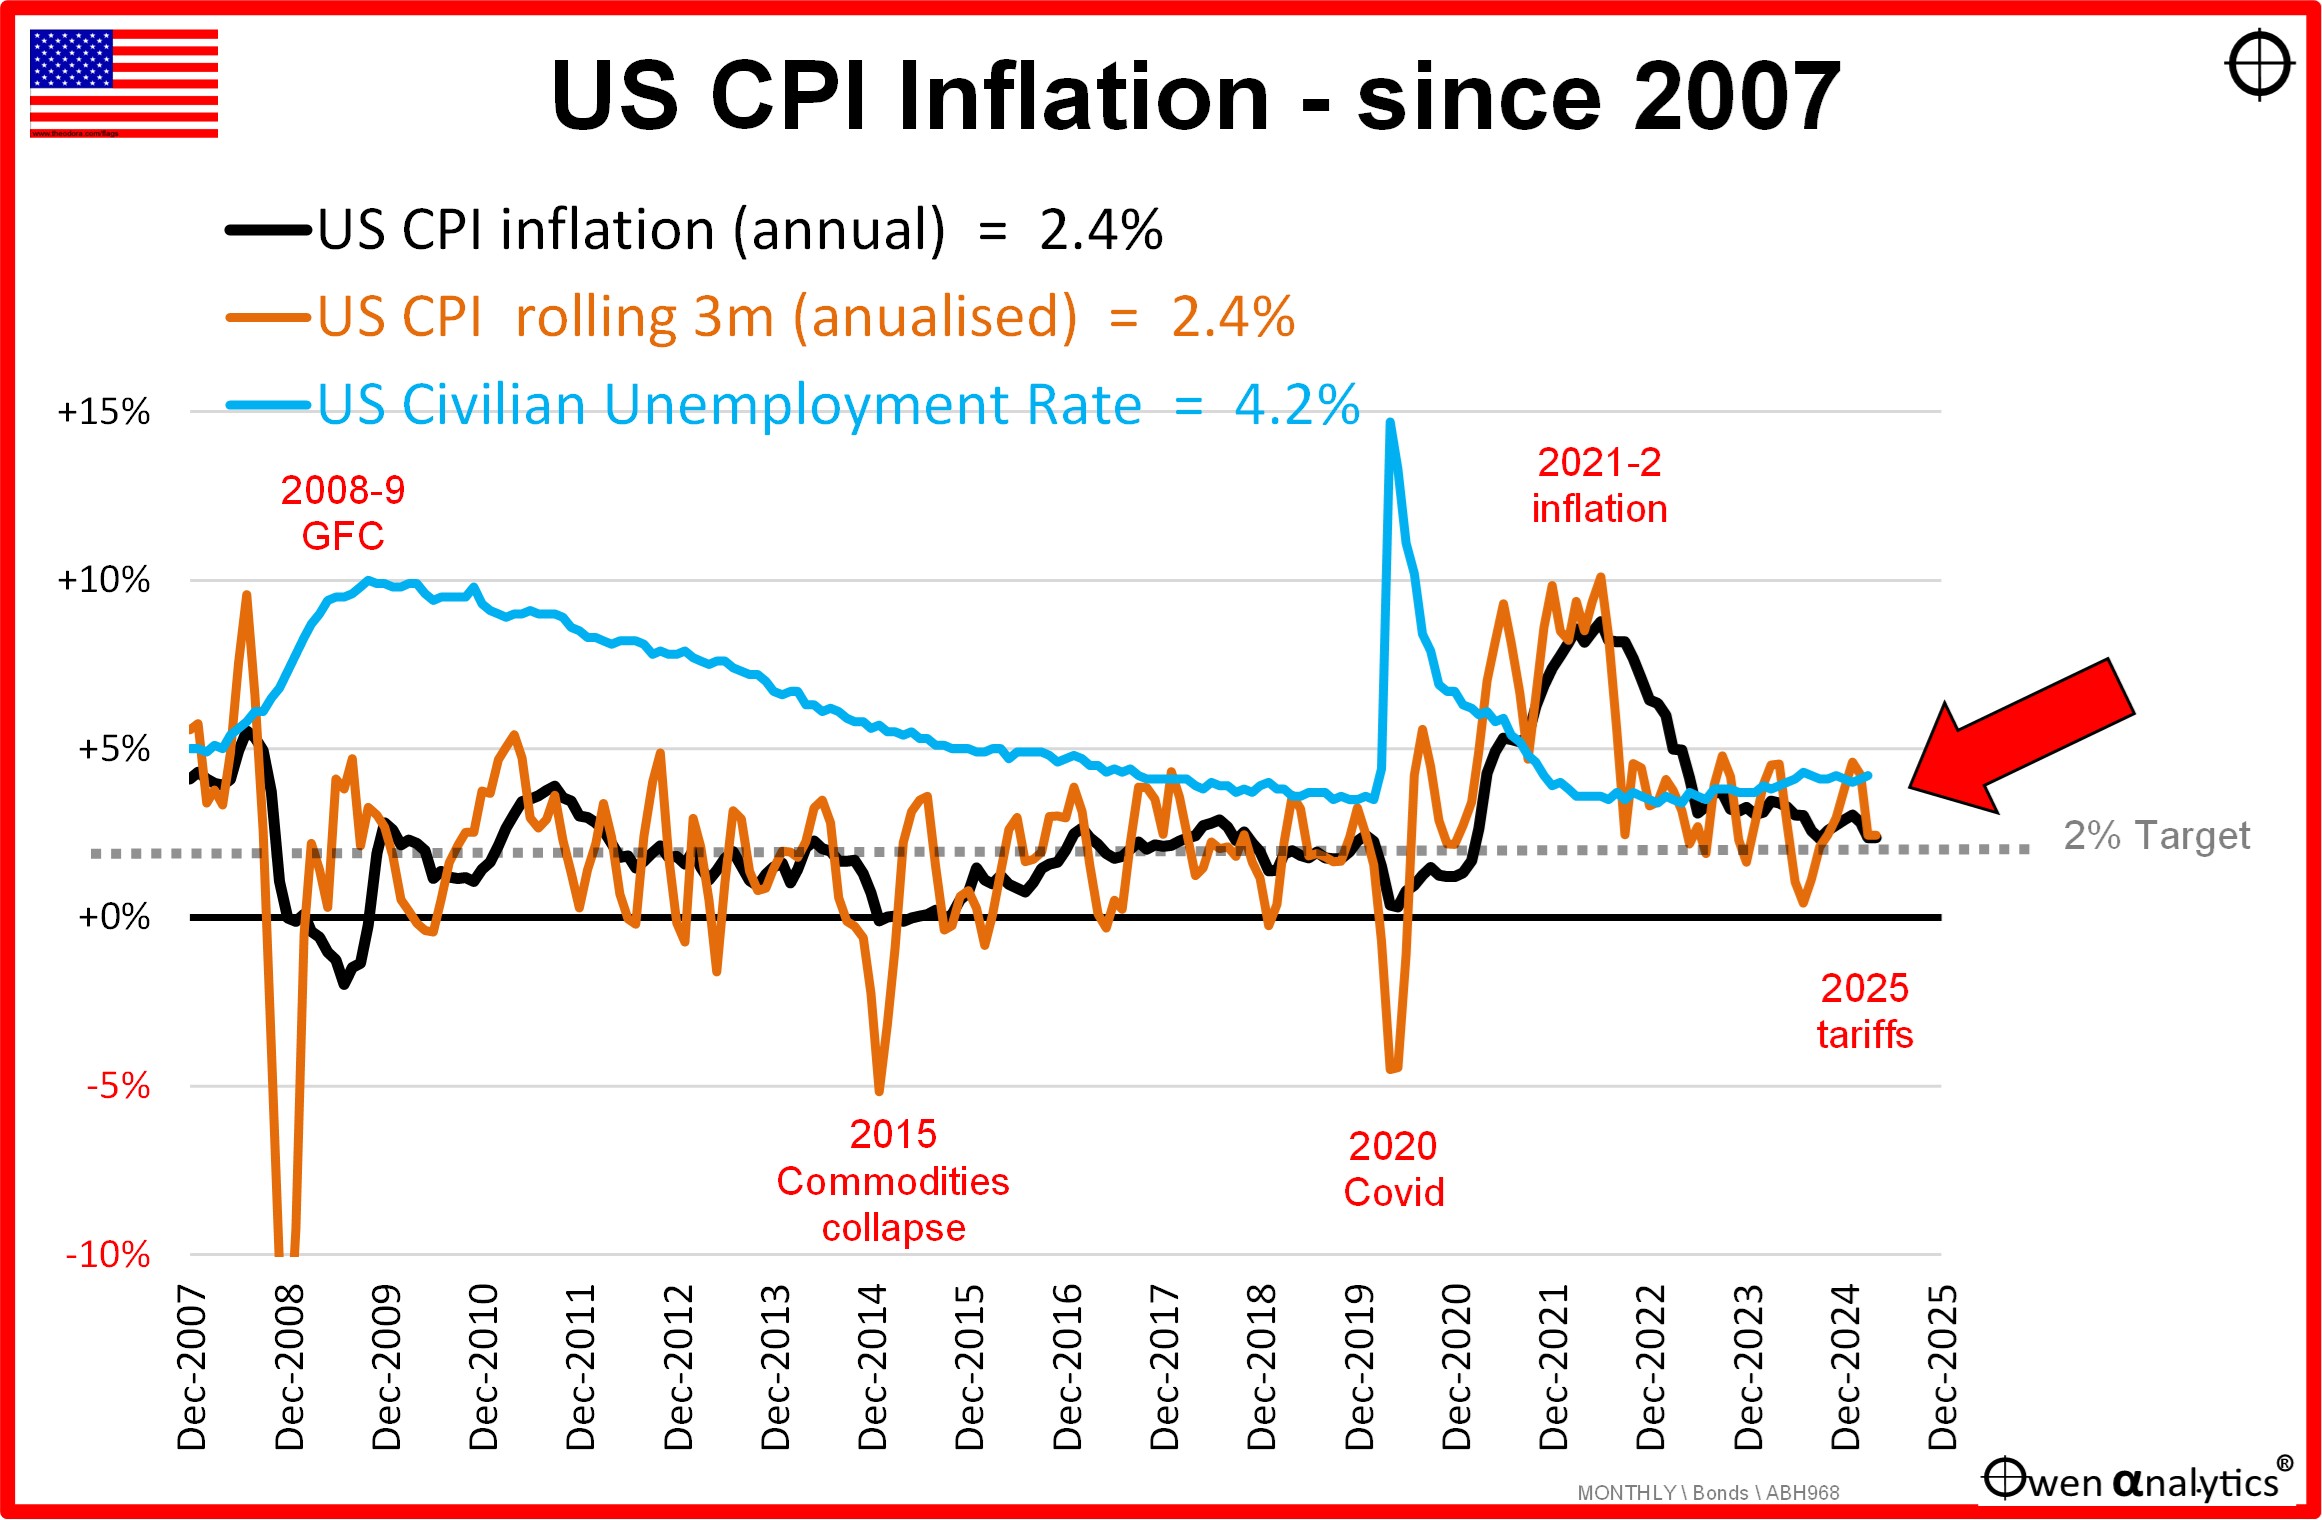
Fed chair Jay Powell first suggested that tariff-induced inflation in the US may be ‘transitory’, but he has since expressed concerns it may not be that simple after all.
(One would have thought after his unfortunate ‘transitory’ comments in 2021, that he would have banished the word to the dustbin of history, and also banished it from his personal vocabulary. In 2021 he was caught napping when he dismissed rising US inflation as ‘transitory’. It wasn’t, but he let it shoot up to 8.8% before belatedly admitting his error and switching to attack mode with rate hikes in 2022.)
The world waits with bated breath to see just how ‘transitory’ the Trump tariff inflation turns out to be.
The worst case scenario would be that tariffs slow spending, output, and employment, but the Fed is unwilling to cut rates (which is the usual stimulatory tool in recessions and slowdowns) because inflation remains high - the nightmare ‘1970s stagflation’ scenario.
Tariffs -v- inflation
It is important to understand that a one-off increase in prices due to tariffs (or other taxes) is NOT inflationary.
For example - the one-off rise in Australian consumer prices across the board due to the introduction of the 10% GST in 2001 was NOT ‘inflation’. A rise in CPI does NOT equal ‘inflation’.
Price rises due to taxes like tariffs only become ‘inflationary’ if they lead to a sustained ratcheting up of prices via retaliatory tariff hikes or wages. Central banks are not worried by one-off price rises. They are worried if the price rises turn into an upward spiralling of prices.
The problem is that price rise spirals can quickly get out of control and change consumers’ expectations and spending patterns.
US Economy contracts in the March quarter
Latest news over night that the US economy contracted in the March quarter – by just -0.07%. Real GDP contracted by $16b in the quarter, which is insignificant compared to an increase in annual real GDP of $2.5 trillion over the previous calendar year (2024 growth over 2023).
The March quarter 2025 GDP contraction was tiny, but it will be picked up by the media as the sign of a coming recession. The contraction was not caused by lower spending, it was a surge of imports as US importers scrambled to get stuff into the US before the tariffs hit.
Australia
Australian inflation also remains problematic, but for different reasons. The RBA has only made one cut in this cycle, while most other countries have made several.
The RBA made its first reluctant and belated rate cut on 18 February this year – down by 0.25% to 4.1%. The RBA rate hikes were later, slower, and lower than the rest of the world in attacking inflation, plus we have a more centralised wages system here and a pro-wage inflation government with expansionary deficit spending, so inflation has remained stickier here than elsewhere.
There is no doubt the RBA has lost some of its ‘independence’ under smiling Jim Charmer’s ‘reforms’, and there also is a lively debate about the extent of political pressure on the RBA chief to change her wording after the June 2024 RBA meeting on the revised causes of the sticky inflation problem. Her awkward back-tracking on the statement, and the reasons accompanying the eventual February rate cut were far from compelling.
Here is the Australian picture:

The 12-month CPI inflation is running at 2.4%, the annualised 3-month rate is back up to 3.7% pa, and the RBA’s preferred ‘trimmed mean’ measure is back up to 2.9%. However, these numbers are still being artificially depressed by temporary government power and rent subsidies, as has been made clear by the RBA.
As in the case of the US, the most obvious reason for rate cuts would be a local recession, which would lift unemployment and probably soften inflation pressures, allowing (or necessitating) rate cuts.
Unemployment remains a very tight 4.1%, with record ‘participation rates’ (the number of people in the workforce as a percentage of working age population), but that is almost entirely due to expansionary government hiring.
Meanwhile, in the real world, business insolvencies have shot up to levels not seen since the deep 1990-1 recession. Job numbers are booming in the government sector, but business is doing it tough. See my recent report on insolvency numbers in Australia –

In summary - the government is artificially suppressing both the inflation numbers (with subsidies and hand-outs), and also the unemployment numbers (with deficit-funded jobs in the ever-expanding government sector).
A reader asked me recently whether the ABS should report ‘private sector’ GDP and ‘public sector’ GDP numbers separately so we can see the government economy versus the real economy. My answer was that the government probably already thinks that the government IS the economy. It is getting to look that way. In the upcoming election, both sides are promising even more unfunded deficit spending plans decades into the future, with no credible plan of ever trying to ‘balance the budget’ – ever. Leave that for the next generation of taxpayers to worry about!
Check out my recent story on the history of Federal government deficits and debts in Australia –

Bond yields
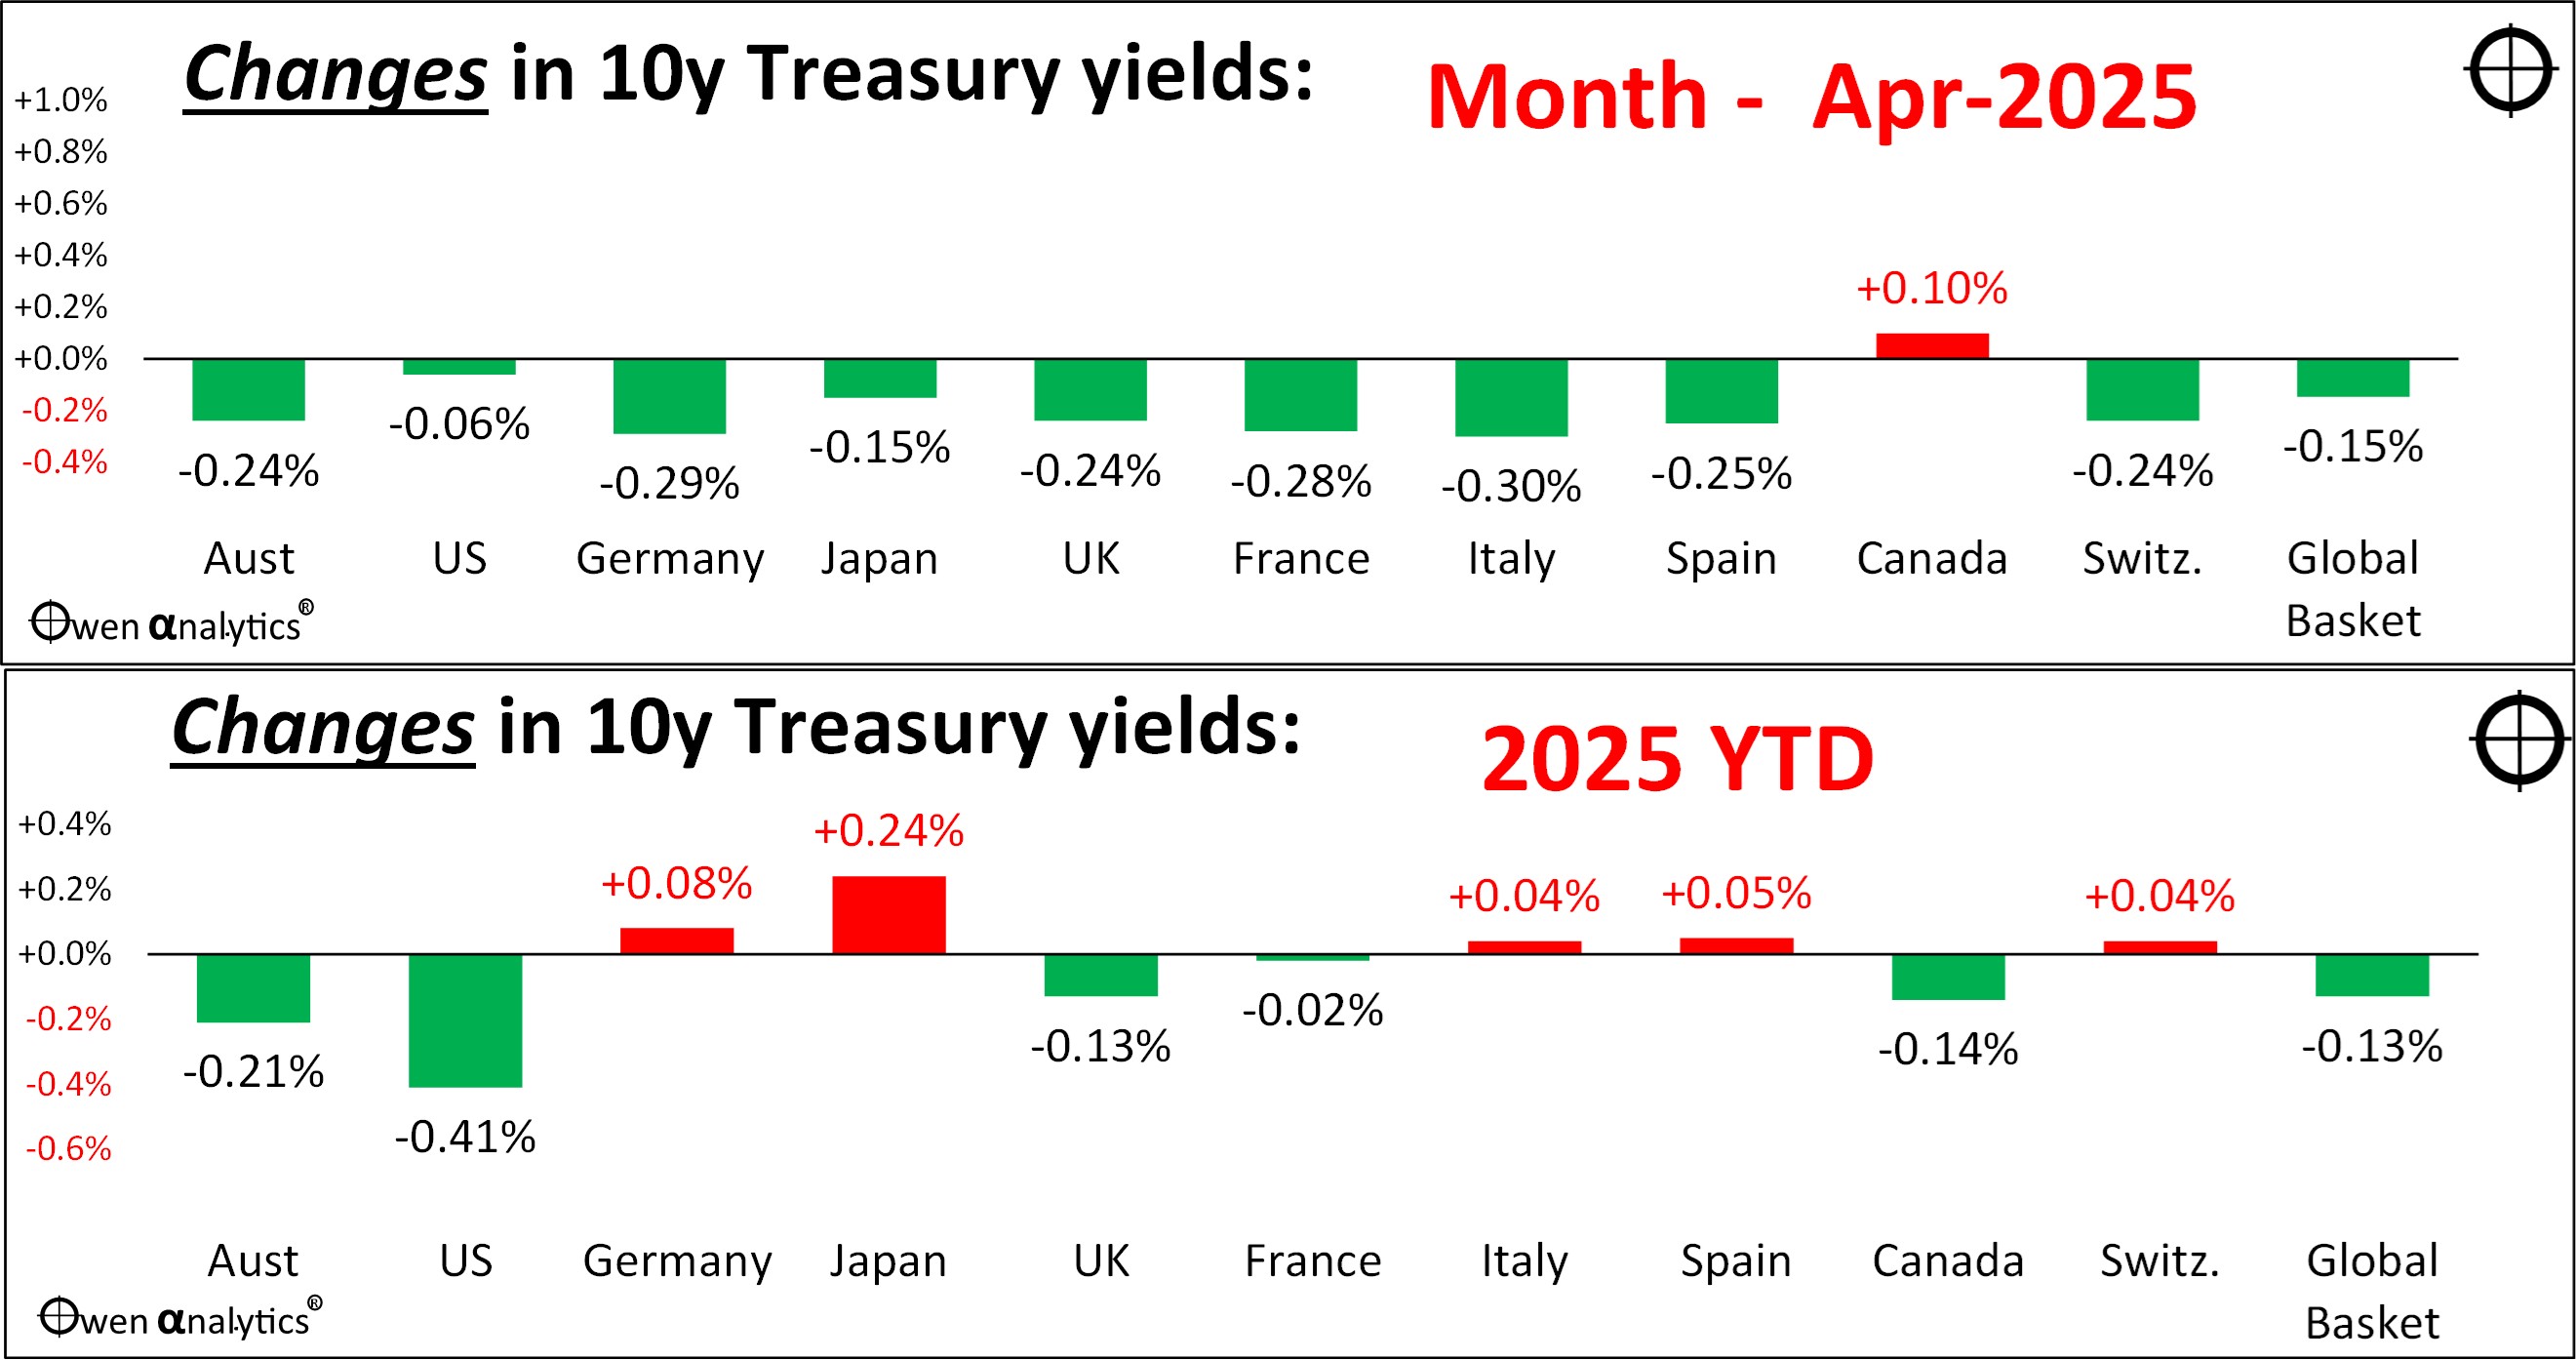
April was an action-packed month for bond markets (we don’t get many of those!). From start to finish, yields on government bonds ended up falling about 20-30 basis points in most markets (down by just 6bp in the US, and up a fraction in Canada).
Most of the yield declines were in the last day of April on news of the March quarter economic contraction in the US.
However, the big story was that yields shot up about 50 basis points (half a percent) after Trump announced his ‘reciprocal tariffs’ on 2 April. Bond investors dumped US bonds out of fear of rising inflation, and share markets also dropped sharply as investors dumped everything (the ‘sell America’ trade.).
After a week of panic on share and bond markets, Trump backed down on 9 April and announced a 90 day deferral on the tariffs. Falling share prices are one thing, but rising bond yields are more serious for the US government. Rising bond yields would have increased the cost of refinancing $9 trillion in US debt that falls due this year (out of $36 trillion total debt).
(As I pointed out at the start, Trump supporters say the tariff deferral was all part of a pre-determined master plan to ‘escalate then de-escalate’ as a standard Trump negotiating tactic. The rest of the world say he was slapped down by the bond market, like Clinton was in 1993-4 and Liz Truss in 2022).
Here are the changes in yields on 10-year government bonds in the major markets in April (upper chart), and 2025 year-to-date (lower chart). Yield rises are in red (as they cause capital losses), and yield declines are green (capital gains on bonds).
Credit spreads
It was the same in credit markets (corporate bonds, which trade at a yield ‘spread’ above government bonds to reflect the creditworthiness of the borrower/issuer of the bond).
Credit spreads were running at very tight levels (‘tight’ means narrow spreads which reflect low risk of recession or bad debt cycle). On the reciprocal tariff announcement, spreads shot up – reflecting a sudden pricing in of risk of a tariff-induced recession.
Then, after the tariff deferral announcement, spreads receded, but only partially. Credit markets are now on recession watch after the US GDP contraction number came out yesterday.
I doubt whether credit spreads will be returning to their super-tight boom-time levels any time soon. This means the best days for credit are probably now over in the current cycle.
Currency action – something big is afoot
In last month’s ‘Snapshot’ report I had a section called ‘Currency actions – something big is afoot.’ I outlined the argument that the strong US dollar real is a problem for Trump, who needs a lower dollar to help US exporters and reduce the trade deficit.
A rising dollar neutralises the impact of the tariffs. For example, a 10% US tariff on imports makes imports more expensive and domestic producers more competitive. But if the US dollar rises by 10%, it brings down the cost of imports by 10%, and neutralises the effect of the tariff.
Contrary to popular media narratives, the US dollar is not ‘in trouble’ or ‘on its last legs’. In fact it is the reverse. The US dollar has been rising pretty much in a straight line since credit rating agency S&P stripped the US of its AAA credit rating in August 2011.
From the start of 2012 to the end of 2024, the dollar gained 40% against its major trading partners, mainly against the yen:
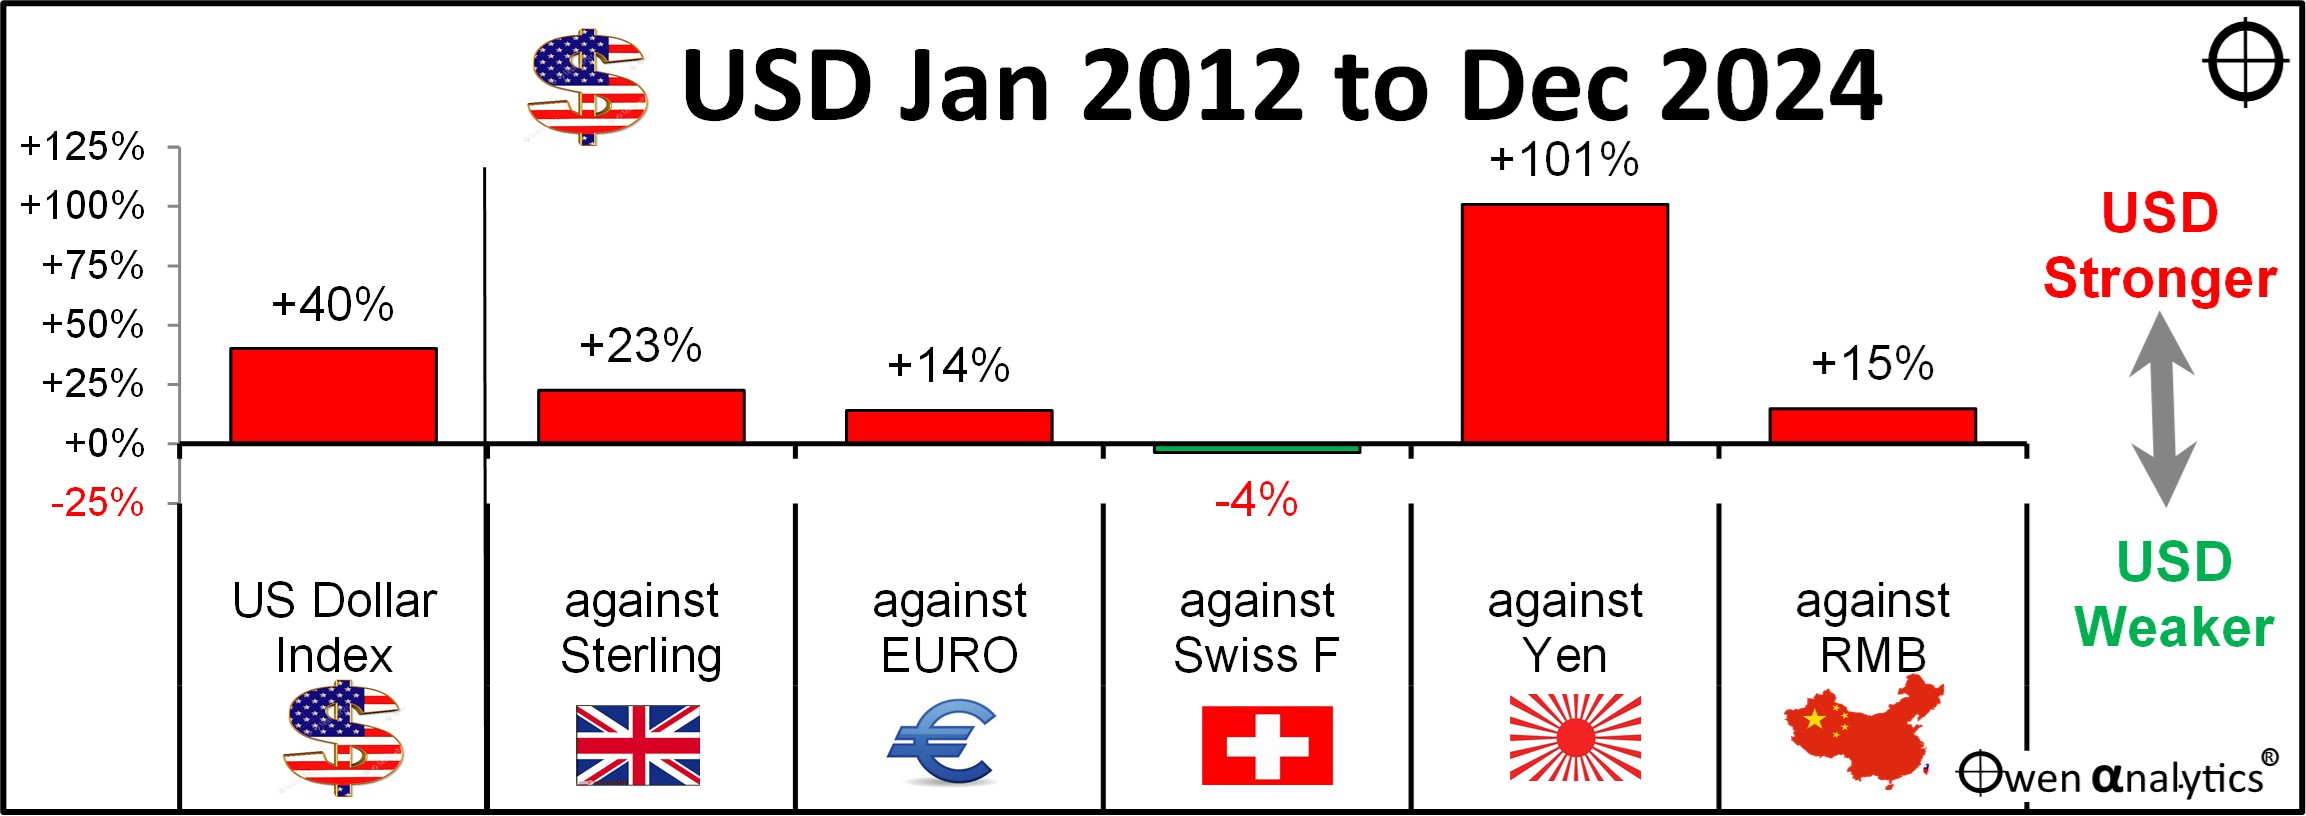
This has made US exports less competitive and it has caused the loss of millions of US jobs. For example, the cost of imported Japanese cars has halved simply because the US dollar has doubled against the Yen. If Trump slapped a 100% tariff on Japanese car imports, it would just take the relative position back to where it was in 2012. (I am not advocating tariffs here, merely highlighting the economic effects).
Trump has been trying all sorts of things to try to talk down the dollar, including mentioning the possibility of defaulting on debt, and/or converting foreign-owned US bonds into perpetual or 100-year ‘century bonds’ and unilaterally slashing the coupon interest. That sort of thing would amount to a Greek-style default/restructure – and that would certainly send people fleeing from the dollar.
The scary talk seems to be working, and so far in 2025 he has talked down the dollar by around 5%, despite the fall in US share markets:
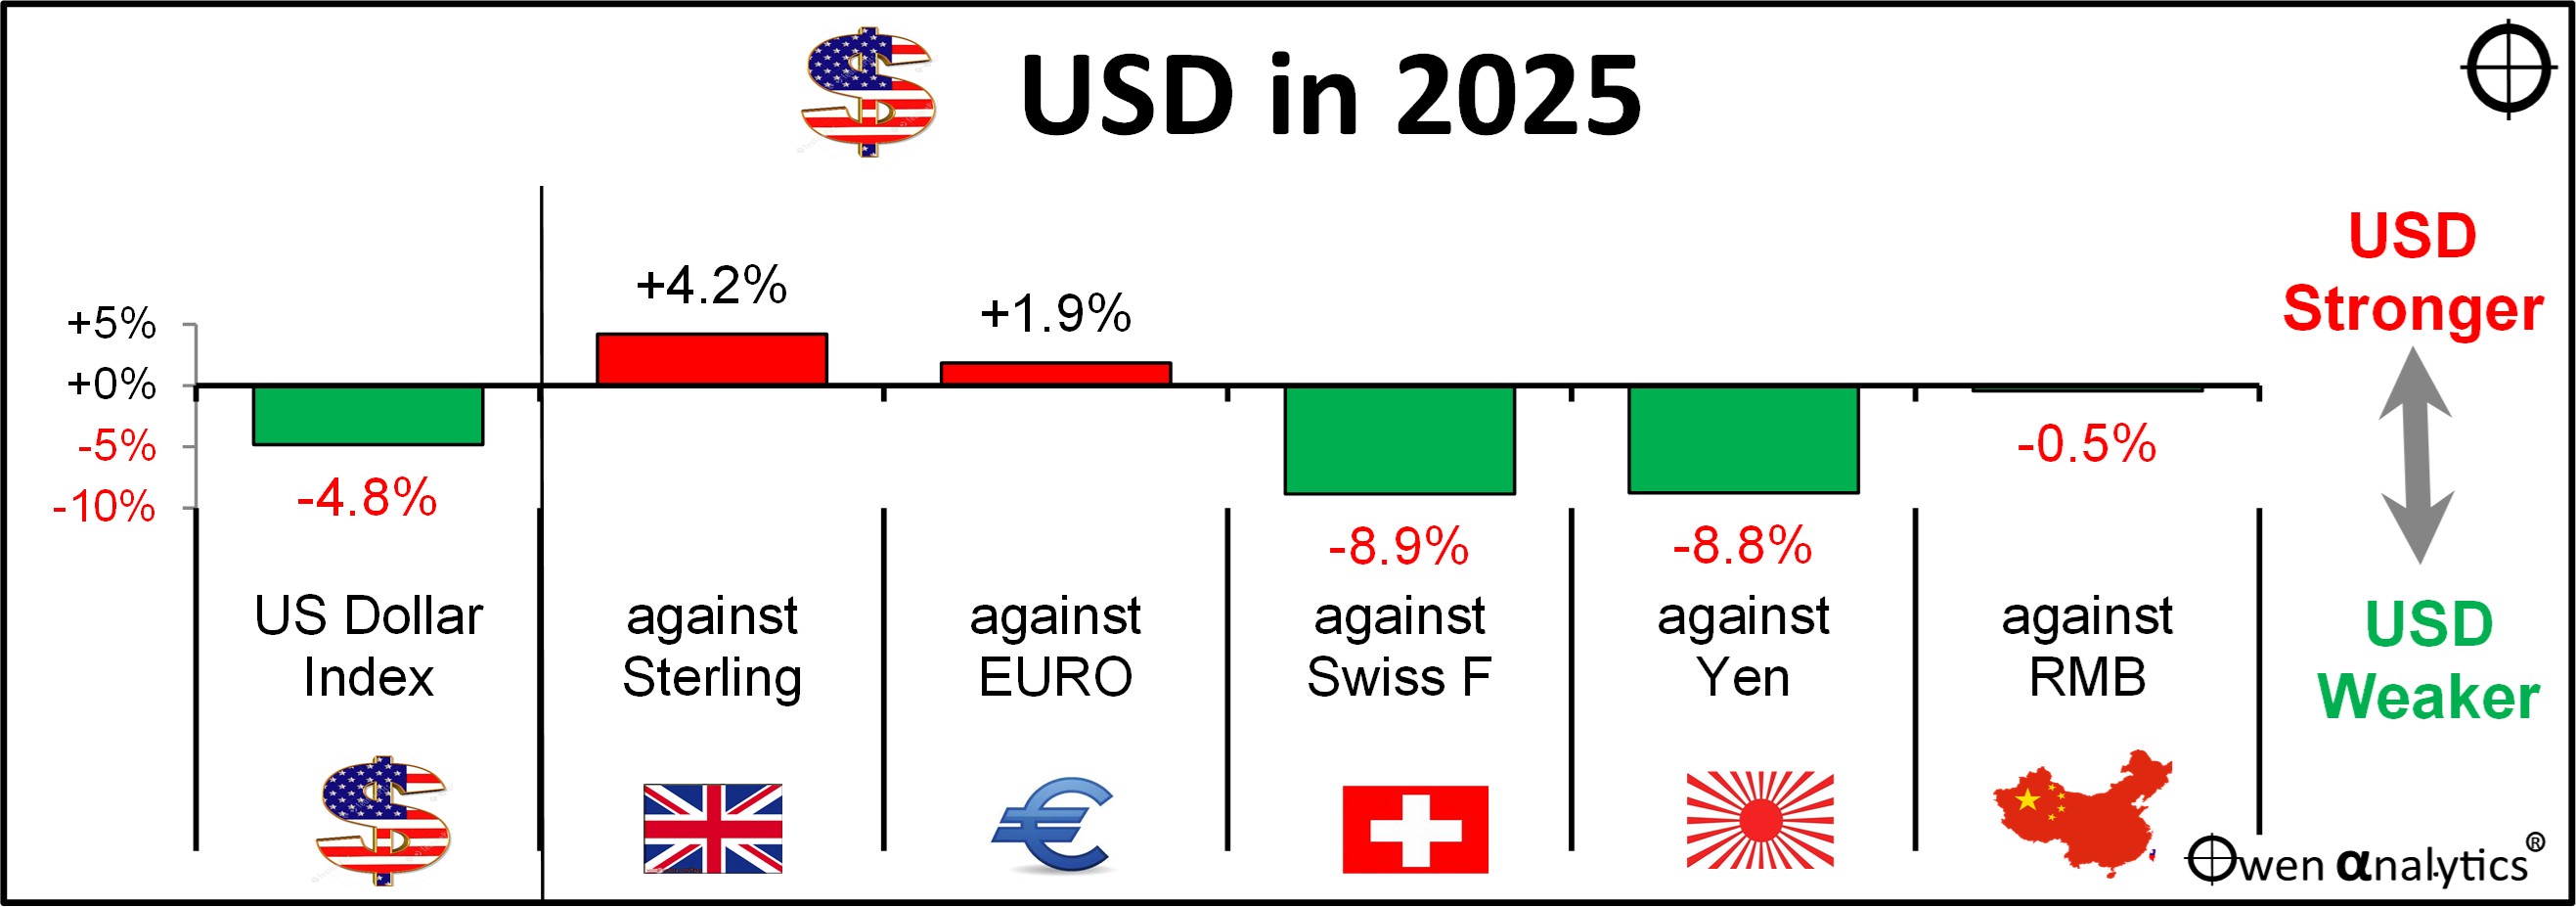
So he has effectively already assisted US exporters by 5%. A devaluation is much more sensible and less damaging than a tariff war. There is talk about a potential ‘Mar-a-Largo agreement’ along similar lines to the Plaza Accord in September 1985 in which the other major countries agree to sell dollars to bring down the US dollar.
For the big picture on the US dollar dilemma, see-

Commodities
Most industrial commodities were down in April (upper chart below) – due to global slowdown fears, and also over-production not just in oil, but the battery metals, as supply over-takes demand.
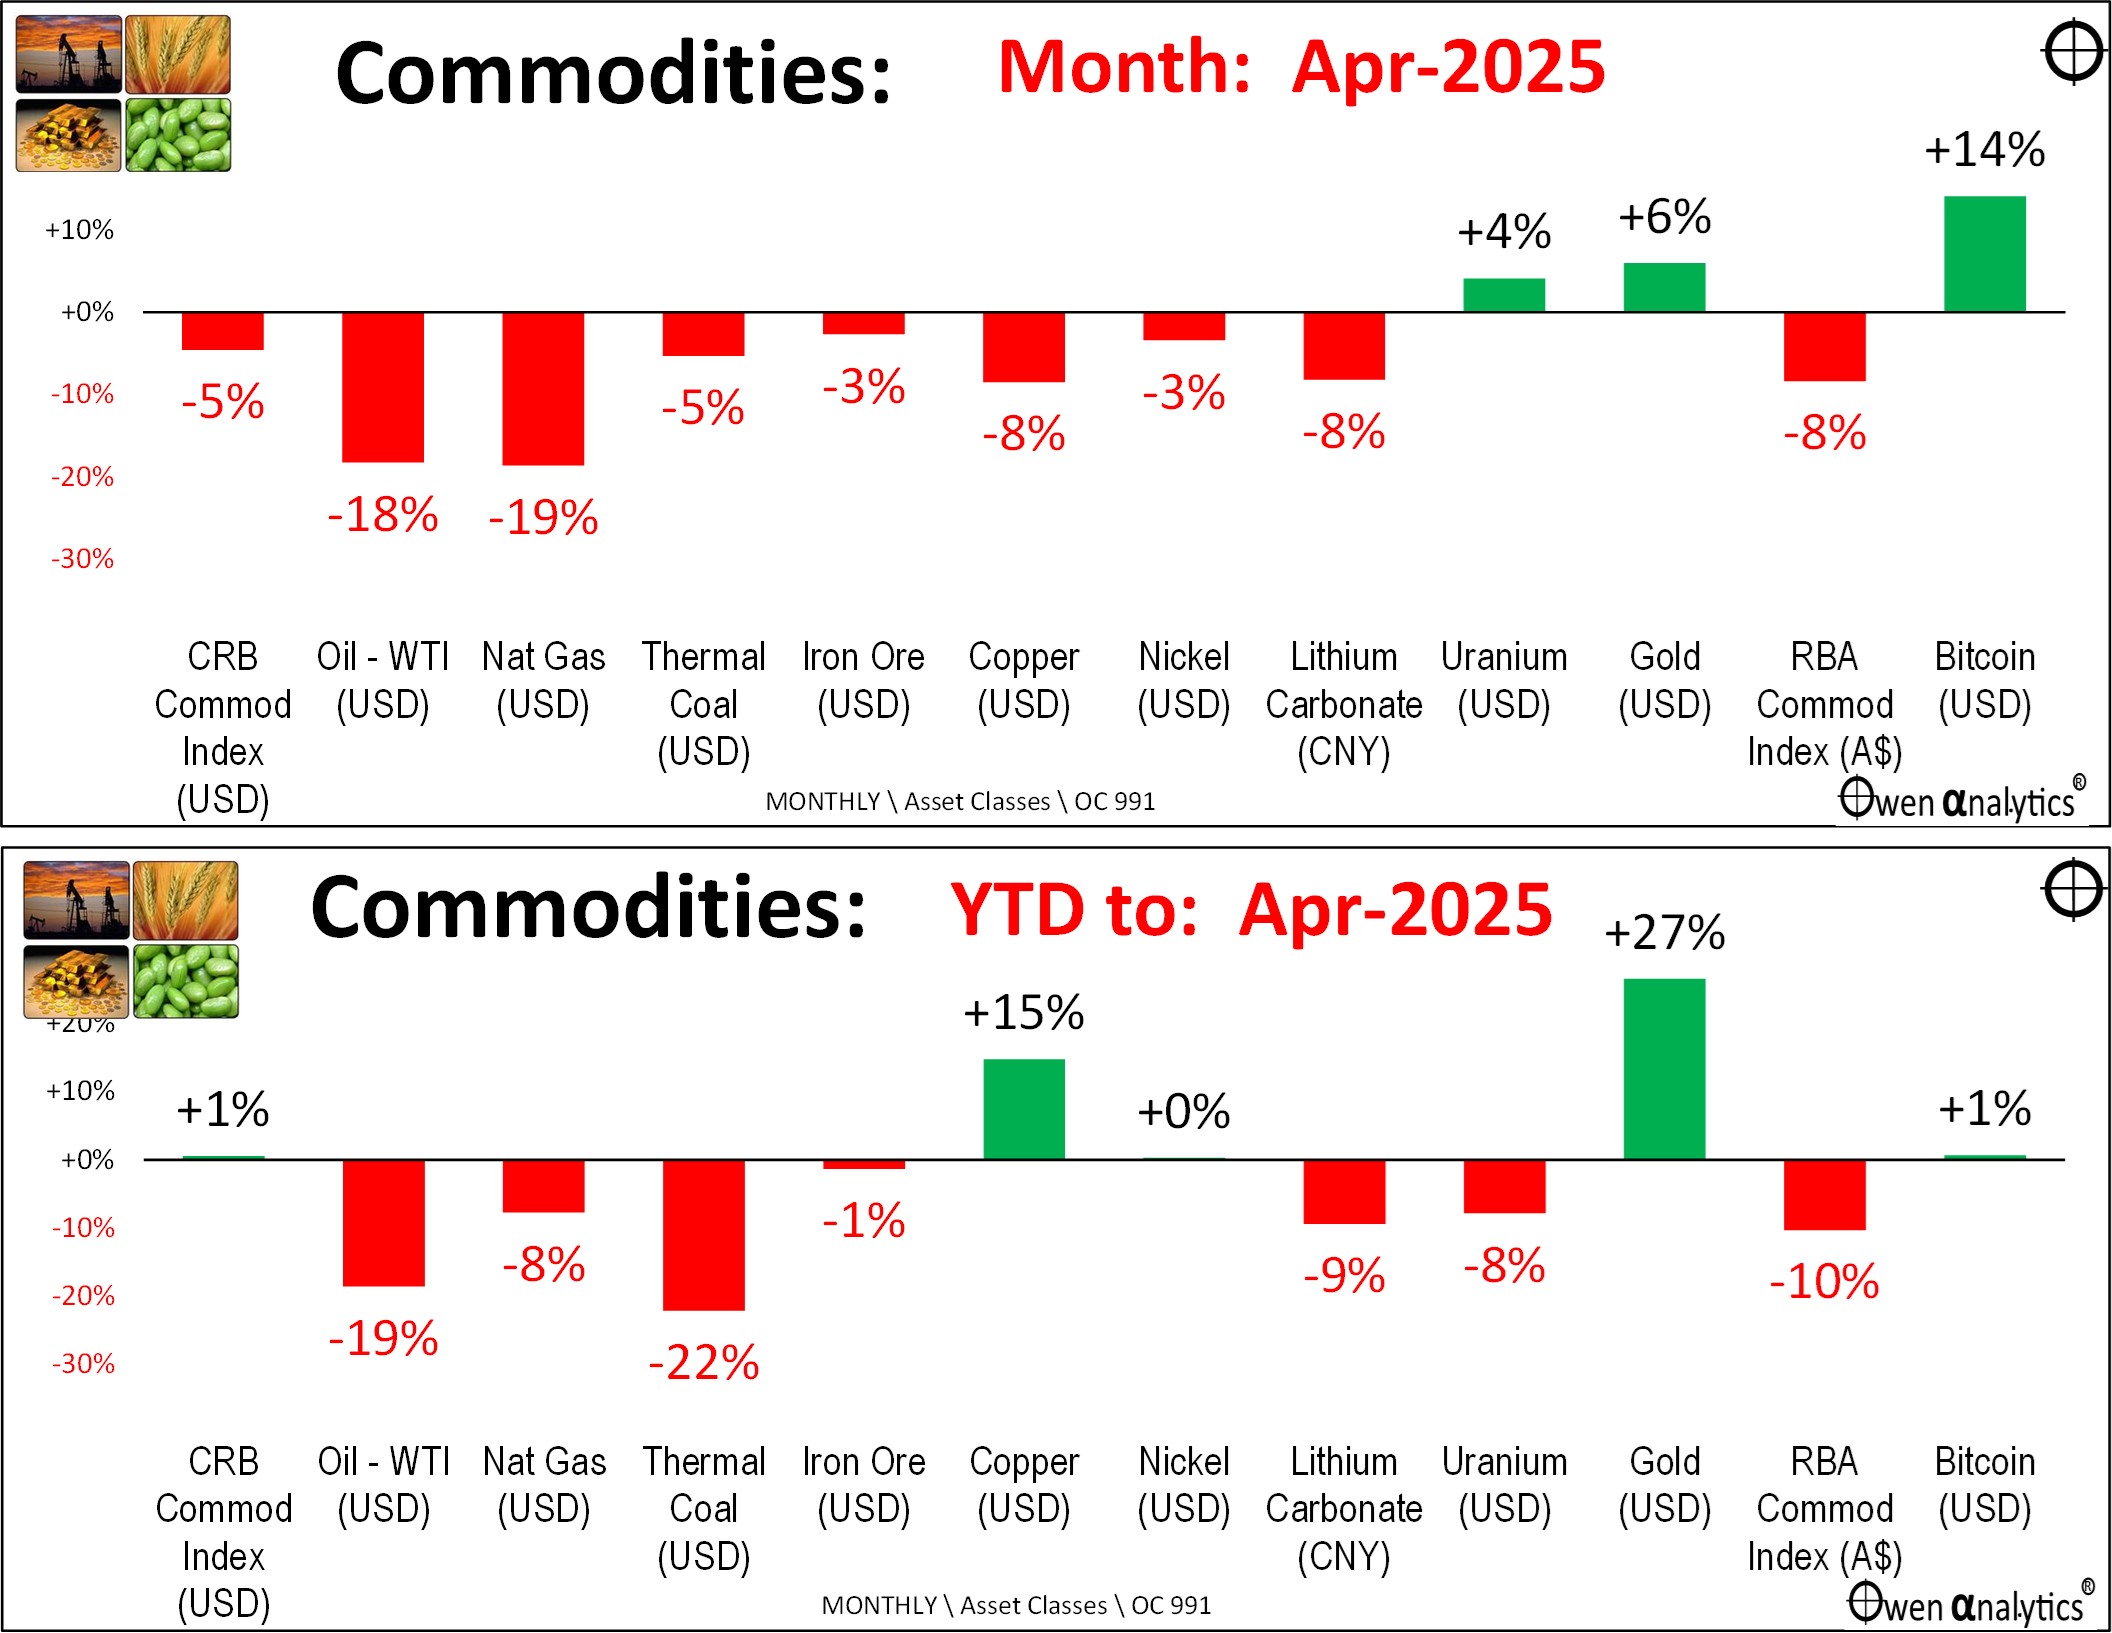
Year to date (lower chart) – all are down except Copper, which has spiked this year, mainly due to a frenzy of buying in advance of Trump’s tariffs.
Gold
Gold is the standout this year. The main factors have been strong buying from central banks (terrified by the thought of US seizure of US dollar assets, as US did to Russia after its invasion of Ukraine). Also, Chinese nationals have been strong buyers of gold (after the collapse of the Chinese property market).
I put gold into diversified portfolios last year. In portfolios – preferring the un-hedged ETF version, so we get the AUD returns that benefit from the falling AUD as well as the rising gold price.
But that does not mean readers should rush out and buy it now! Every year we face a whole new set of challenges.
Bitcoin (right end of the charts) was up in April, but is flat for the year to date (and still -11% below its peak on 11 January, Trump’s inauguration day).
That’s about it for April. Unfortunatly a longer than usual report – but there is a lot to cover!
Looks like we will see more drama in May!
‘Till next time – safe investing!