Greetings fellow investors! - Here’s my monthly snapshot on global markets for Aussie investors.
Key points:
-
-
- Share markets posted a fifth straight month of gains, despite Trump’s frenzy of deals, adjustments, backflips, side-deals. The US market posted another five all-time record highs in August, and the ASX did even better with seven.
- One key driver was the US Fed shifting its main concern from sticky inflation to weakening jobs markets, which boosted hopes of more US rate cuts soon.
- To date we have seen little impact of Trump’s tariffs on trade, inflation, profits, or jobs, but it is still early days yet.
- The US had a relatively strong profit reporting season, but it was a rather wild ride in Australia. I outline the winners and losers in each market.
- I also cover currencies, commodities, interest rates, inflation, and more.
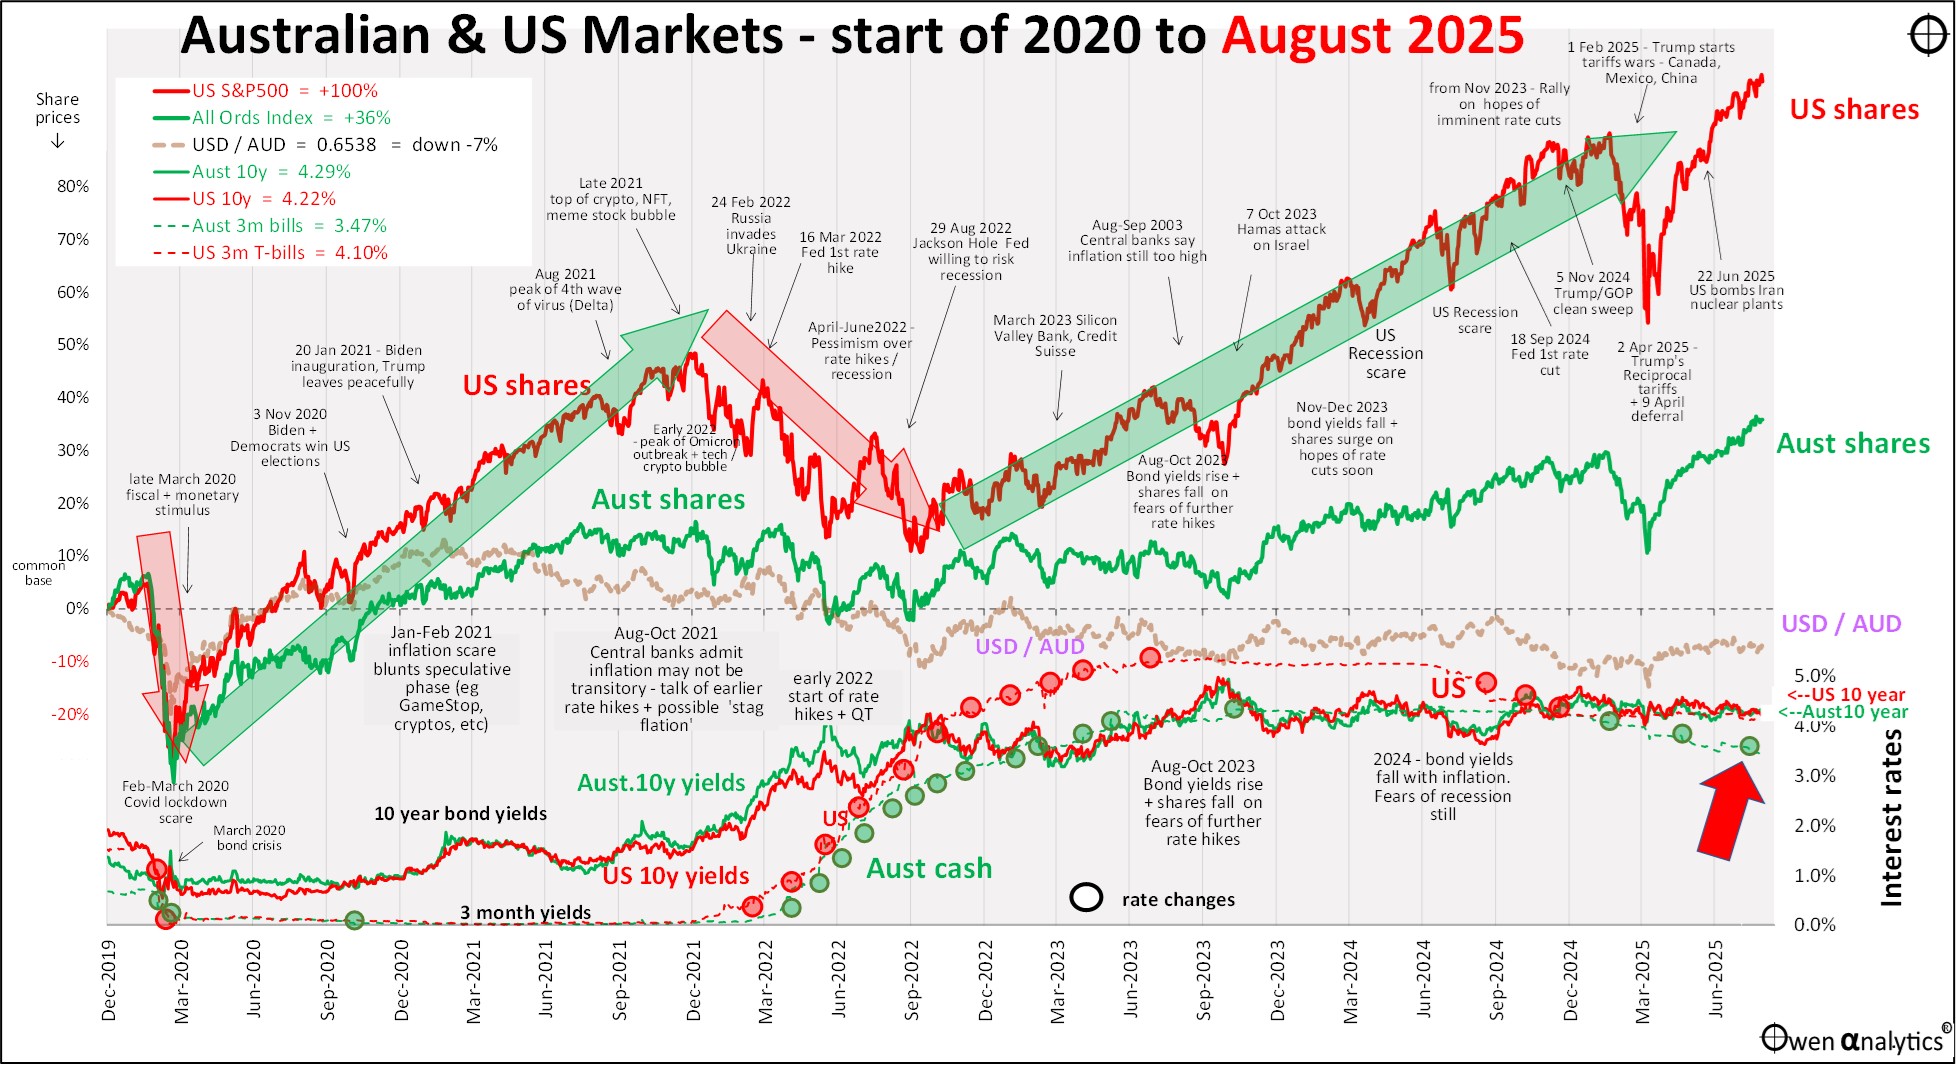
First - my essential 1-page snapshot chart - covering Australian and US share markets, short and long-term interest rates, inflation, and the AUD/USD exchange rate. As usual, there are two versions – first is the traditional version on a single chart:
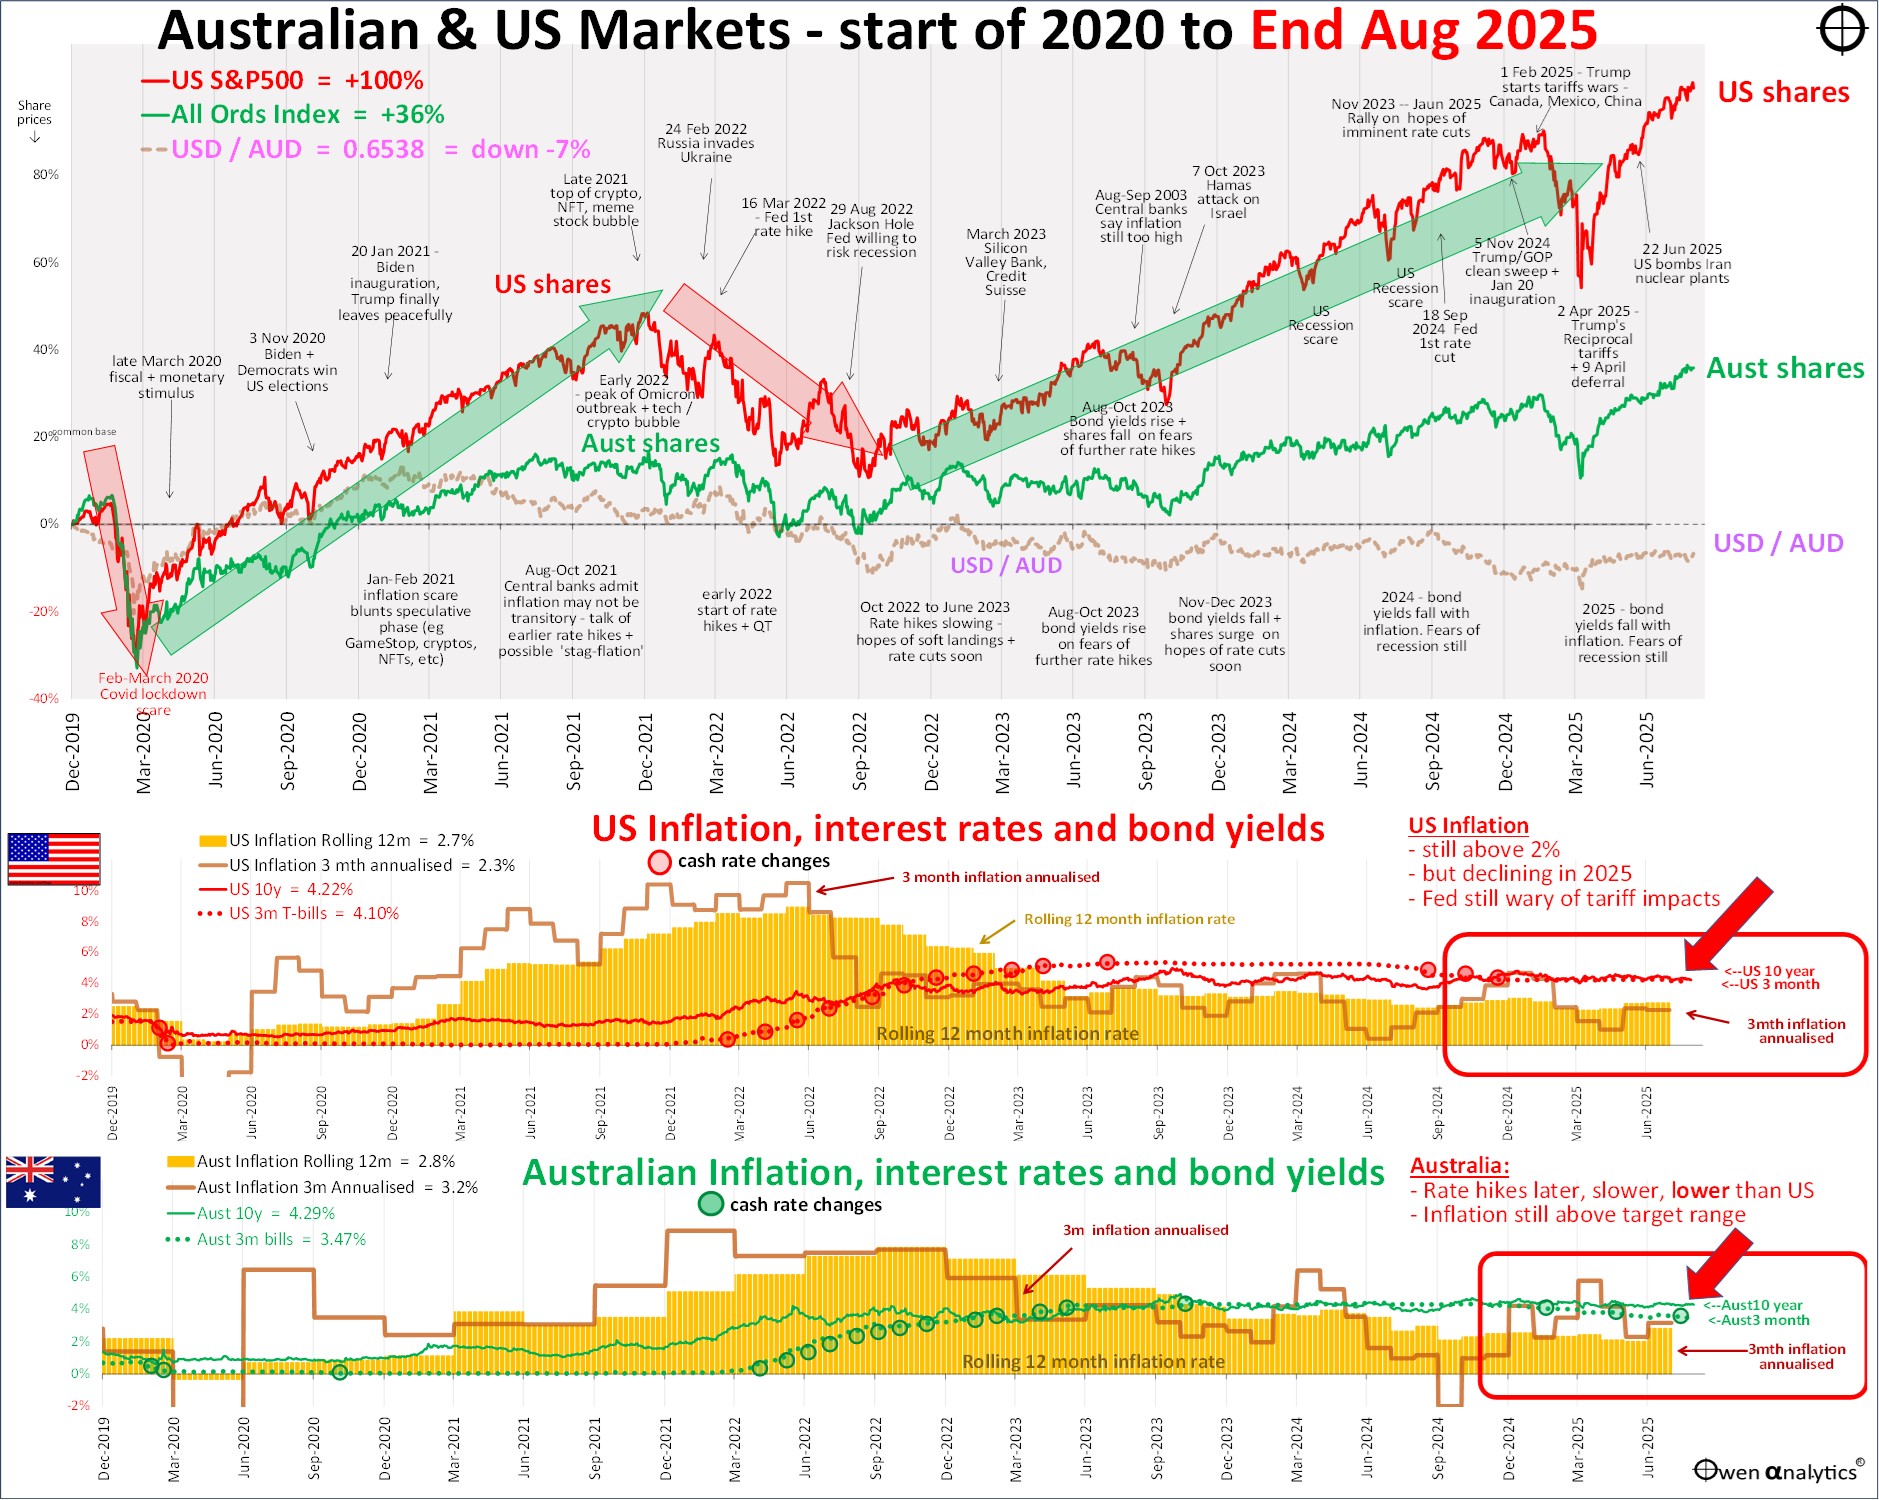
Plus the alternate version below, requested by several advisers - showing Australian and US inflation separately in the lower sections:
Share markets
Global share markets rose for a fifth straight month. That’s not unusual - we had two runs of 5 straight months of gains in the past couple of years. The US market posted another five all-time record highs in August, and the ASX did even better with seven!
Two main reasons for the continued bullishness – the first is further signs of more rate cuts coming soon. The most important of these was US Fed Chair Jerome Powell’s sudden shift in focus from sticky inflation to job market weakness, highlighted in his Jackson Hole speech on 21 August.
Second – Trump’s frenzy of activity continues to support markets – deferring or delaying tariffs, the flurry of deals with other countries that include agreements to buy more US exports, invest more capital in the US, and buy more from US defence manufacturers. Trump’s attacks on the Fed (including his verbal attacks on Powell and his attempts to fire Fed Governor Lisa Cook) are probably a net positive for share markets as they create expectations of lower interest rates ahead.
Even Trump’s 15% export tax on Nvidia and AMD chip sales to China appears to be a net positive as it will tax new exports that were previously banned under Biden’s CHIPS act.
Global Industry Sectors
It was another sea of green ink across global share market sectors in August (middle chart) -
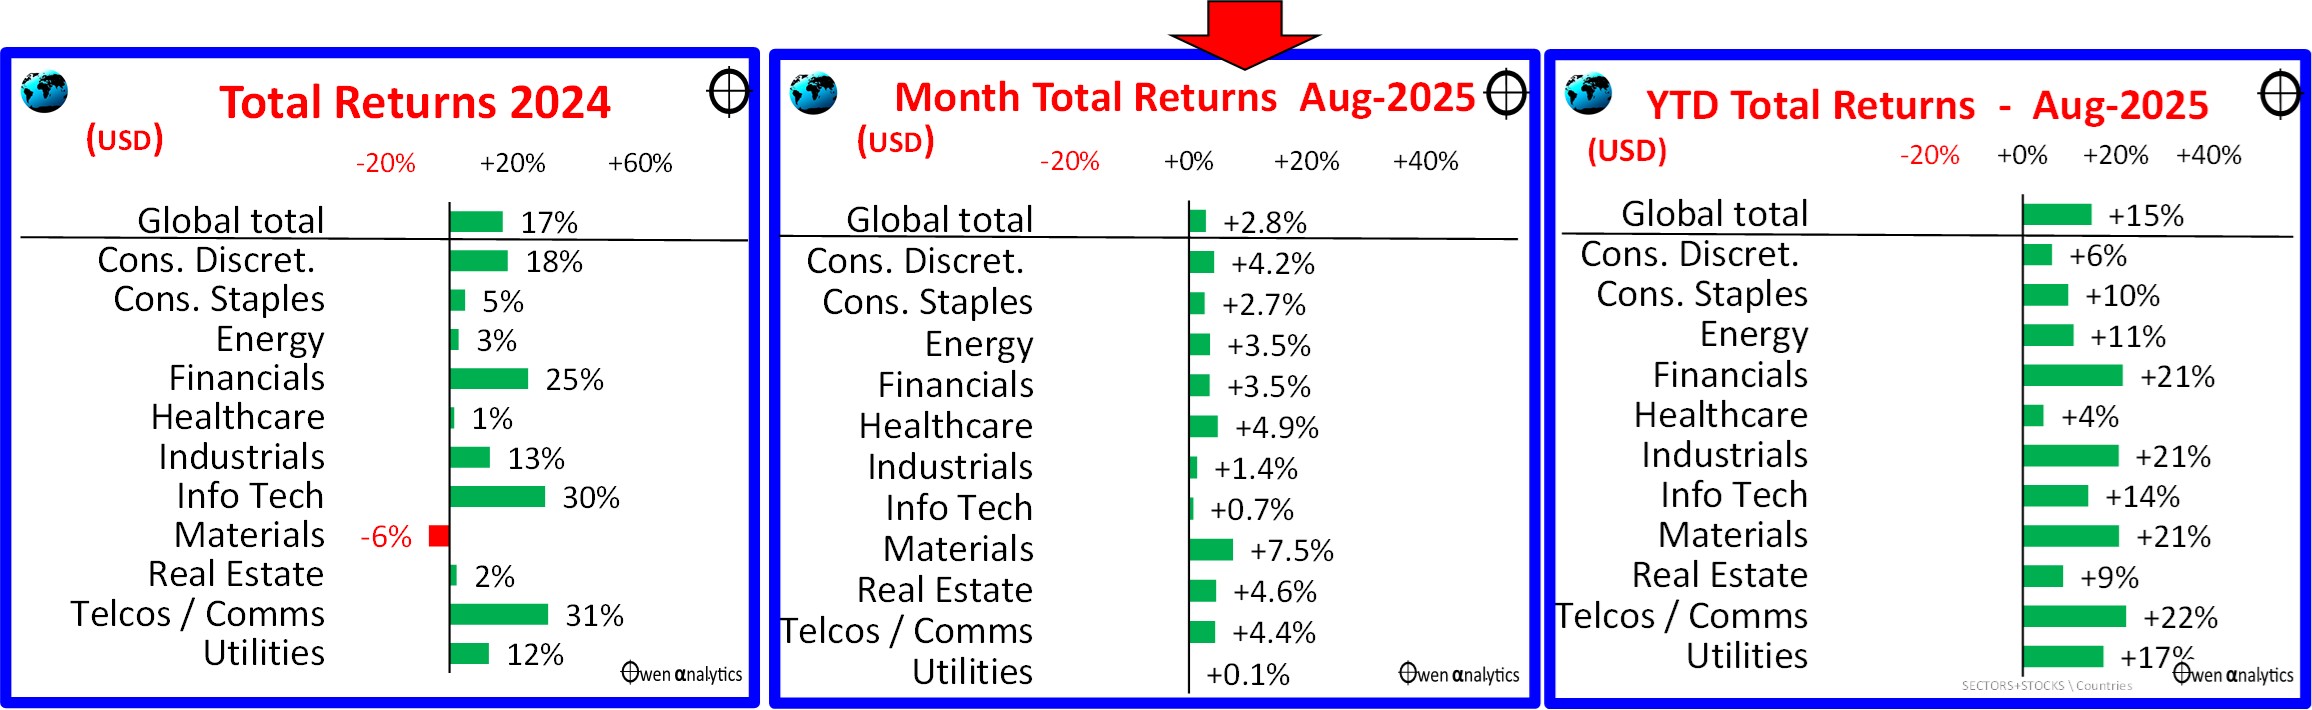
Most global sectors are heading for above-average returns for calendar 2025 to date (right chart above).
Major stocks
Here is the picture for the largest global stocks (all of which are US based):
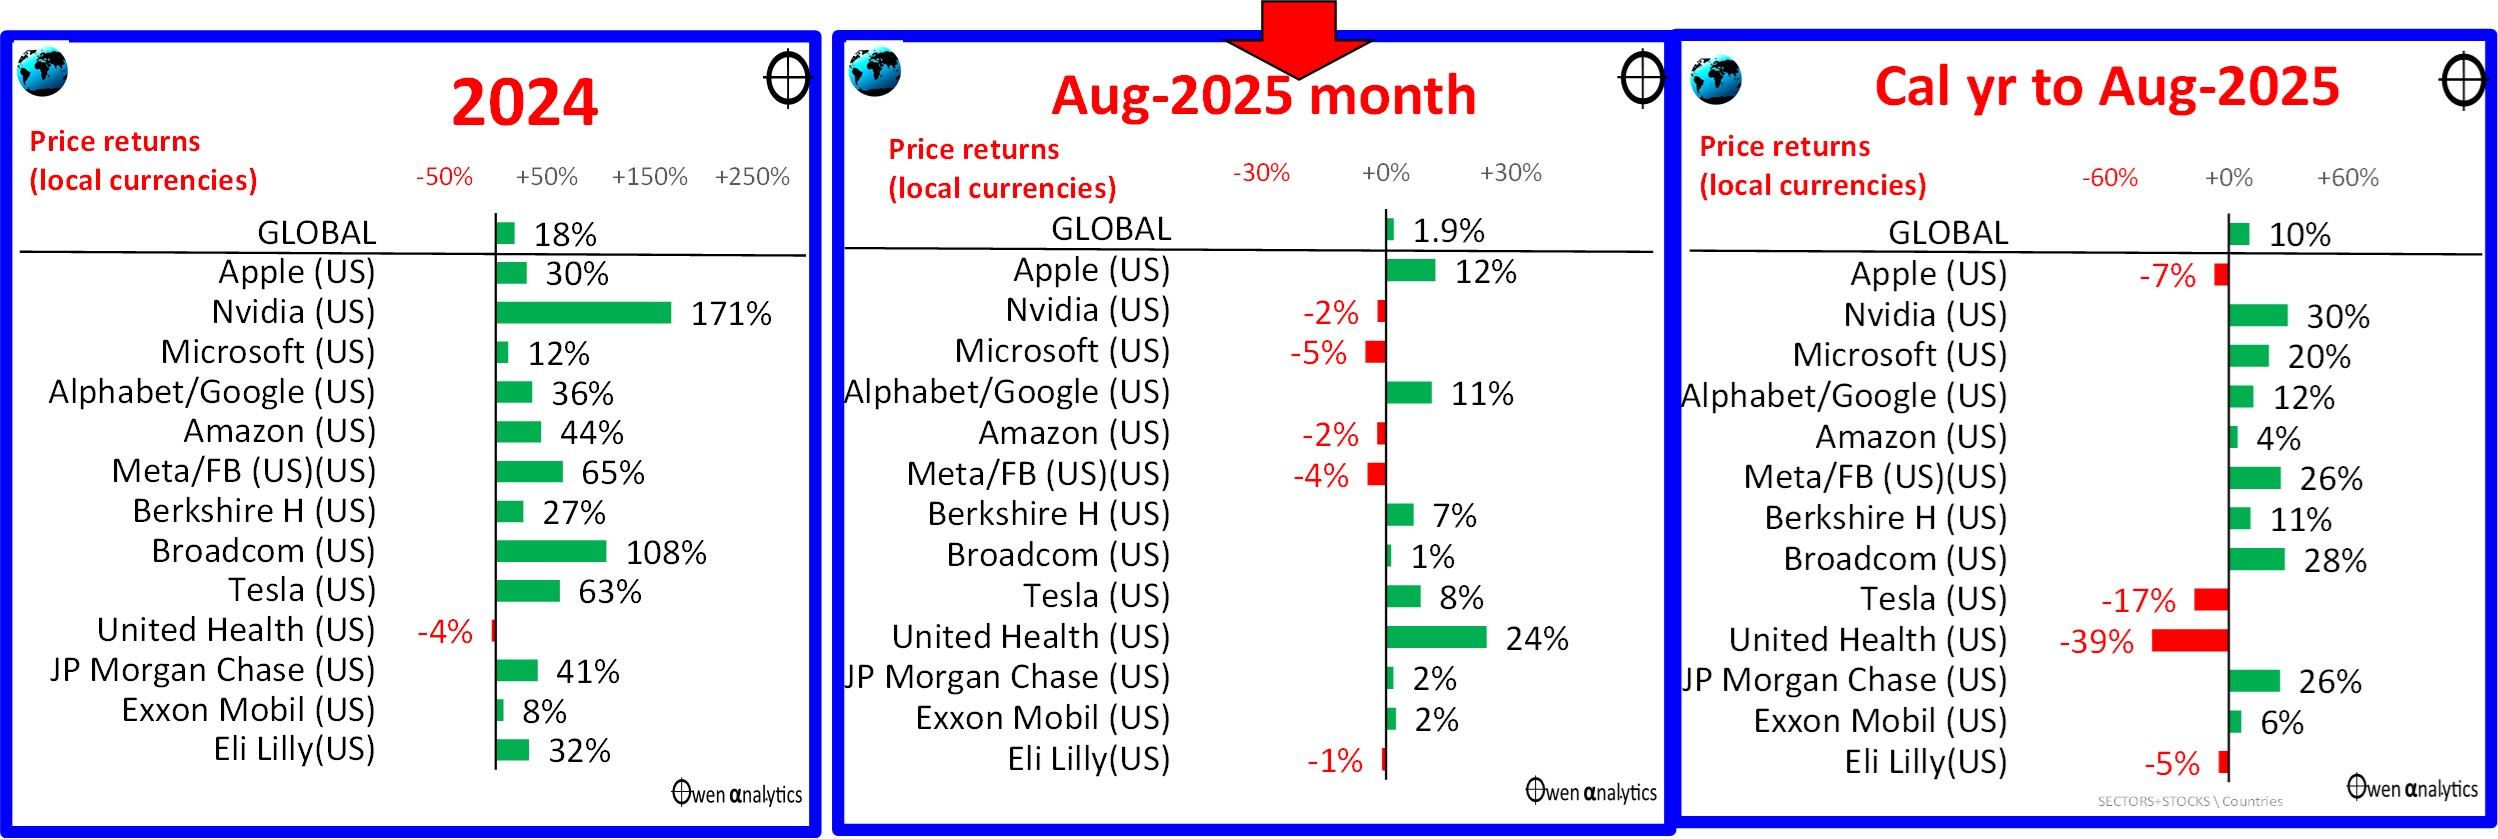
After the strong gains in August (middle chart), most are well ahead for the calendar year to date (right chart). Leading the pack are the (current) perceived winners from ‘ai’: Nvidia, Meta/Facebook, Microsoft, and Broadcom (ex-Hewlett Packard). Leading the banks is JP Morgan after its recent 180-degree policy backflip on crypto.
The global giants down this year include:
-
-
- Apple (growth/tariff concerns),
- Tesla (Trump’s removal of subsidies for EVs, plus consumer boycotts),
- United Health (a host of self-inflicted wounds, but recovered some ground in August),
- Eli Lily (main competitor to Denmark’s Novo Nordisk’s Ozempic/Wegovy)
Mag-7 update
For context, here are the share price charts for the so-called ‘Magnificent Seven’ stocks over the past decade (plus I have added China’s Alibaba and Tencent):
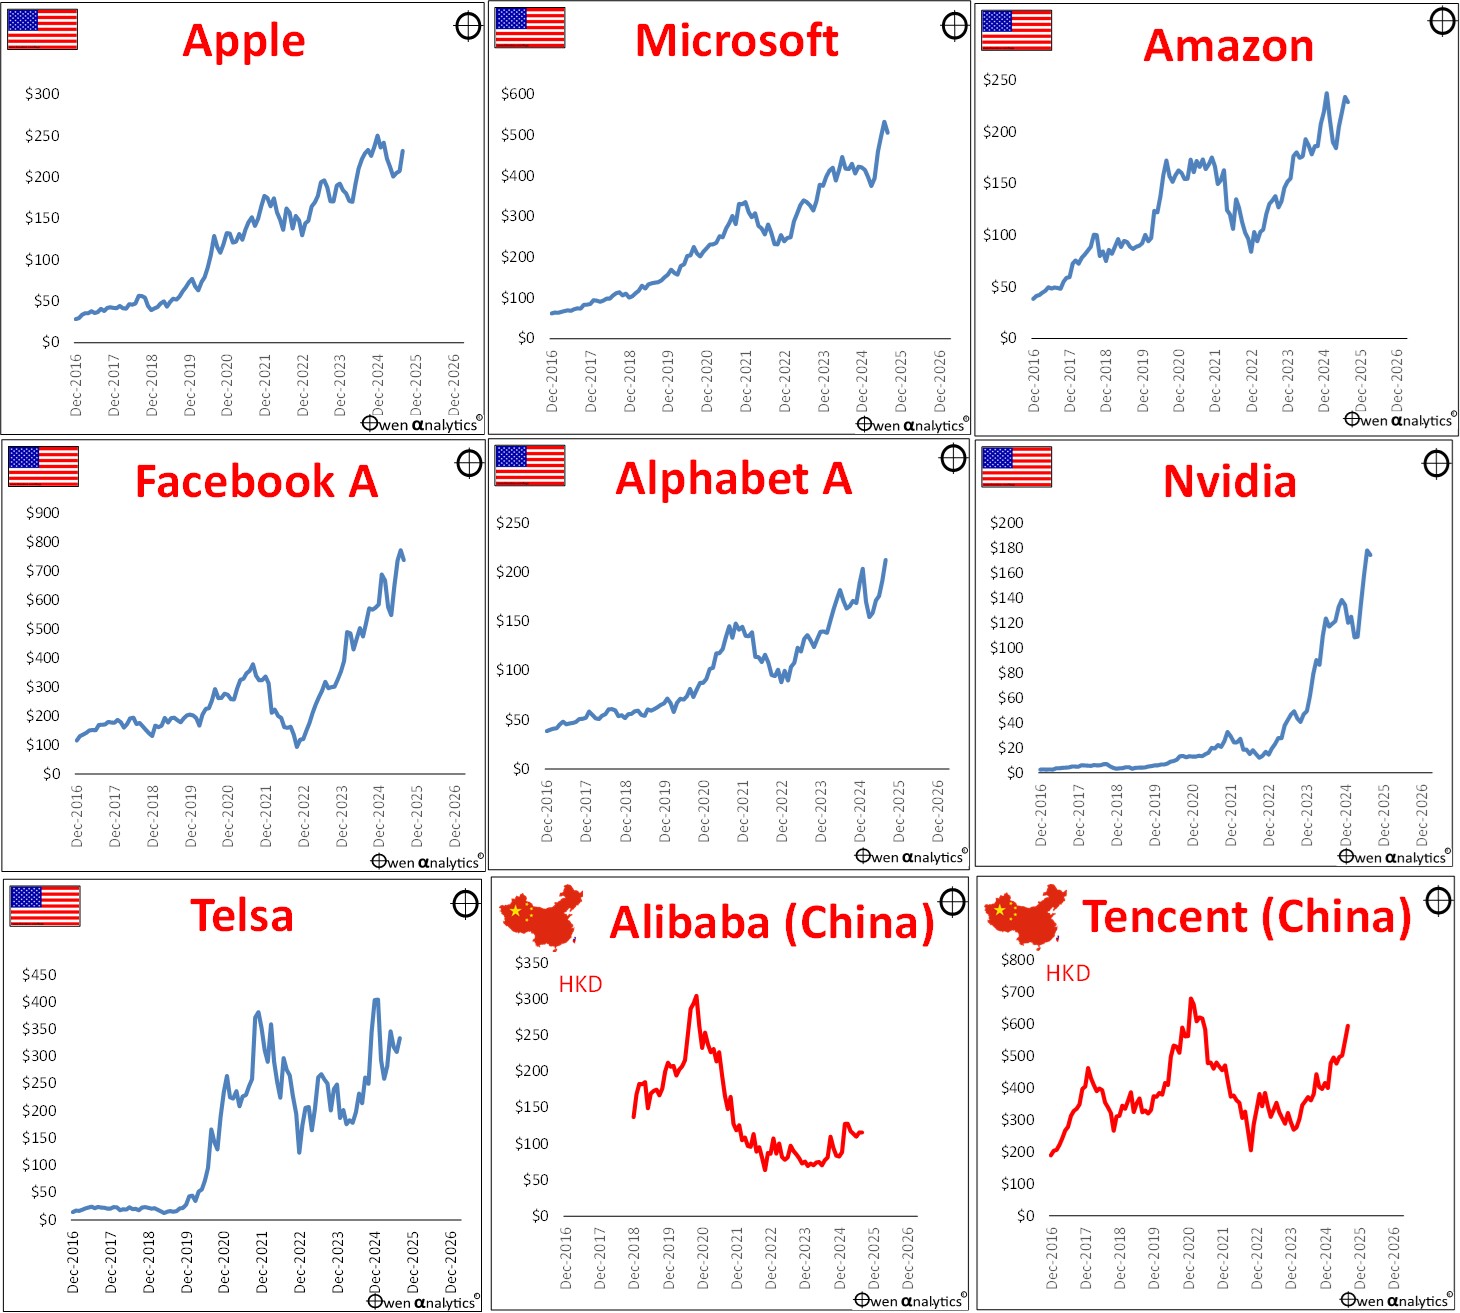
I have not used any y-axis scale trickery here – the vertical y-axes all start at zero, and have regular, nominal scales, which highlights the explosive share price growth of the US giants from very low levels in the past decade.
China’s Alibaba and Tencent are up in the Chinese rally this year, but both are still below their 2021 peaks. By comparison, all of the US majors are well above their previous peaks in the 2021 Covid stimulus boom.
(The obvious odd-man-out here is Tesla, which should never have been in the ‘Mag-7’ in the first place, as it is little more than a low-margin car maker.)
The US tech giants are still very expensive on a range of metrics. See my recent report on how they stack up individually on revenues, profits, dividends, and pricing -
Profits and Pricing
The July-August reporting season for US companies (for their June quarter results) was relatively strong. 77% of S&P500 companies beat broker consensus expectations, and aggregate earnings per share was up +14% over the 12 months to June (up from +8% for the prior 12 months to June 2024).
Consensus forecasts for the next couple of years are pencilling in aggregate +15% EPS growth for calendar 2025, and similar growth rates again for calendar 2026. These would appear to be very ambitious to say the least as Trump’s tariffs have not really had a chance to eat into US consumer spending or US company profits yet.
The problem is that S&P500 pricing is at a very bullish 30 times trailing (past 12 months) earnings, and 26 times next year’s ambitious earnings forecasts. These are very optimistic multiples on very optimistic earnings outlooks – a double layer of over-confidence, and highly vulnerable to any negative shocks from left field.
But so far, investors have shrugged off Trump’s tariffs, weak GDP growth, Moody’s US credit downgrade, and ongoing wars in the Middle East and Ukraine. Are US company earnings and investor optimism invincible?
I recently published a six-part series on pricing of global share markets to better understand their implications -
For more on US profits and pricing – see:
Major country share markets
Most of the main global share markets continued their upward march in August (middle chart), and most are heading for good returns again for the 2025 calendar year (right chart) –
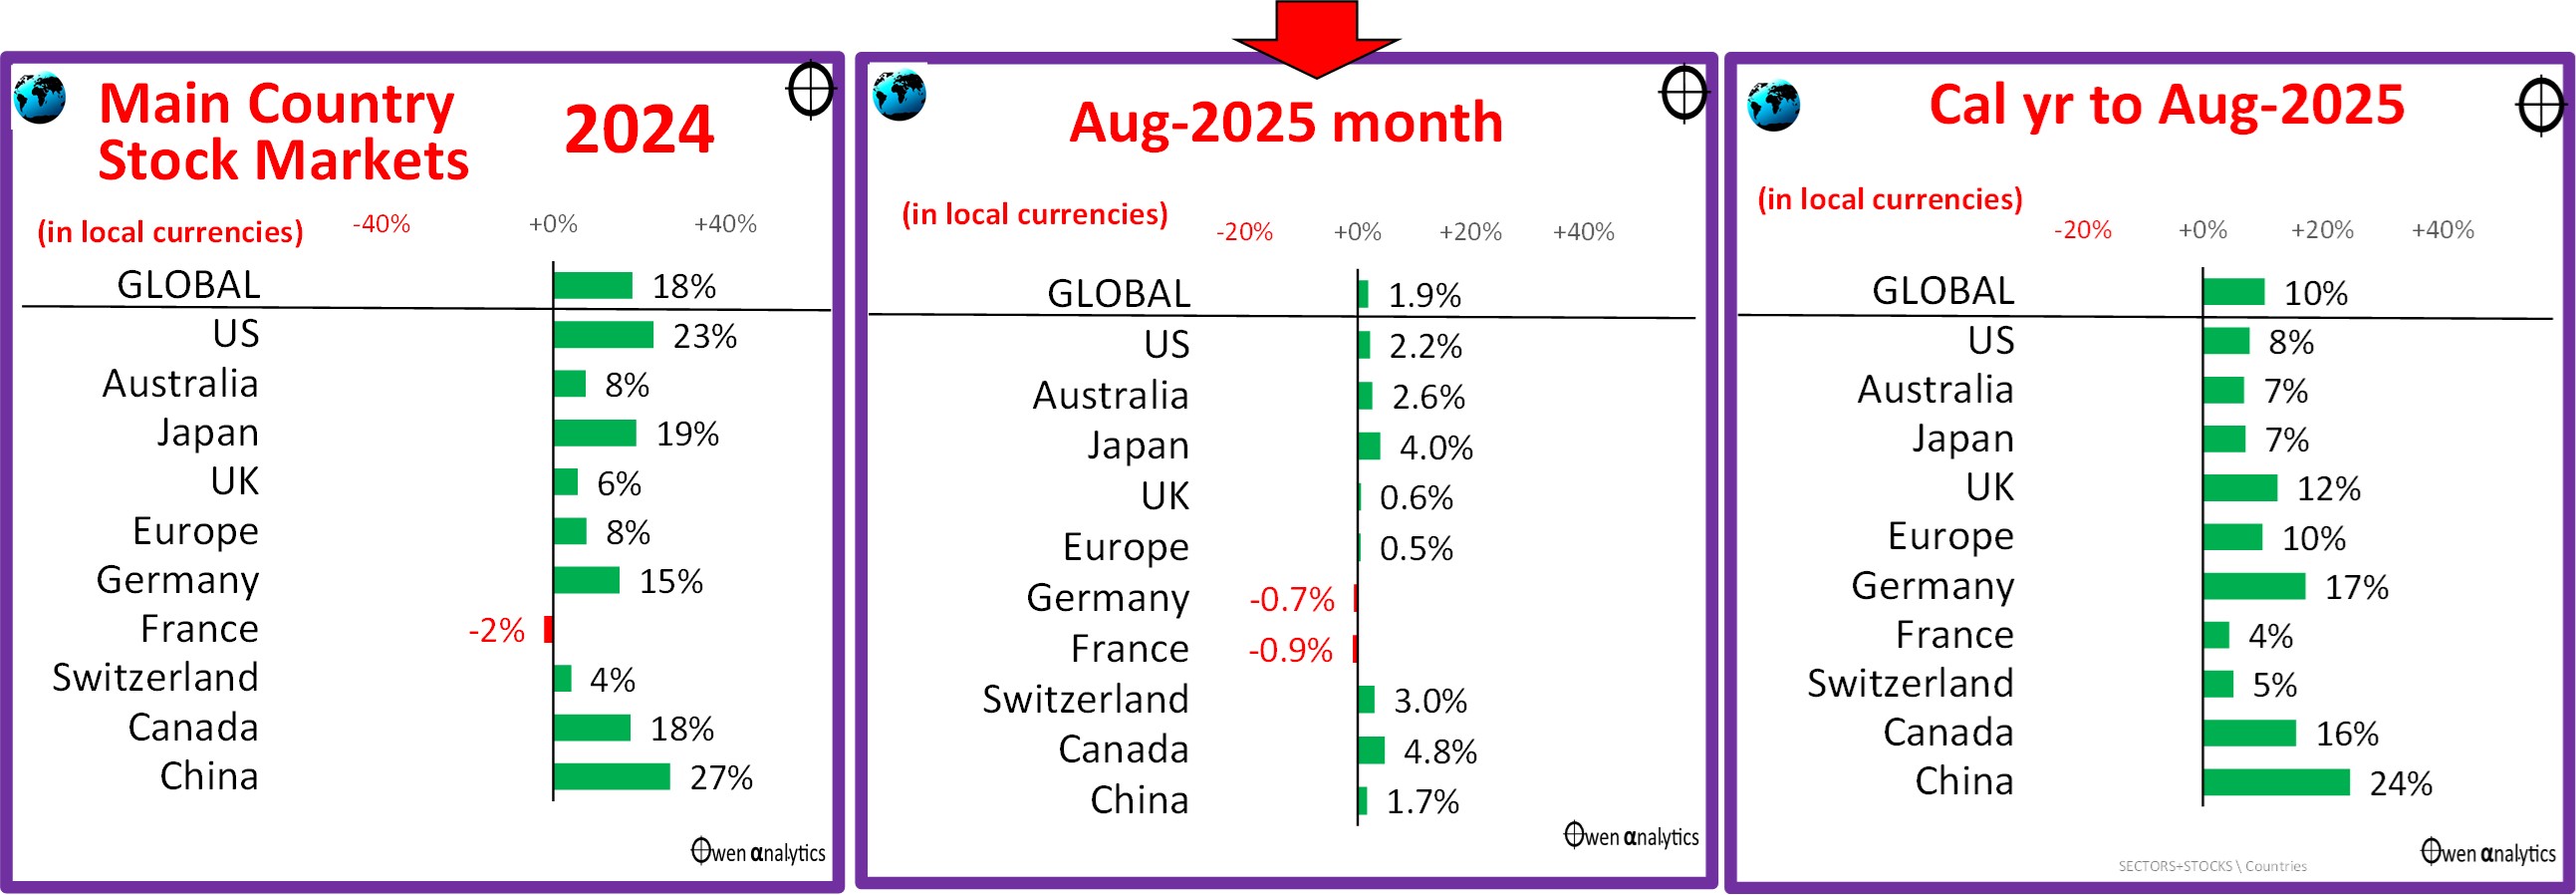
It is a sea of green ink – continuing to defy the perennial doom-sayers who like to endlessly prattle on about imminent global recessions and stock market crashes caused by Trump’s tariffs or [insert latest scary thing here].
Australian shares
The local share market was up with the rest of the world in August (middle chart below). Here are the main stocks:
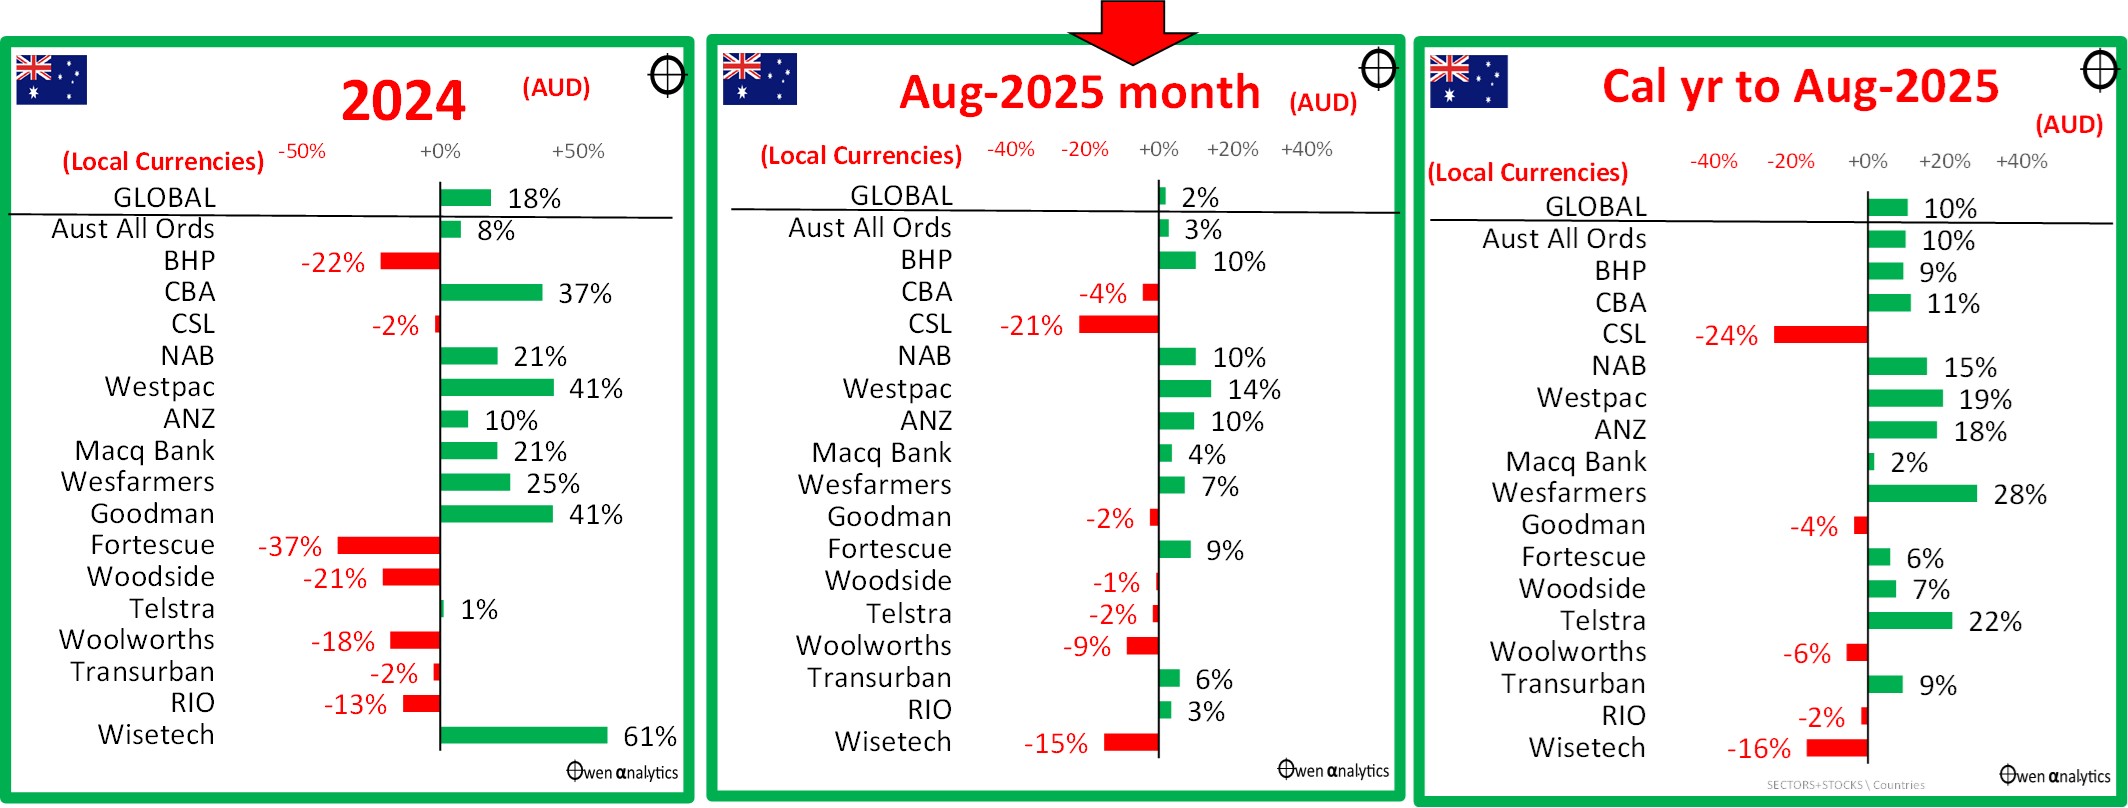
There were three main themes on the ASX in August.
First – the August reporting season (for June reports) was one of the most volatile outside of a recession environment, in terms of market and share price reactions to unexpected results.
(As an aside - compared to the generally quite thorough, thoughtful, insightful, and usually too conservative US broker/analyst community covering US stocks, the broker/analyst research industry in Australia is still very much wild west territory with very little thought, less insight, and generally very little idea about the companies they are supposed to be covering. When companies report their profits, the local broker/analyst community almost always caught completely off guard.)
The winners this reporting season included Coles, Qantas, IDP, Tabcorp, Seek, CarSales, Flight Centre, Ansell. The losers included CSL, CBA, Woolworths, James Hardie, Reece Plumbing, Wisetech, Xero, Sonic, Ramsay.
Second – within the big banks, there was a long-awaited mini-rotation out of the vastly over-priced CBA into the slightly less vastly overpriced other big-3. CBA fell 4%,and the money went into Westpac +14%, NAB +10%, and ANZ +10%. All of the big-4 are still horrendously over-priced relative to their underlying earnings and dividends growth, which have actually gone backwards after inflation since the 2015 banking peak.
(Disclosure – I am personally over-weight Aussie banks and have been since the early 1990s, so I am just sitting here milking it while the crazy boom lasts. I can’t sell because of the embedded CGT, so I am getting insanely high dividend yields (plus franking credit refunds) on my buy-in prices. Enjoying the benefits of apathy!)
For my take on CBA see –
Third – ASX miners got a boost pretty much across the board in August. The mini-recovery in iron ore prices (back above $100/tonne) after some signs of Chinese stimulus (Tibet dam announcement, and Shanghai home ownership role easing) lifted the big-3 – BHP +10%, FMG +9%, RIO +3%.
More lithium mine closures raised hopes of an end to the global over-supply problem – and lifted lithium miners like Pilbara Min, MinRes, and IGO. The US setting a minimum price for rare earths sent Lynas soaring, and the continually rising gold price lifted the gold miners like Northern Star and Evolution.
For calendar 2025 year to date - the stars this year (in share price terms anyway) have been CBA and Telstra – for mysterious reasons. They are hardly growth stocks – they are the opposite of growth. CBA’s earnings per share and dividends per share are lower in real (inflation-adjusted) terms than they were a decade ago. Telstra’s earnings per share and dividends per share are lower than they were 25 years ago, not just in real terms but in nominal dollar terms as well! Shareholders seem happy to keep bidding up the share prices of these decaying dinosaurs!
One developing theme I have been reporting on this year is the possible emergence of the next big global commodities cycle, which should see a great rotation out of over-priced banks and into miners. I will write about this in future articles.
Inflation & interest rates
First, to the US market because the US drives all global markets including the ASX. After three rate cuts in September, November and December of 2024, the Fed hit the pause button and said they are in no hurry to cut rates further, despite a barrage of criticisms and personal attacks aimed at Fed Chair Powell from Trump and his stooges.
The big change in August was Powell’s speech at the annual Jackson Hole get-away, when he appeared to shift his attention from sticky inflation, to the weakening jobs market.
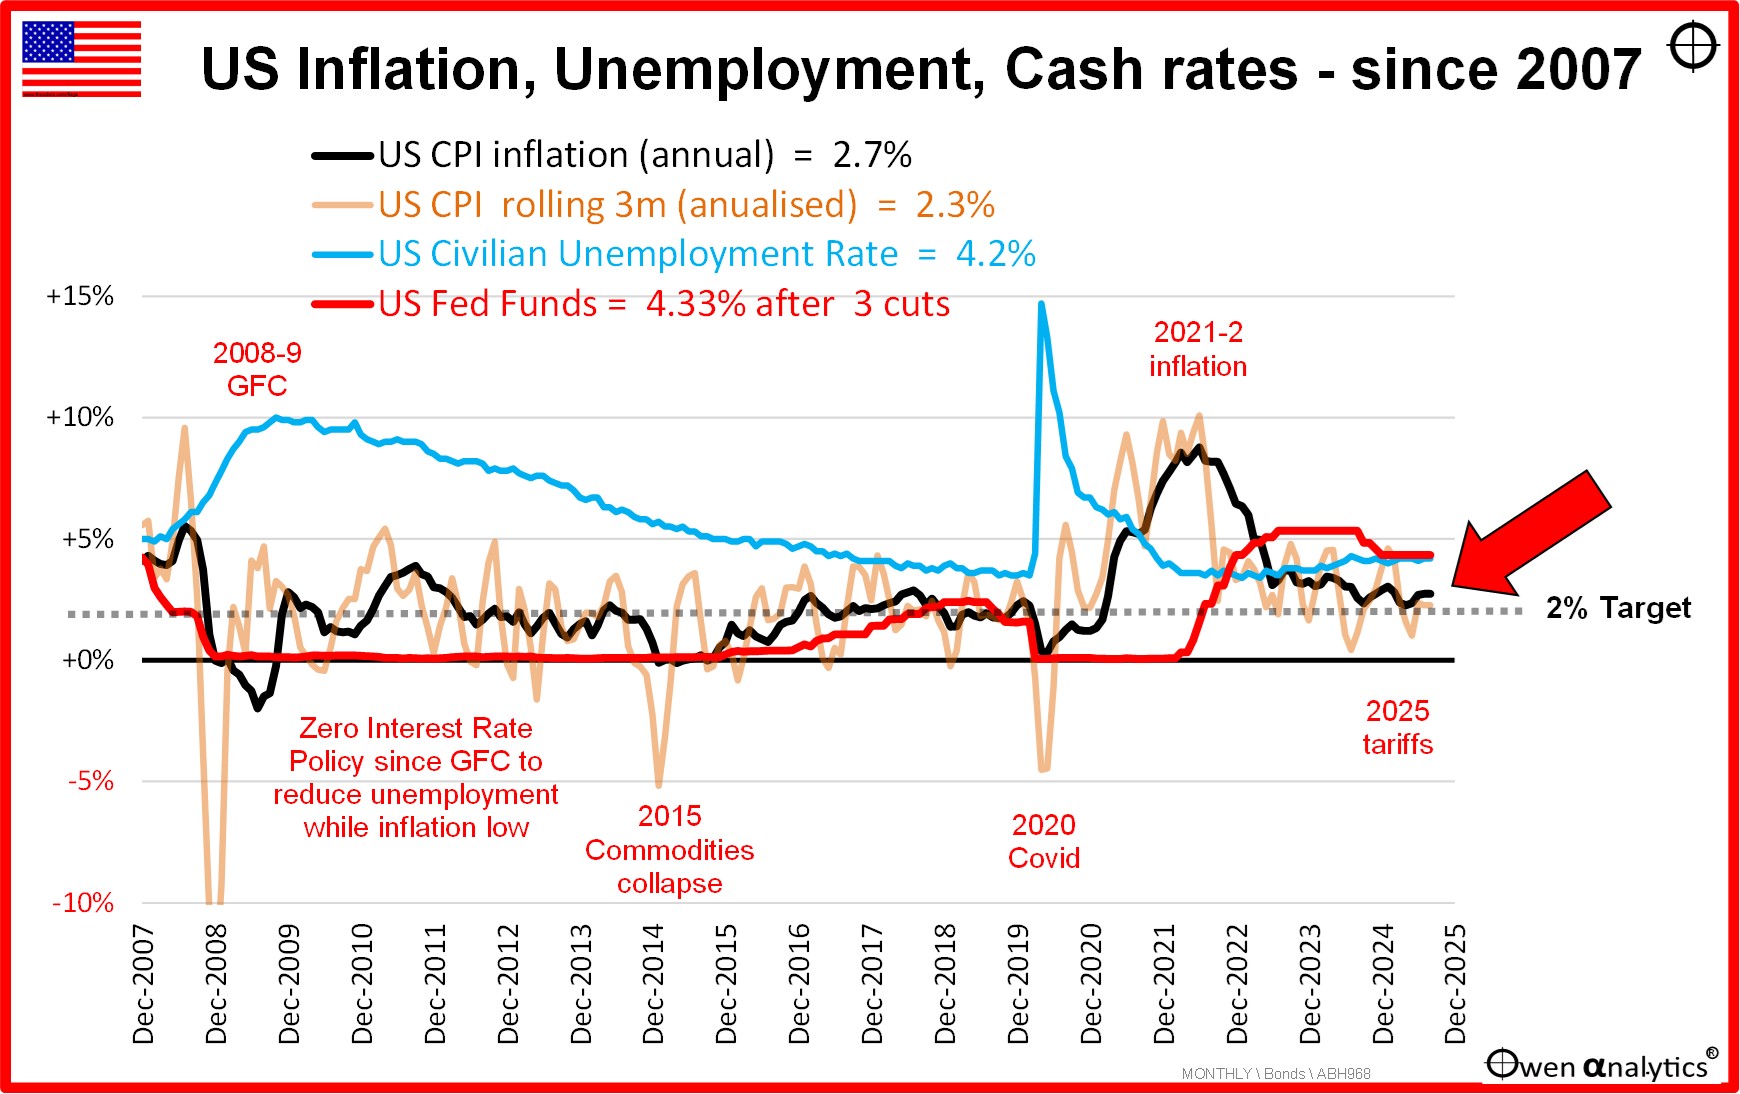
The 12-month inflation rate is still a rather high 2.7%, including some elements of tariff impacts, and the annualised 3-month rate is 2.3%. The Fed’s preferred measure, Personal Consumption Expenditure (PCE) is back up to 2.6%, still higher than target.
The US jobs market remains surprisingly strong. The unemployment rate has risen to 4.2%, which is still relatively tight. Thus far we have seen little impact of Trump’s tariffs on trade, prices, inflation, or jobs. But it is early days yet.
Australian inflation, interest rates, unemployment
Australian inflation also remains problematic, but for different reasons. The RBA has only three rate cuts in this cycle (Feb, May, and the 3rd cut in August 2025), while most other countries have made several more cuts as inflation has edged down. (For example, there have been 8 rate cuts in Europe, 7 in Canada, 7 in NZ, 5 in UK,
Here is the Australian picture:

The 12-month CPI inflation rate is still rather high at 2.8%, and the annualised 3-month rate is down to 3.2%. The main problem areas are housing rents, electricity, gas, healthcare, tobacco, and education costs.
The RBA’s preferred ‘trimmed mean’ measure is high at 2.7%.
As in the case of the US, the most obvious motivation for a further series of rate cuts would be a local recession, which would lift unemployment and probably soften inflation pressures, allowing (or necessitating) rate cuts.
Unemployment in Australia has been rising slowly but steadily over the past year, from a low of 3.4% in late 2022, but is now back down to 4.2%. This is still relatively low rate, and the RBA regards this as inflationary as it is below the RBA’s non-inflationary rate of unemployment (‘NAIRU’) of around 4.5%.
‘Participation rates’ (the number of people in the workforce as a percentage of working age population) are at record highs, but this is almost entirely due to expansionary government-related hiring. The government sector has been expanding, but the real economy is doing it tough, with rate hikes eating into top-line revenues and raising financing costs.
Exchange Rates
The Aussie dollar rose 1.1% against the weaker USD in August but fell against most others.
The US dollar continues to slide against other currencies. For the year to date the US dollar is down 6% against the Yen, -7% against the Pound, -11% against the strong Euro. But the US dollar is down just -2% against the RMB, which is where it needs to fall most. Beijing is cunningly depressing the RMB almost tit for tat against the US dollar in order to maintain trade advantages, in the wake of Trump’s tariffs.
For the big picture on the strong US dollar and why Trump it trying to talk it down – see:
Commodities markets
Here is my chart of price changes in major commodities markets for the month of August (upper chart) and 2025 year to date (lower chart)
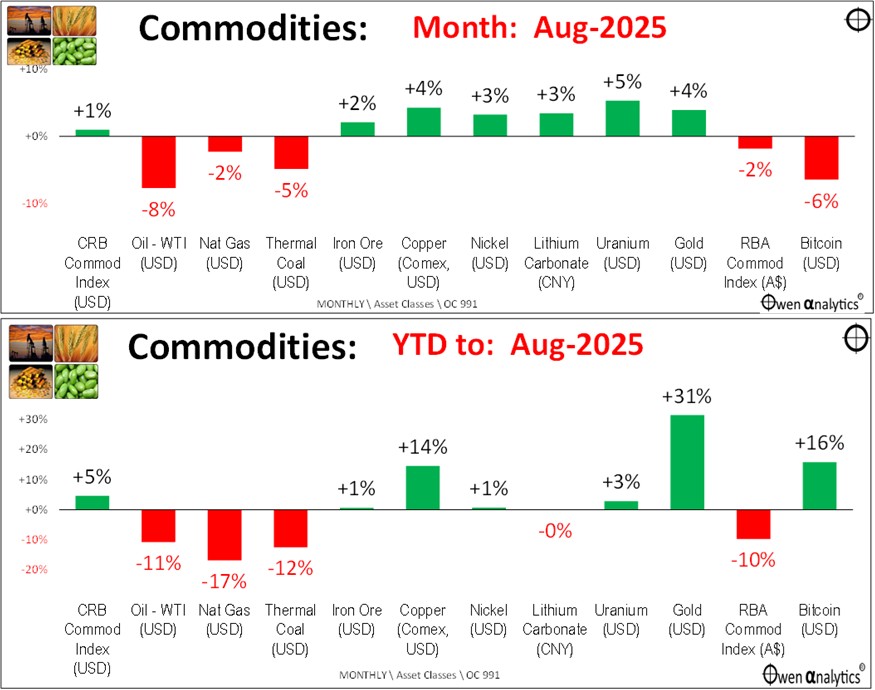
Fossil fuel prices fell back in August on weaker US and global demand. Industrial metals strongly on Chinese stimulus (Tibet dam + Shanghai housing rule boost), plus rising military spending, plus more mine closures (Lithium).
We are probably in the early stages of the next big commodities cycle, but currently most industrial commodities markets are suffering from weak prices due to weak global demand and over-production. Hence the very poor performance of Australia’s big miners weighing heavily on ASX returns in recent years.
Gold prices continued to rise on a fist-full of festering fears – including inflation, political unrest, military tensions, and general distrust in traditional financial institutions.
Bitcoin fell back a little after its strong rally this year due to Trump’s progressive shift to embrace the crypto-sphere, including the passage of the ‘Genius Act’.
However, Gold is still ahead this year (and is still the best performer in my own long-term ’10-4 All-weather ETF portfolio’).
Who knows what will unfold in September.
‘Till next time – safe investing!