Greetings fellow investors!
In a recent article I pointed out that the Australian share market has LAGGED the rest of the world for the past 17 YEARS since 2009, and this lag has ACCELERATED over the past three years in the ‘ai’ boom -
· Australian share market has LAGGED the rest of the world for the past 17 YEARS! Our ‘Home Bias’ is costing investors dearly (11-Aug-2026)
Total returns from international shares have beaten the ASX by an average 3.2% per year since 2009, and this has compounded into 65% greater total returns from international shares over the period. That is a big difference over a long period of relatively poor ASX returns.
It has not always been this way. The Australian and US share markets share the honours as the best performing markets in the world for more than a century, with both generating average annual real returns of 6.5% above inflation for domestic investors in each market.
Reasons for current ASX lag?
17 years is a long period of lagging returns (the second longest ASX lag in history). Is the current ASX lag temporary, or cyclical, or structural / permanent?
Will it ever catch up and regain top spot?
Will Aussie investors’ heavy ‘home bias’ ever be rewarded with a rebound to re-live past glories?
There is no one single explanation for the recent lag. It is a combination of several factors. This is the first of several articles setting out my findings as to the main reasons.
Reason 1: ASX Sector Mix
The first, very obvious observation is that the ASX has very much a ‘third world’ sector mix – mainly raw commodities and domestic banks.
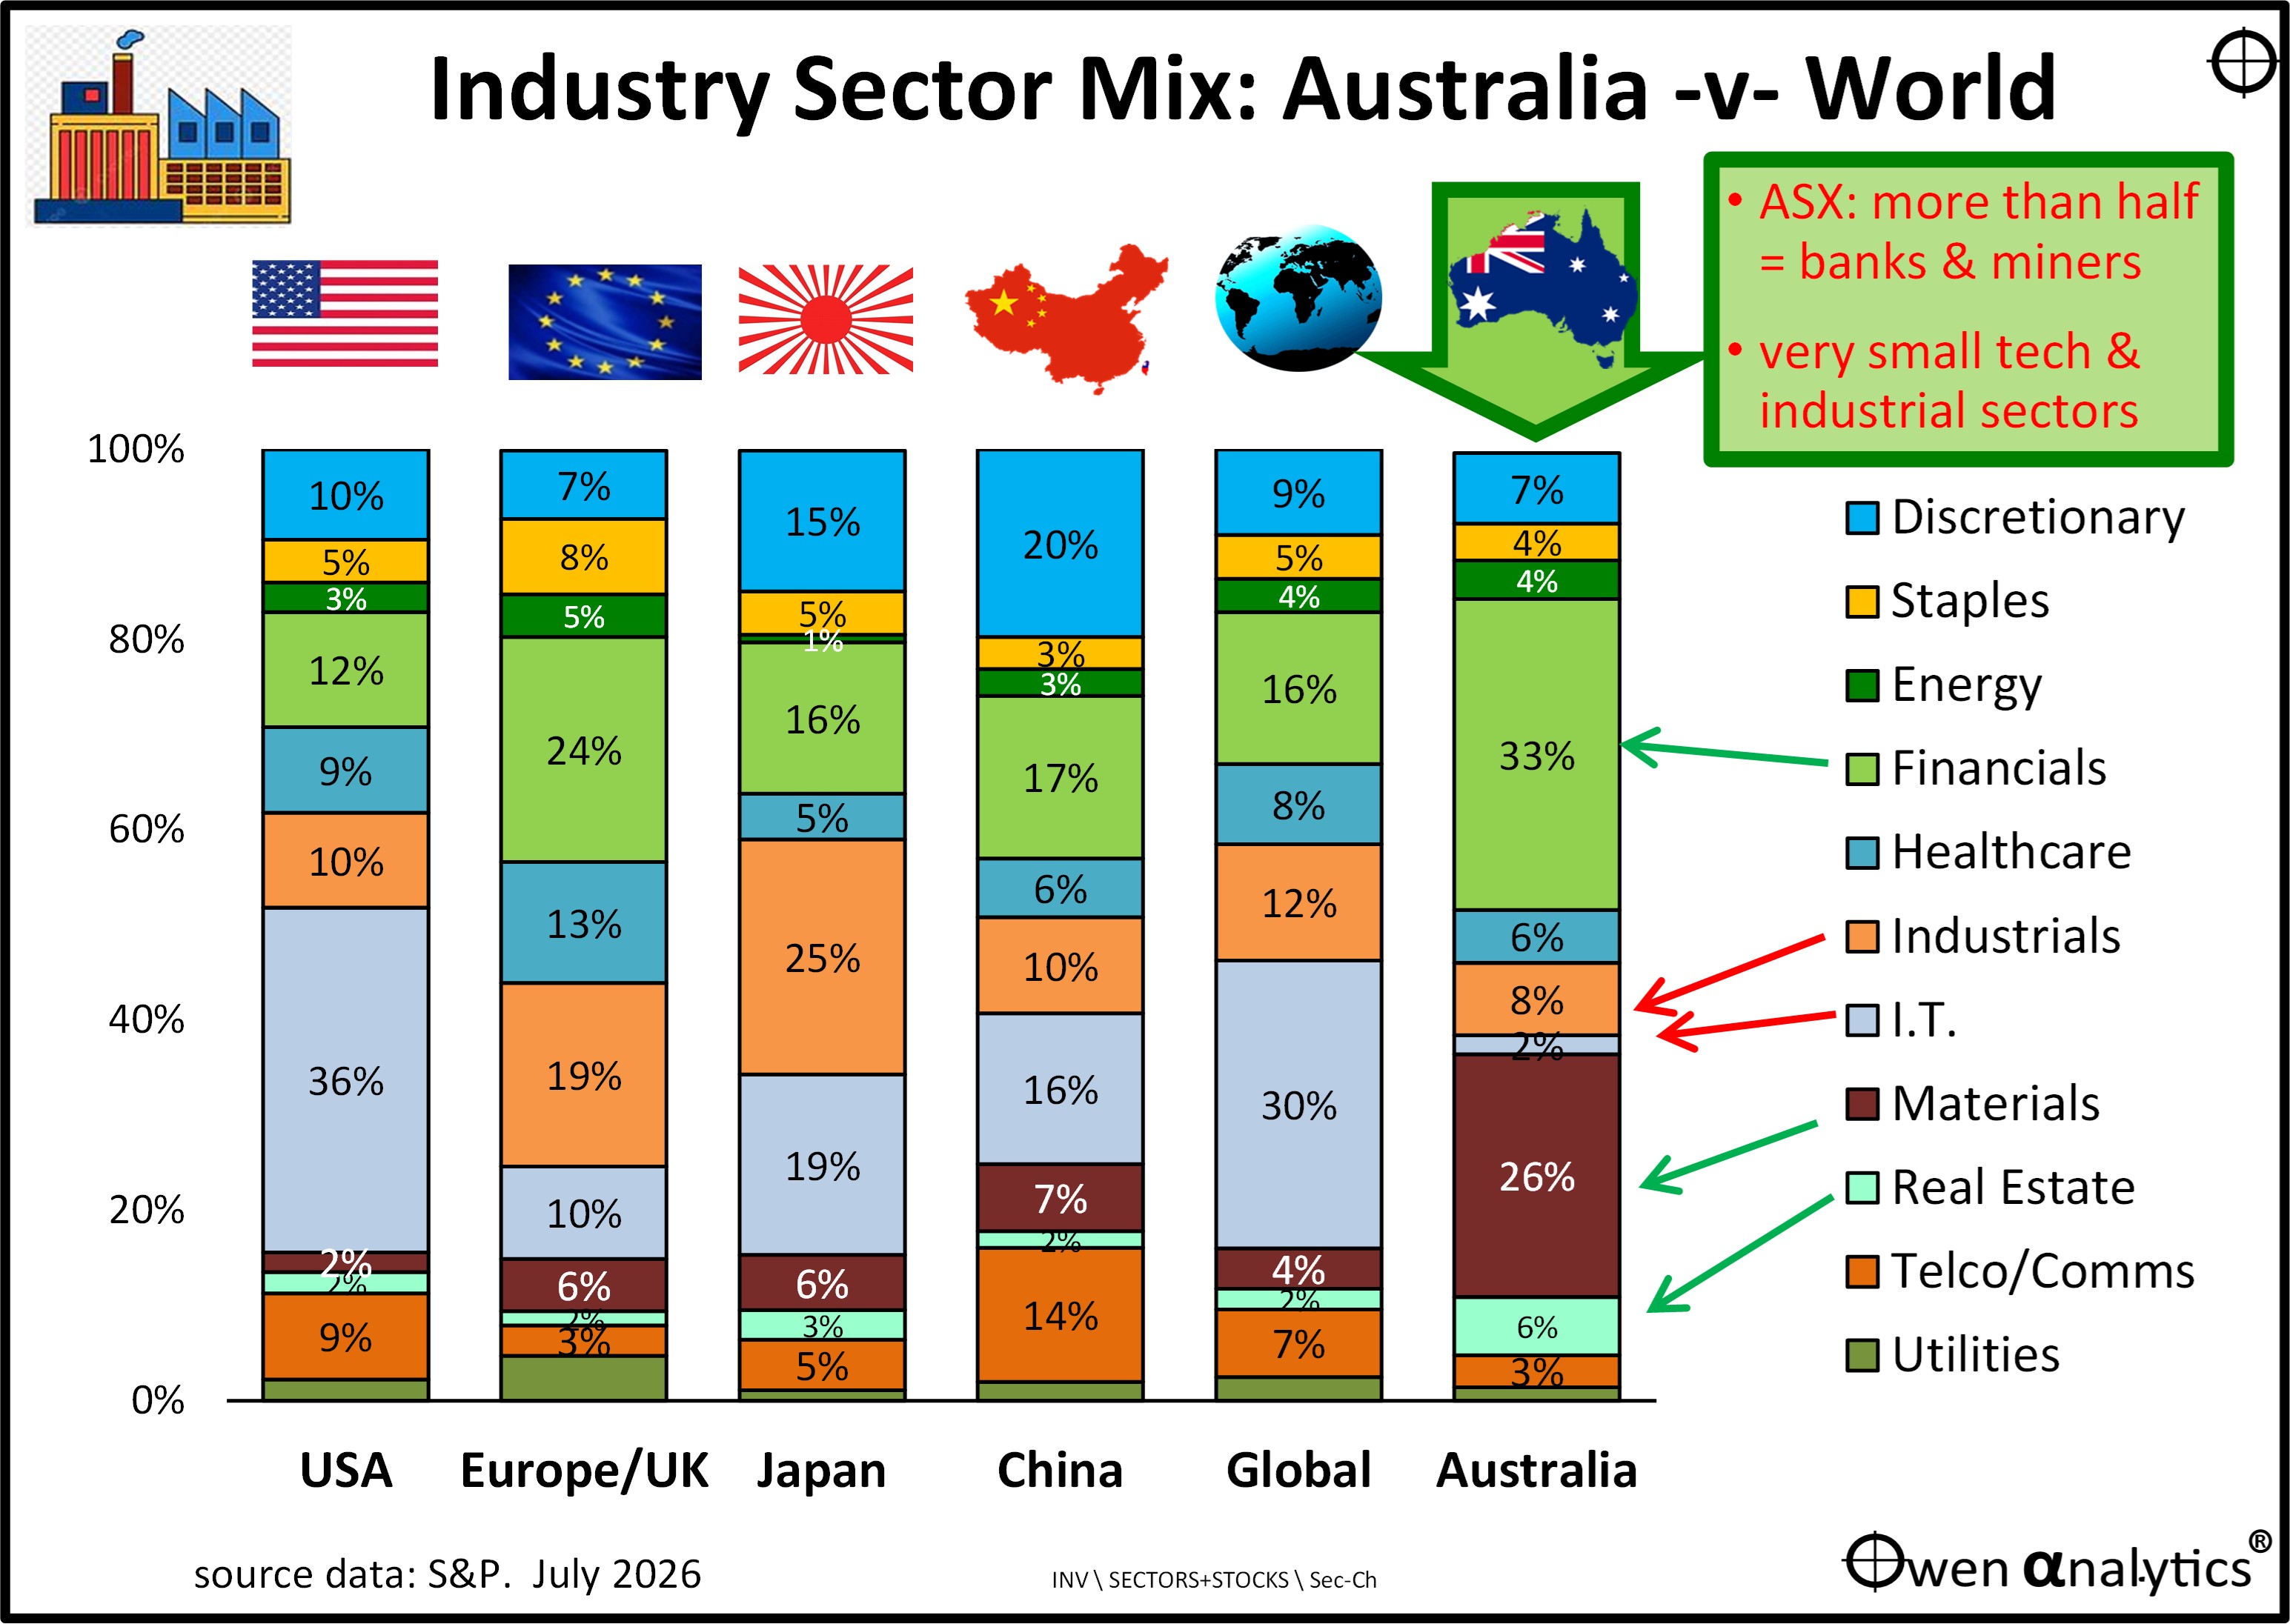
Today’s chart shows the industry sector mix of the Australian share market versus other major markets and the overall world mix. Data is at June 2026, using the following indexes:
· Australia: ASX300 index (300 companies)
· USA: S&P Composite 1500 (1,500 companies)
· Europe/UK: S&P Europe Benchmark Index (1,600 companies)
· Japan: S&P Japan Benchmark Index (1,700 companies)
· China: S&P China Benchmark Index (3,600 companies)
· Overall world (including ‘Developed’ and ‘Emerging’ markets): S&P Global Benchmark Index (15,400 companies)
Miners – undifferentiated raw commodities
-
-
- Virtually no value is added at our end - We just dig up rocks and ship them to other countries that magically transform them into finished products that we re-import at many thousands of times the price we got for the raw commodity inputs. (Or in the case of gas, we ship gas at low prices to Japan which makes a profit by re-selling its surplus at higher prices to Korea and Taiwan!)
-
-
- Commodities prices and volumes are controlled by foreigners. Because our commodities are undifferentiated, we are price-takers, not price-makers.
-
-
- Commodities prices are very cyclical, driven by changes in global demand & supply, both of which are beyond our control.
-
-
- Aussie miners are increasingly burdened by red / black / green tape delaying projects and adding to costs.
-
-
- Increasing costs of remediating environmental damage from mining operations.
-
-
- Mining requires decades-long supply cycles from first exploration to commercial production – requiring huge up-front investments and very long lead times to revenues.
-
-
- Miners have highly volatile share prices due to their high leverage (financial leverage in the form of debt, operational leverage from high fixed cost bases).
Banks – also problematic
-
-
- The local market is dominated by an oligopoly of 4 big banks, each offering virtually identical, undifferentiated products, with very little customer loyalty (in fact most people I know hate their banks with a vengeance, and only stick with them reluctantly because it is costly and time-consuming to switch banks, and they know that all banks are the same anyway).
-
- The big-4 have become little more than bloated building societies since they virtually abandoned commercial lending after the GFC and Hayne Royal Commission.
-
- The big-4 are heavily exposed to the domestic home loan market, with Australians carrying the highest housing debt per person in the world.
-
- The big legacy banks are burdened by dramatically escalating costs of compliance, reporting, remediation, fines and penalties for a litany of systemic failures, breaches, malfeasance, and straight-out illegal activities.
-
- They are also facing rapidly escalating costs of combatting hacks, cyber-crime and ‘ai’ bots.
-
- Each of the big-4 has ventured into all sorts of ill-fated and costly adventures – including disastrous overseas expansions, and domestic expansions into a host of related areas like insurances, funds management, financial advice – but all have retreated wounded, back to ‘core banking’.
-
- The problem with domestic ‘core banking’ is that each of the once-profitable core banking services of the legacy banks are facing existential threats:
-
-
-
-
-
-
- (a) Deposit-taking – new types of firms offering interest on deposits without the legacy costs and burdens;
-
-
-
-
-
-
- (b) Lending - now largely controlled by 3rd party loan originators/brokers who have the customer relationship, so lenders compete purely on price and are easy targets for fraudulent applications;
-
- (c) Payments – decline of cash, paper cheques, branches, ATMs, and growth of bankless payment systems, mostly foreign owned;
-
- (d) Foreign Exchange – there are now much cheaper & more convenient non-bank FX services.
-
-
- The main engine of Australia’s economic growth and bank profits has always been its high POPULATION GROWTH, which is mainly IMMIGRATION (Australia has had, since 1788 and still has today, the highest population growth rate outside of Africa), But that is now under threat from populist anti-immigration backlashes, which all political parties are being forced to adopt. With productivity stalled and birth rates still falling, lower levels of immigration mean lower economic growth and bank revenues.
Relatively large Real Estate sector
-
-
- This is an unusually large sector of the local market because the main driver of Australia’s economic growth has always been population growth – and this requires high rates of construction across a range of industry segments – residential, retail, commercial, industrial, etc.
-
- Each of the main sectors of the real estate market has structural problems (ie beyond mere cyclical swings):
-
-
-
-
-
- Residential - population growth via immigration under threat, rising costs of labour and materials, higher inflation and interest rates limiting buyers’ borrowing power;
-
- Retail (shopping centres) – physical shops are being ‘Amazoned’ and ‘Temu’d’;
-
- Commercial (offices) - badly affected by ‘work-from-home’ and ‘ai’ destroying office jobs;
-
- Tourist (hotels) – rising costs, inflation reducing discretionary spending and tourist numbers;
-
- Industrial (distribution warehouses) – being priced out by the new ‘ai’ data centre frenzy;
-
- Data centres – the latest fad du jure – over-investment frenzy.
-
Tiny Tech sector - most have big problems (internal / external)
-
-
-
- On the surface, this appears to be the main cause of the current lag behind the US market in particular
-
- The above chart shows that ‘Tech stocks make up 36% of the US Composite 1500 market value, but in reality, what we regard as ‘US tech’ makes up more than half the US market. While companies like Apple, Microsoft, Nvidia, Micron, Palantir are in the ‘Tech’ sector, other majors like Amazon and Tesla are in the ‘Consumer Discretionaries’ sector, and Meta/Facebook, Alphabet/Google, and Netflix are in ‘Telco/Communications’, as will SpaceX.
-
- In contrast, the ASX has very little in the way of ‘tech’ companies – less than 2% of the ASX300 market value.
-
- In addition, most of those Aussie ‘tech’ companies have big problems. Some are beset by internal problems (eg CEO problems, overly aggressive overseas expansion, etc). Others have external problems (new forms of competition, threats from ai, etc).
-
- Likewise for most of the main companies in our Health Care sector – from CSL down.
-
- The heavy ‘Tech’ weighting of the US market is the main reason for the US (and therefore global) market beating Australia, but it is also the reason the local Australian market will hold up better when (not if) the current US/global tech boom collapses, just as it did in the 2000-2 ‘tech wreck’ after the late 1990s speculative tech boom, and it also held up better in the 1929-32 crash after the 1920s speculative boom.
‘Industrials’ not actually industrial at all
-
-
-
- The ‘Industrials’ sector in other advanced markets like the US, Japan and Europe comprises companies that make things (cars, airplanes, machines, appliances, etc).
-
- In years long gone, Australian companies did once make things (and even exported manufactured goods, mainly to South Pacific neighbours), but that was only behind high protection barriers from the early 1900s to the 1980s. Alas, when the protection barriers were removed in the 1990s, the heavily protected and subsidised local manufacturers could not compte with imports at much lower prices and greater variety and quality, so local manufacturing virtually disappeared.
-
- Consequently, our ‘industrials’ sector now consists mainly of companies that just move things and people around our vast country – roads, freeways, airlines, railways, ports, etc
-
- Because of our tiny population and vast distances, most ‘Industrial’ (ie transport) companies operate as monopolies or oligopolies, and therefore have little incentive to innovate or improve, face heavy compliance costs and/or price controls, and have run out of space to grow (unless they pursue risky, costly, and usually disastrous overseas expansion).
BUT – our Banks/Miners sector mix not always a problem
The sector mix of banks/miners is just one reason for the recent ASX under-performance. BUT . . . . Australian share markets have always been dominated by banks/miners - since 1817 (Westpac/ BNSW shares first started changing hands), copper mining shares in dusty SA mining towns in the 1840s, gold mining shares on the goldfields in the 1850s, silver-lead mines in the 1880s, tin and gold mines in the 1890s, and so on through a seemingly endless succession of mining booms.
Here is a chart of ASX industry mix over the past century, showing that banks and miners have almost always comprised more than half (and sometimes two-thirds) of the total value of listed companies -
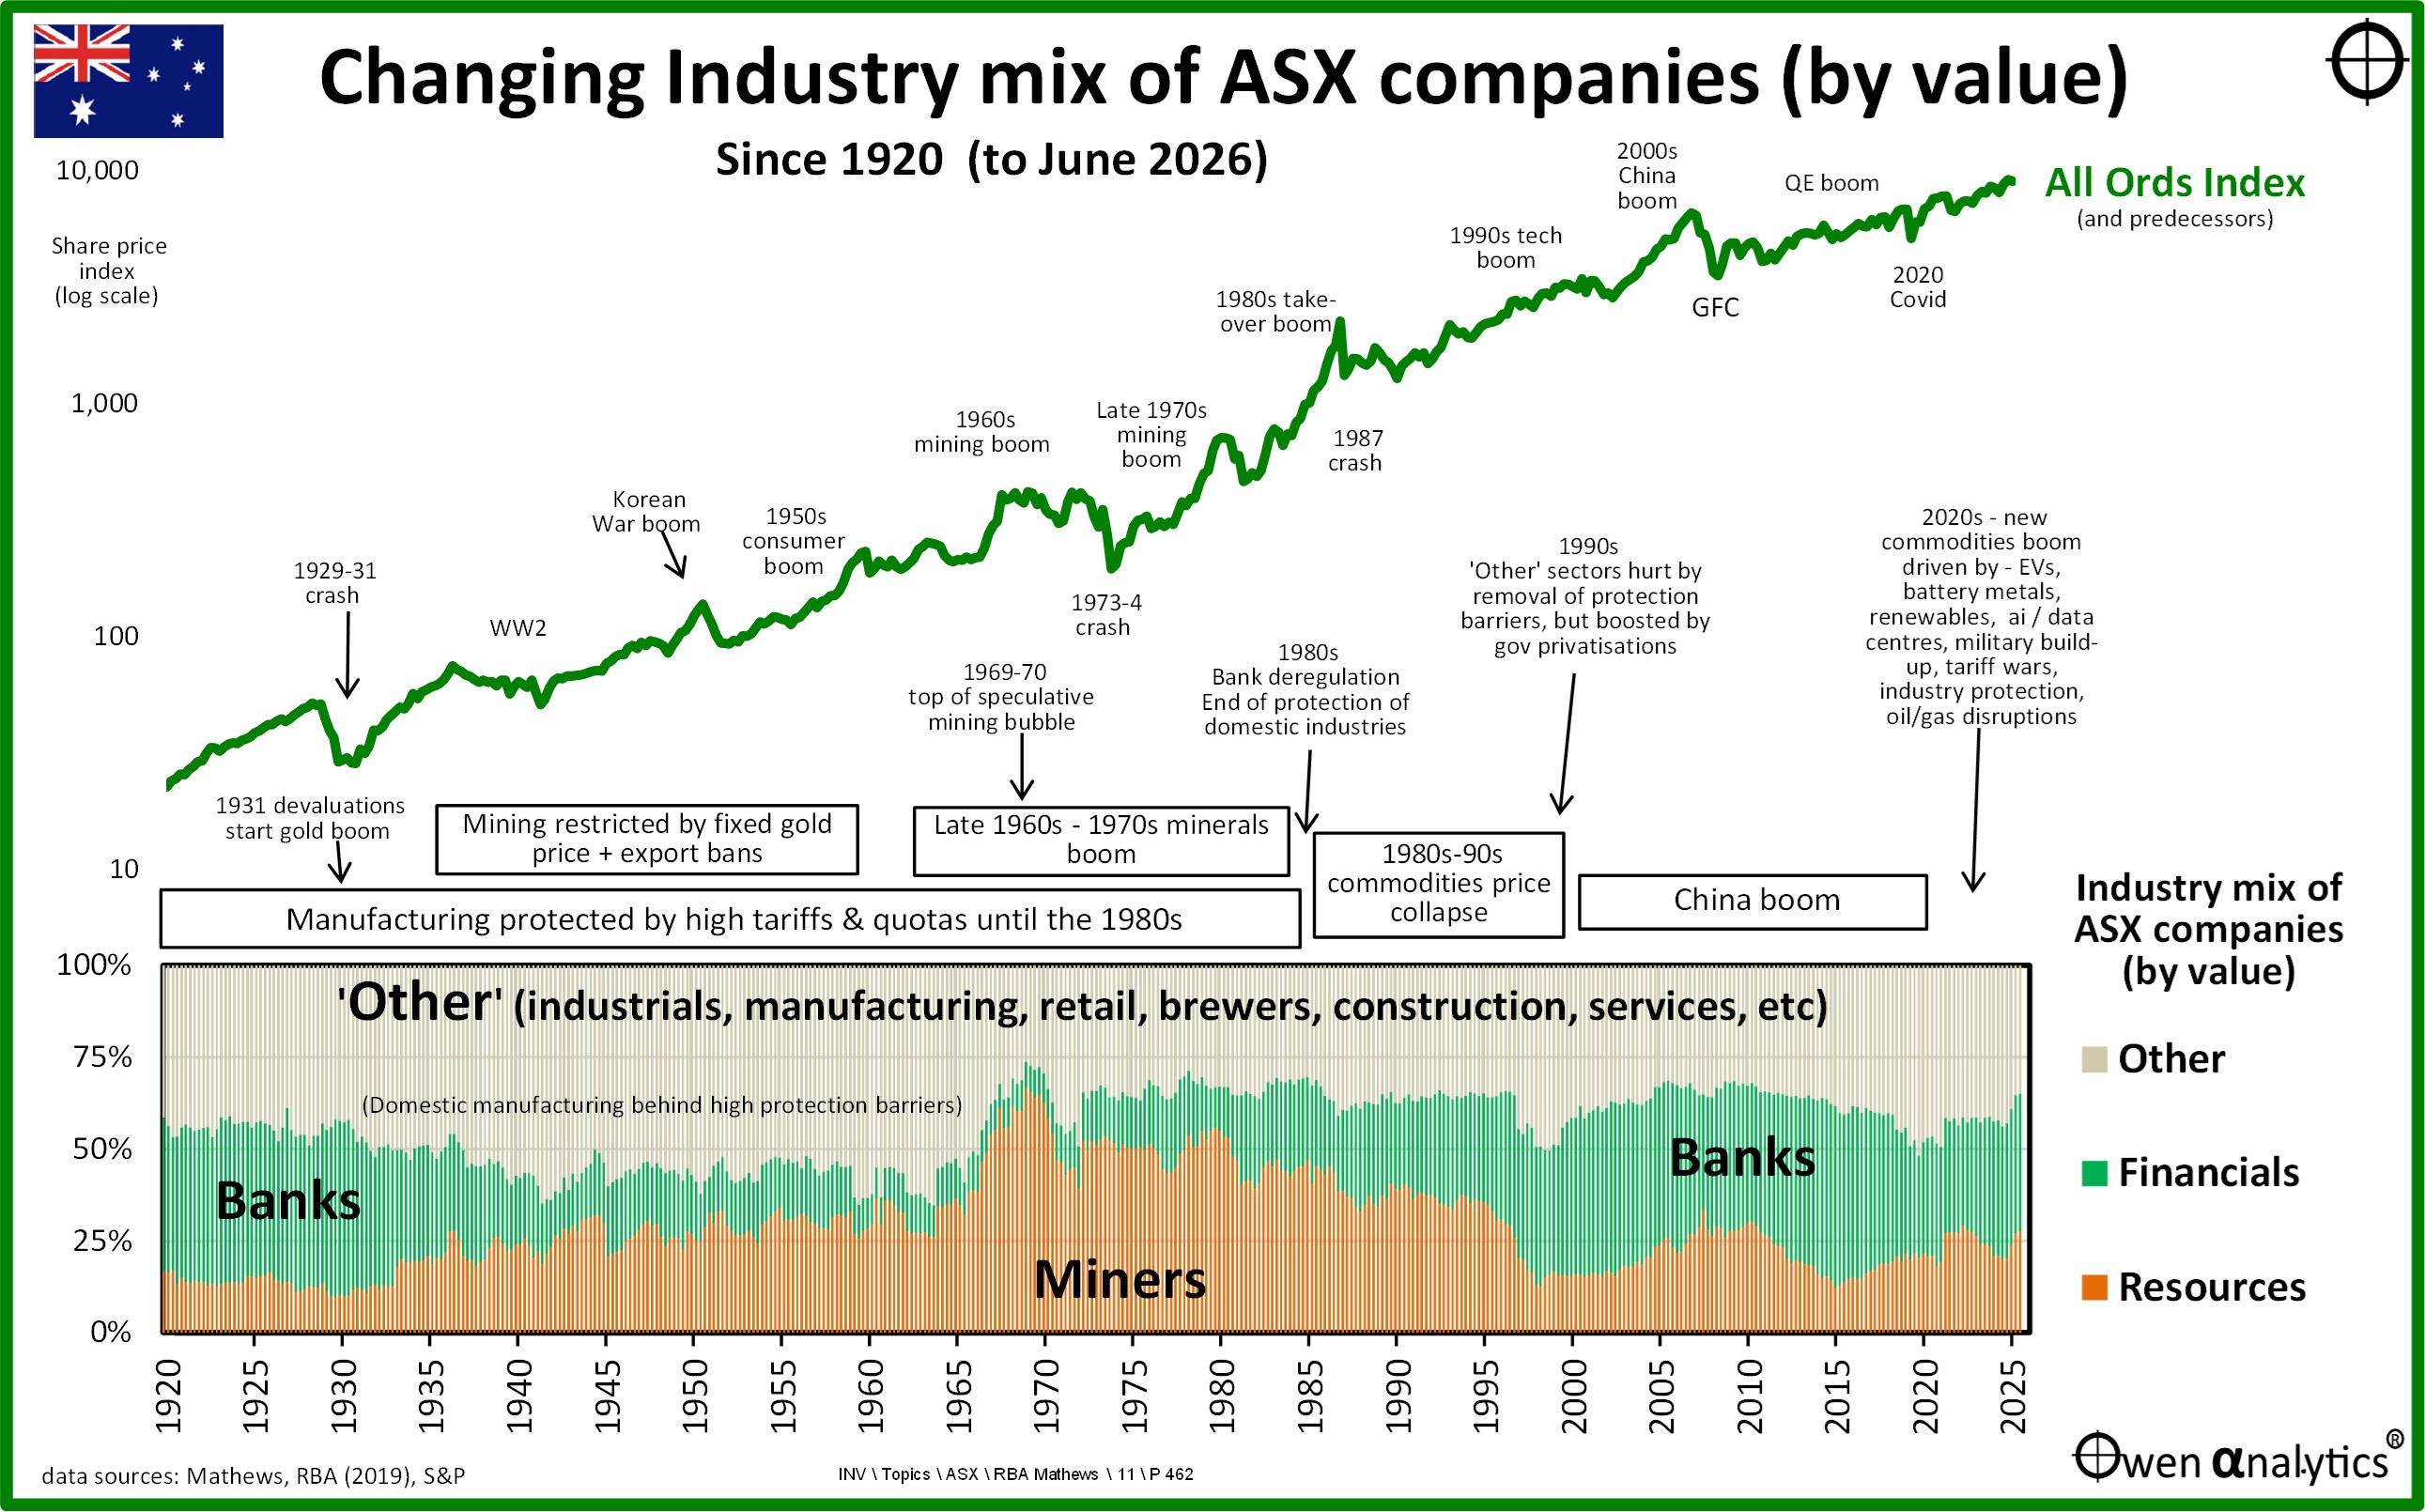
The only occasions when banks & miners dropped below half of total market value was in the 1940s to mid-1960s when domestic manufacturing operated behind high protection barriers. When protection barriers were removed 1980s reforms, almost all domestic manufacturing disappeared. (A large portion of the ‘Other’ was BHP, which was primarily a steel maker from 1915 up until it stuck oil in Bass Strait in 1965 and bought Utah in 1984). Meanwhile, other large sectors, like the brewers, were taken over by foreign companies.
However, despite (or perhaps because of) the on-going dominance of banks and miners, the Australian share market has still been the BEST market in the world alongside USA over the long-long term (century plus).
Therefore there must be other factors behind our 17-year lag. I will outline each of these in up-coming articles.
Stay tuned!
‘Till next time – happy investing and stay healthy!