Greetings fellow investors!
In a recent article I pointed out that the Australian share market has LAGGED the rest of the world for the past 17 YEARS since 2009, and this lag has ACCELERATED over the past three years in the ‘ai’ boom -
· Australian share market has LAGGED the rest of the world for the past 17 YEARS! Our ‘Home Bias’ is costing investors dearly (11-Aug-2026)
It has not always been this way. The Australian and US share markets have been the best performing markets in the world for more than a century, with both generating average annual real returns of 6.5% above inflation for domestic investors in each market.
However, total returns from the ASX market have lagged international shares by an average 3.2% per year since 2009 (and have lagged the US market by even more), and this has compounded into 65% greater total returns from international shares over the period. That is a big difference over a long period of relatively poor ASX returns.
I undertook to outline the various reasons for the lag in follow-up articles
Reason #1 was the Sector Mix –
· Reason 1 for the ASX’s 17-year lag behind global share market: SECTOR MIX (17-Aug-2026)
Reason #2 (today’s article) is chronically low Returns on Equity from the ASX companies
Reason #2: Lower Returns on Equity
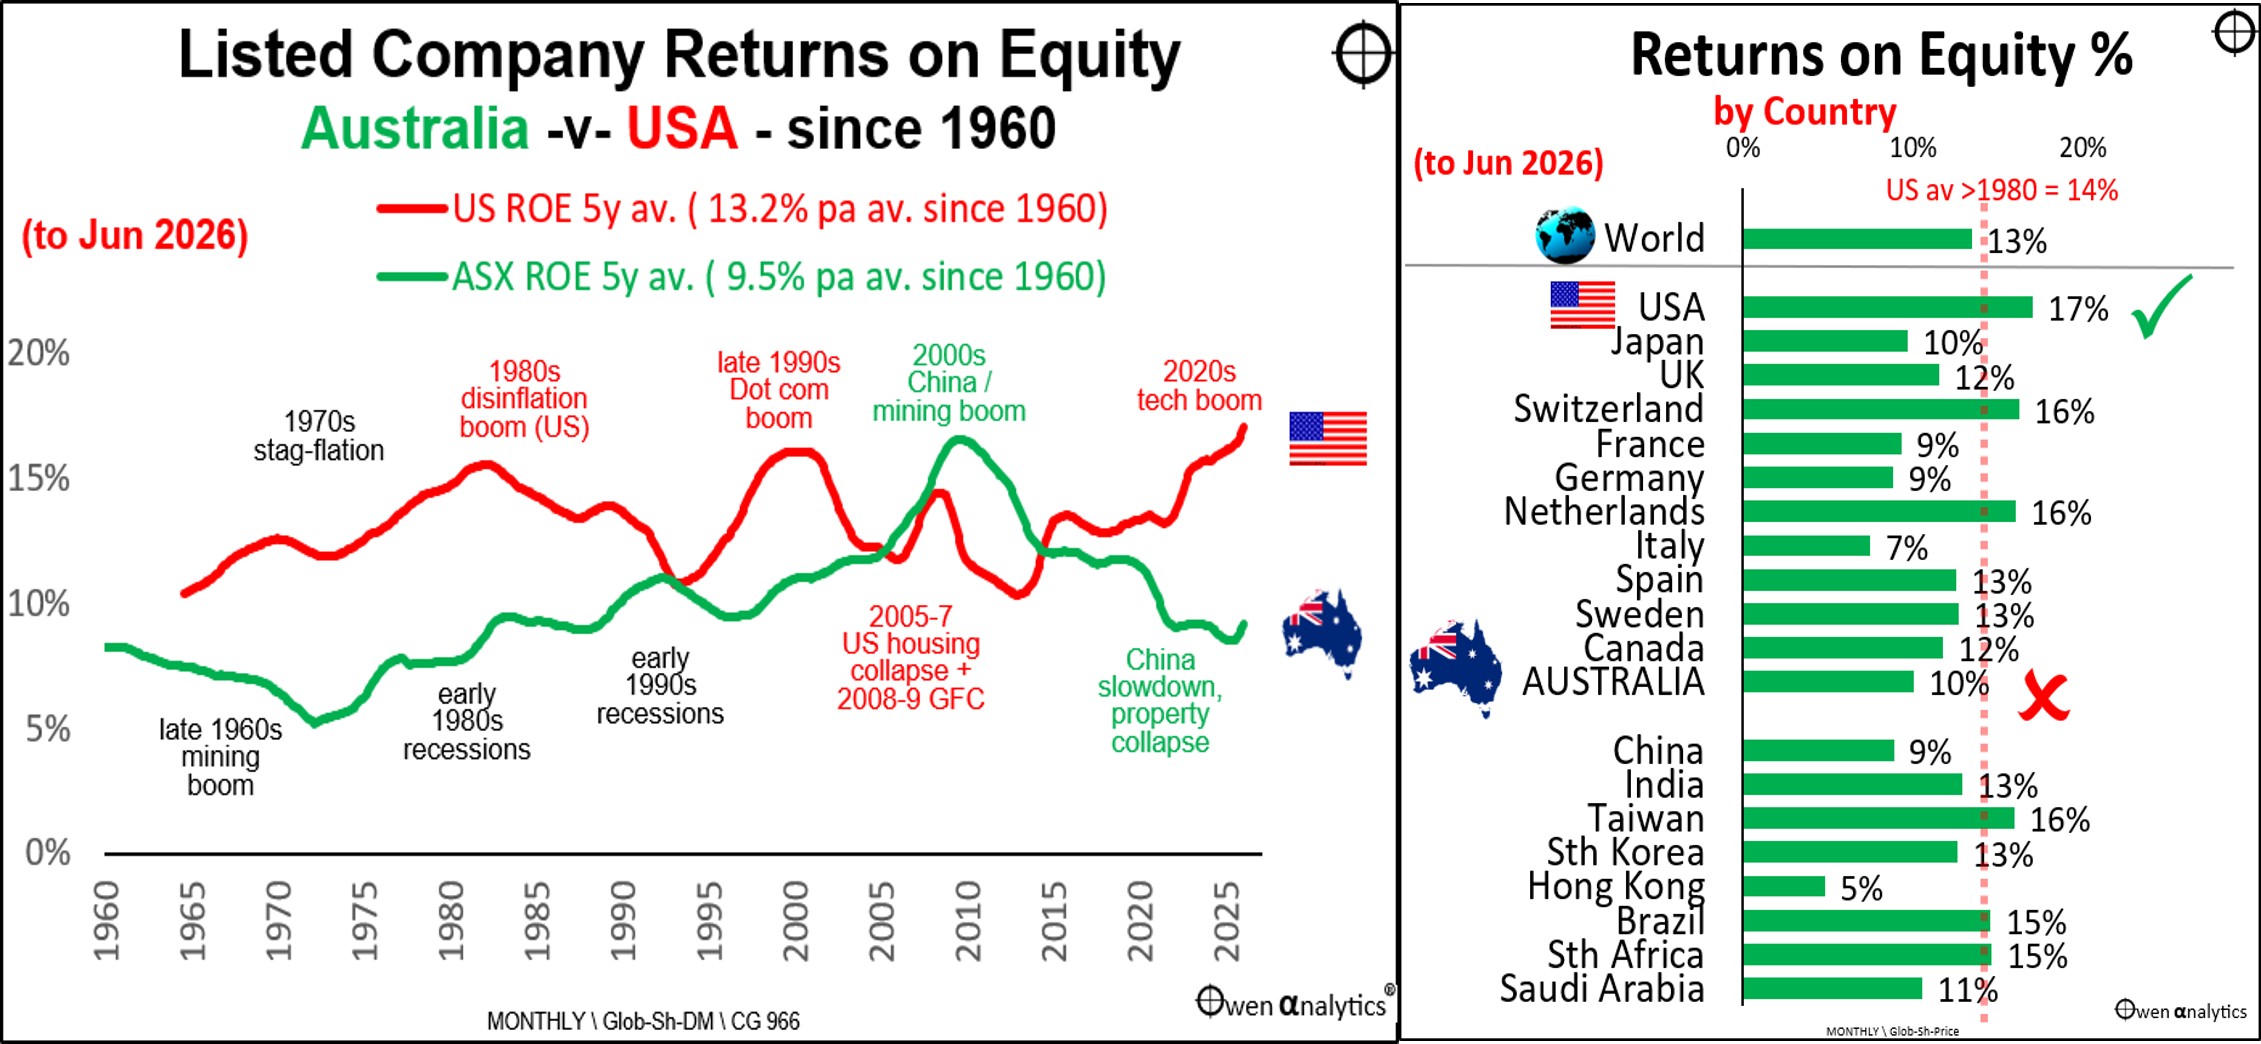
Today’s charts highlight Australia’s relatively poor returns on equity from listed companies. (Return on equity is calculated as after-tax profits divided by average shareholder ordinary (common) equity, aggregated across the market index.)
The right chart shows the current running rate of returns on equity in Australia compared to the major world share markets (to June 2026).
The US is the stand-out market with the highest ROEs. Despite unprecedented levels of capex spending on ‘ai’ infrastructure (LL models, chips, data centres), the overall US market is still extraordinarily profitable. US returns on equity are still the best in the world, and are well above the US average 14% ROE since 1980 (red dotted line on right chart).
Australia is near the bottom on ROE, beating only China (property/construction collapse), Hong Kong (ditto), as well as France, Germany and Italy (European regulatory, compliance & structural headwinds).
Persistently lower ROE over time
The left chart shows ROEs for the Australian share market (All Ords and predecessors, green) versus the USA (S&P500 index, red) since 1960. Here I have used rolling 5-year average ROEs in order to smooth out short-term anomalies and one-off effects like tax cuts etc.
Here we see that aggregate market-wide ROE in Australia has been significantly LOWER than in US ROEs. The only exception was one brief period from the mid-2000s to mid-2010s.This was the great China urbanisation / industrialisation / export / commodities boom, which ran up to the 2008-9 GFC, then continued with China’s GFC stimulus re-boot, peaking in 2011 and ending with the Chinese slowdown and commodities collapse in 2014-5.
Australian aggregate listed company ROEs have averaged nearly 4% LOWER than US ROEs, which is a very large difference between the two markets. Average US ROE at 13% is higher than the cost of capital, so most US companies retain their profits to re-invest in future growth, resulting in progressively higher profits and dividends over time.
Low ROE means low earnings retention and lower future growth
In stark contrast, Australian ROEs averaged just 9.5% over 60 years, which is BELOW the average cost of equity capital (around 10%-11%). This a serious, entrenched problem.
Because most Australian companies fail to even earn back the cost of capital, Australian shareholders have always demanded that companies return the bulk of their meagre profits as dividends, rather than let management squander it on even more sub-economic ventures.
This low earnings retention rate (ie high dividend pay-out rate and high dividend yields is a damning indictment of the poor quality of Australian management almost across the board.
Any company that consistently fails to generate returns on equity equal to or greater than the cost of equity capital is destroying shareholder value for no reason. The directors, as fiduciaries for shareholders’ capital, should cease destroying shareholder value, close down the company, and hand what is left of shareholder capital back to its shareholders so they can re-deploy it more profitably elsewhere. Simple as that.
Low returns due to temporary or cyclical setbacks is fine, but chronic sub-par returns on equity year after year, and decade after decade are unforgivable.
Aussie investors celebrate Australia’s high dividend yields, but high dividend yields (ie low profit retention rates) are a result of (and a sign of) poor management and their chronic inability to earn back the cost of the capital with which they are entrusted.
Mining / commodities booms not always profitable
Note that Australia enjoyed not one but two huge mining booms during this period. The first was in the late 1960s (mainly nickel and oil). The second was in the early 2000s (China, iron ore, base metals).
The early 2000s China boom was enormously profitable as illustrated on the chart.
However, the late 1960s mining boom was mostly a profitless, speculative bubble (much like the late-1990s dot-com boom in the US).
For details of Australia’s late-1960s nickel boom see –
· Case Study: 1969-70 Nickel boom & bust – ‘Poseidon’ (13-Mar-2024)
Monopolies and Oligopolies should reap high returns
The chronically poor returns from Australian listed companies is surprising given the virtual monopoly or oligopoly structure of most large domestic industries.
Monopoly/oligopoly pricing power – which includes power over suppliers, competitors, customers, as well as influence over mainly captive regulators, and lobbying power over politicians - should ordinarily result in high profitability. However management on the whole has been unable to translate monopoly/oligopoly pricing power into superior margins and profits.
Reasons for poor returns from Aussie companies?
The obvious and immediate answer is poor management (by definition), which is a result of Australian investors’ persistent tolerance of poor management.
It is worth noting that Australian listed companies have the second highest paid CEOs in the world (after the US). It was a trend started in the 1980s when many of our local companies started importing second-rate CEOs from the US with outlandishly high pay, but mostly poor results (Bob Joss at Westpac being the stand-out exception to this rule).
Shareholders, institutional shareholders in particular, are to blame for continually approving ridiculously high pay packets for our mostly mediocre CEOs.
There are other contributory reasons as well – including higher interest rates, higher corporate tax rates, lower re-investment rates, resulting in lower spending on R&D and investment in productivity enhancing / cost-saving technologies / innovations. Most of our big companies have been doing the same things in the same markets for a century or more (eg domestic banking, digging holes in the ground, etc).
Temporary, cyclical or more long-lasting?
Unfortunately, most or all of the suggested reasons for lower ROEs seems to be persistent / structural – ie not merely temporary or cyclical.
I will outline other reasons for the current ASX under-performance in upcoming articles
Stay tuned!
‘Till next time – happy investing and stay healthy!