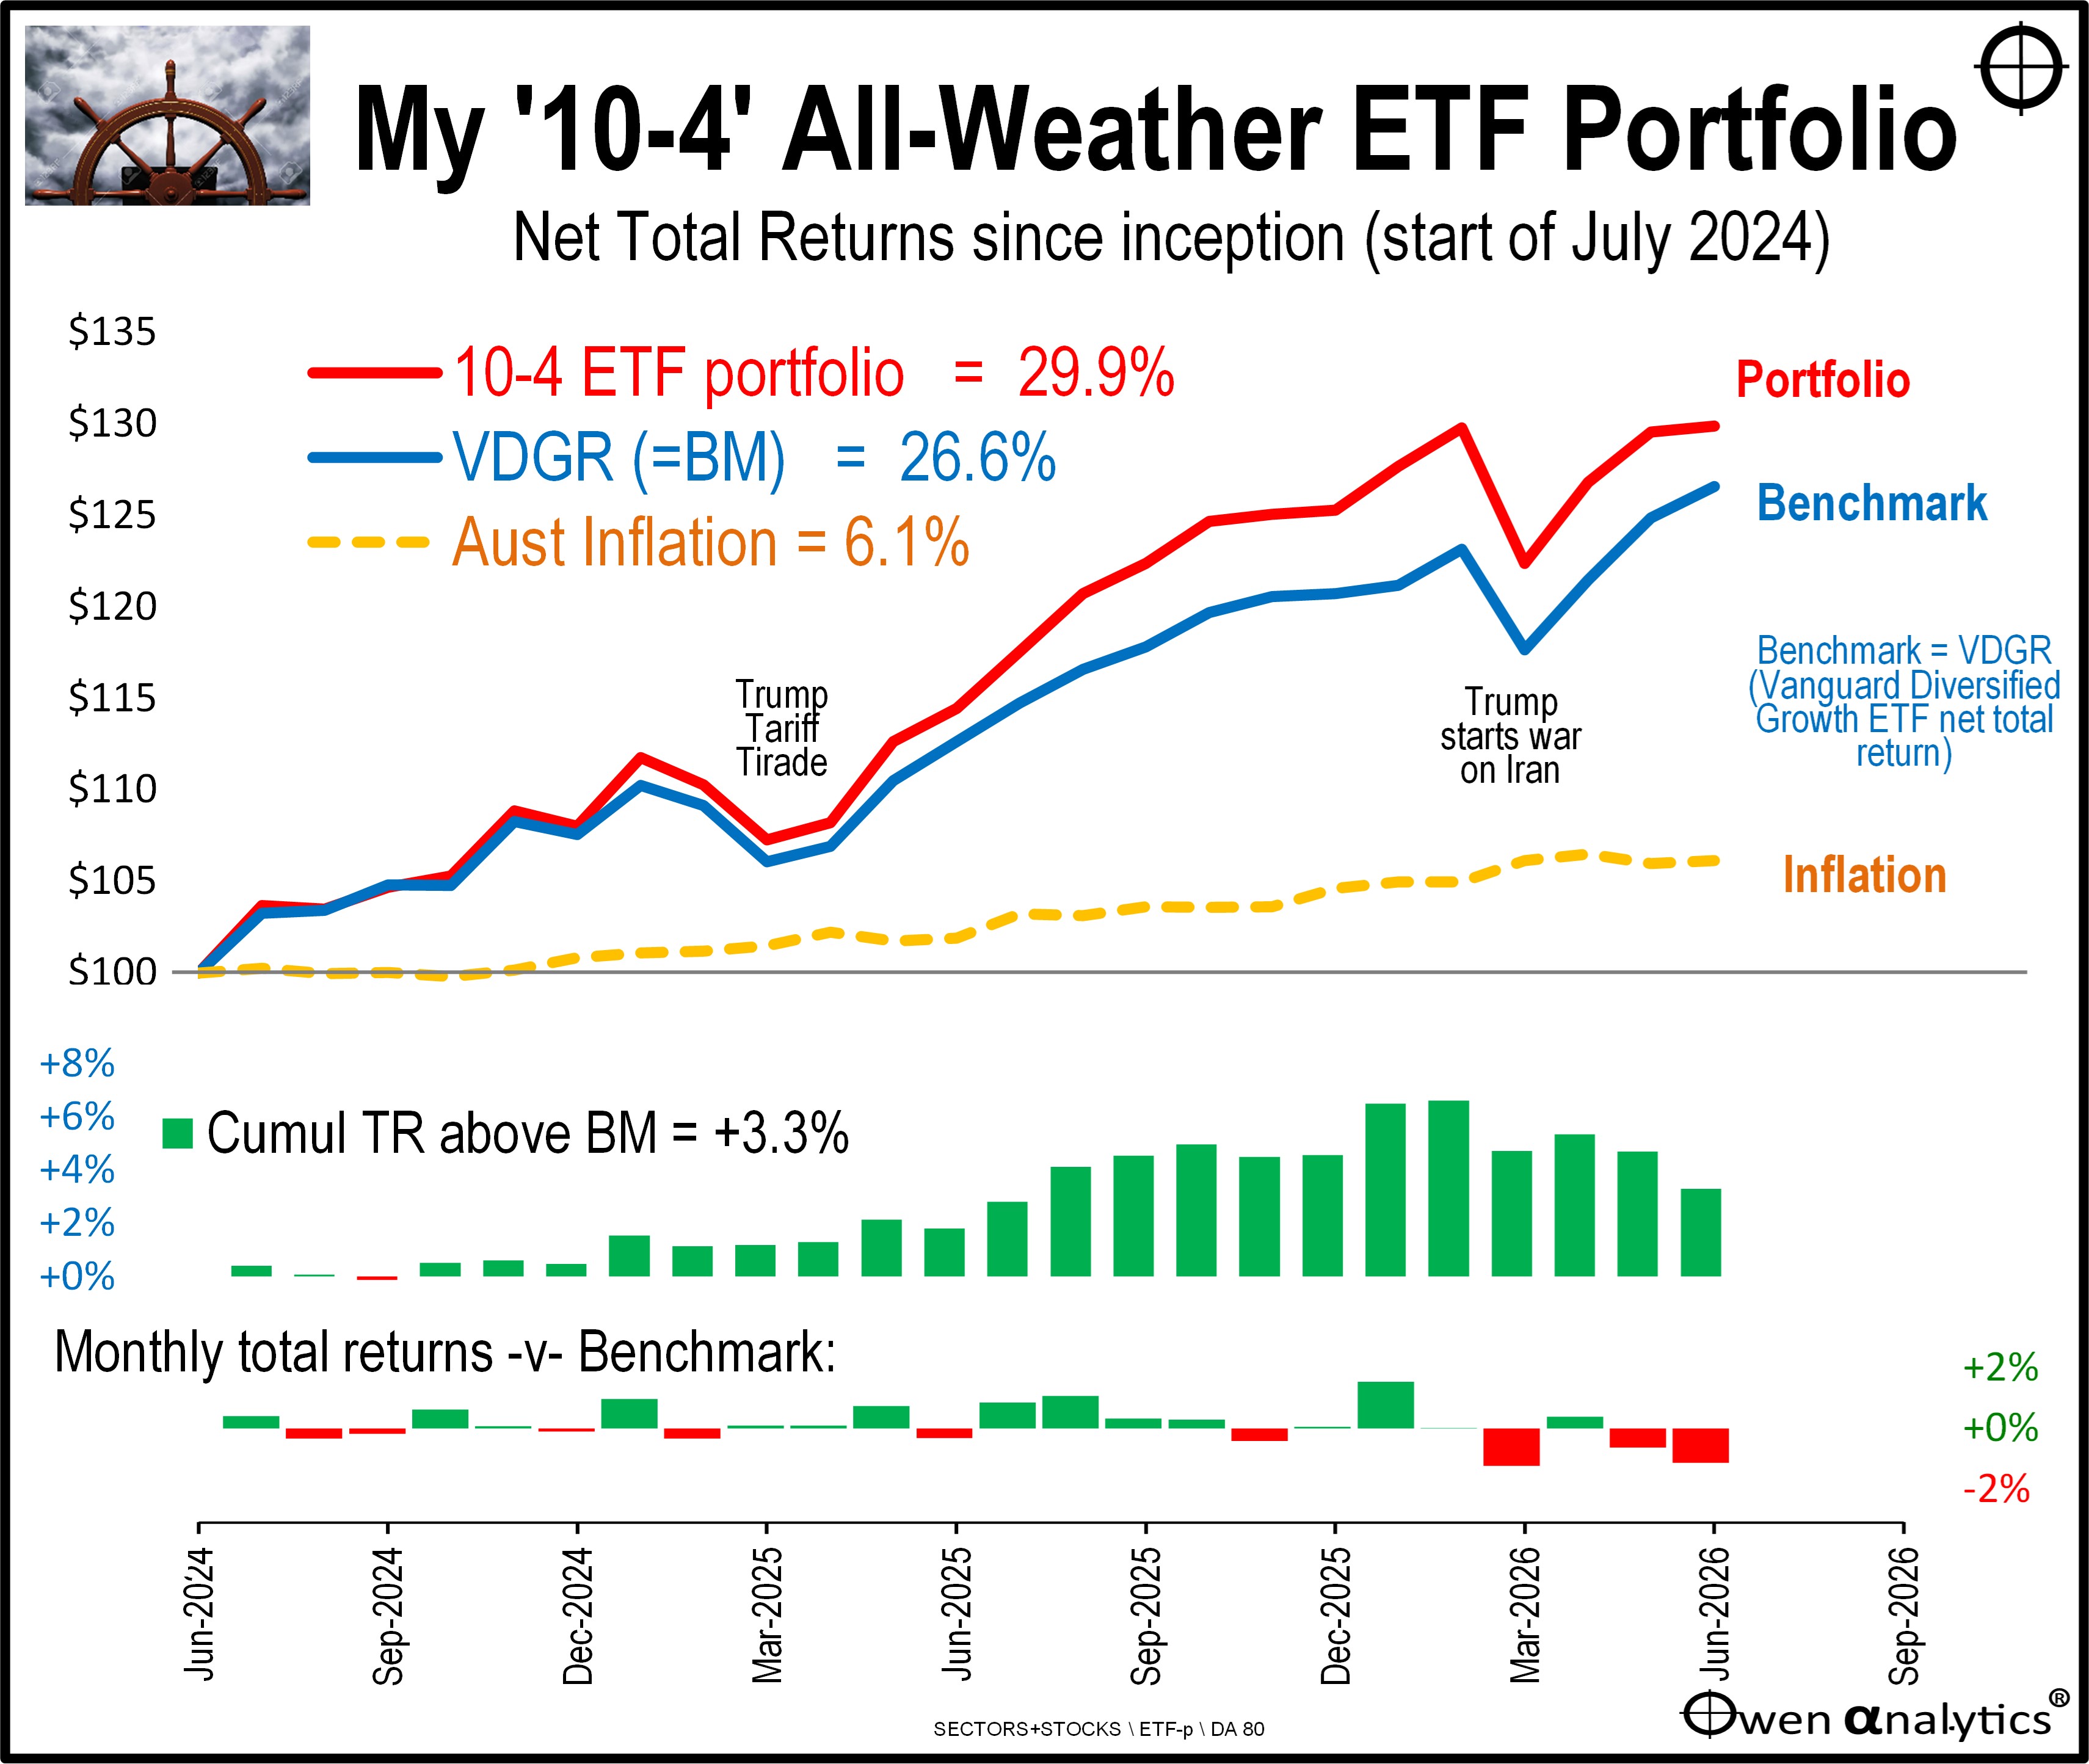
This is a report on my ’10-4 all-weather ETF portfolio’ for the 24 months since I set it up in June 2024.
I have been running diversified ETF portfolios for my own money and for financial advice firms, and writing about it, since the early 2000s. (My first two books were about how to use ETFs to achieve long-term wealth and income goals)
There are certainly many more ETFs available now (in fact far too many!) compared to the very narrow set on the market 20 years ago (and the fees are much lower now), but the principles are essentially the same.
I have used the same techniques, strategies, and many of the same ETFs in portfolios of all sizes over the years, from a thousand dollars for kids and grandkids, to several billion dollars in discretionary accounts for major advisory groups I have managed and run over two decades.
I set up this ‘10-4 all-weather ETF portfolio’ in June 2024 and put $1m of my own cash into it to show that when I talk and write about ETFs and portfolio management, it is not just uninformed idle chatter from inexperienced ‘wannabees’ like 99% of the content on LinkedIn and other online channels. I ‘put my money where my mouth is’ with a non-trivial amount of cash to demonstrate how it works in real life with real money. (But anyone can do it with the same ETFs starting with a couple of thousand dollars.)
Here are two background articles explaining why and how I set up the ‘10-4’ ETF portfolio in June 2024:
Portfolio purpose and goals
As I explained when I set up the portfolio, it was deliberately designed to be a low-maintenance, ‘all-weather’ portfolio that would just keep doing its job over the medium-long term regardless of what happens in the world.
It was designed so that I can ignore it for long periods and still be reasonably confident that it will just do its job, ignoring all the day-to-day noise like Trump, tariffs, wars, political upheavals, energy shocks, changes in economic conditions like inflation, interest rates, recessions, booms/busts, and also ignoring the endless parade of ‘hot’ IPOs, and ‘hot’ investment fashions and fads like ‘renewables’, ‘battery tech’, ‘EVs’, ‘ai’, ‘robotics’, or the current fad du jour - ‘space’.
The ‘10-4’ refers to the fact that the long-term average net total return goal is 10% per year, and the average income goal is 4% (based on the ‘4% rule’, so I can draw down capital if/when I need in future).
It turns out that I have been rather busy over the past couple of years – first dealing with my mother’s accelerating dementia, getting her into and out of 4 dementia homes plus numerous falls/breaks and ER trips, then dealing with her funeral and probate (as the only immediate family member in Sydney). Plus over the past year I have also been rather busy with my own challenges with cancer surgery and chemotherapy (which I am still on).
Warren Buffett once commented:
‘Lethargy, bordering on sloth’ remains the cornerstone of our investment style.’ (Newsweek May 1991).
And:
‘The stock market serves as a relocation centre at which money is moved from the active to the patient.’ (in his 1991 Letter to Berkshire Hathaway shareholders)
His point is that frantically chasing fads and hot new IPOs, and/or constant fiddling with allocations inevitably destroys wealth.
I have been rather lethargic / lazy / busy in the past couple of years and I just left the portfolio alone (and other portfolios of mine), rarely looking at how they were going (apart from annual tax return time).
What’s in it?
The same ETFS as when I set it up. I have not fiddled with it or changed any allocations. I have not even re-balanced their weights back to their target weights (I cover this later below).
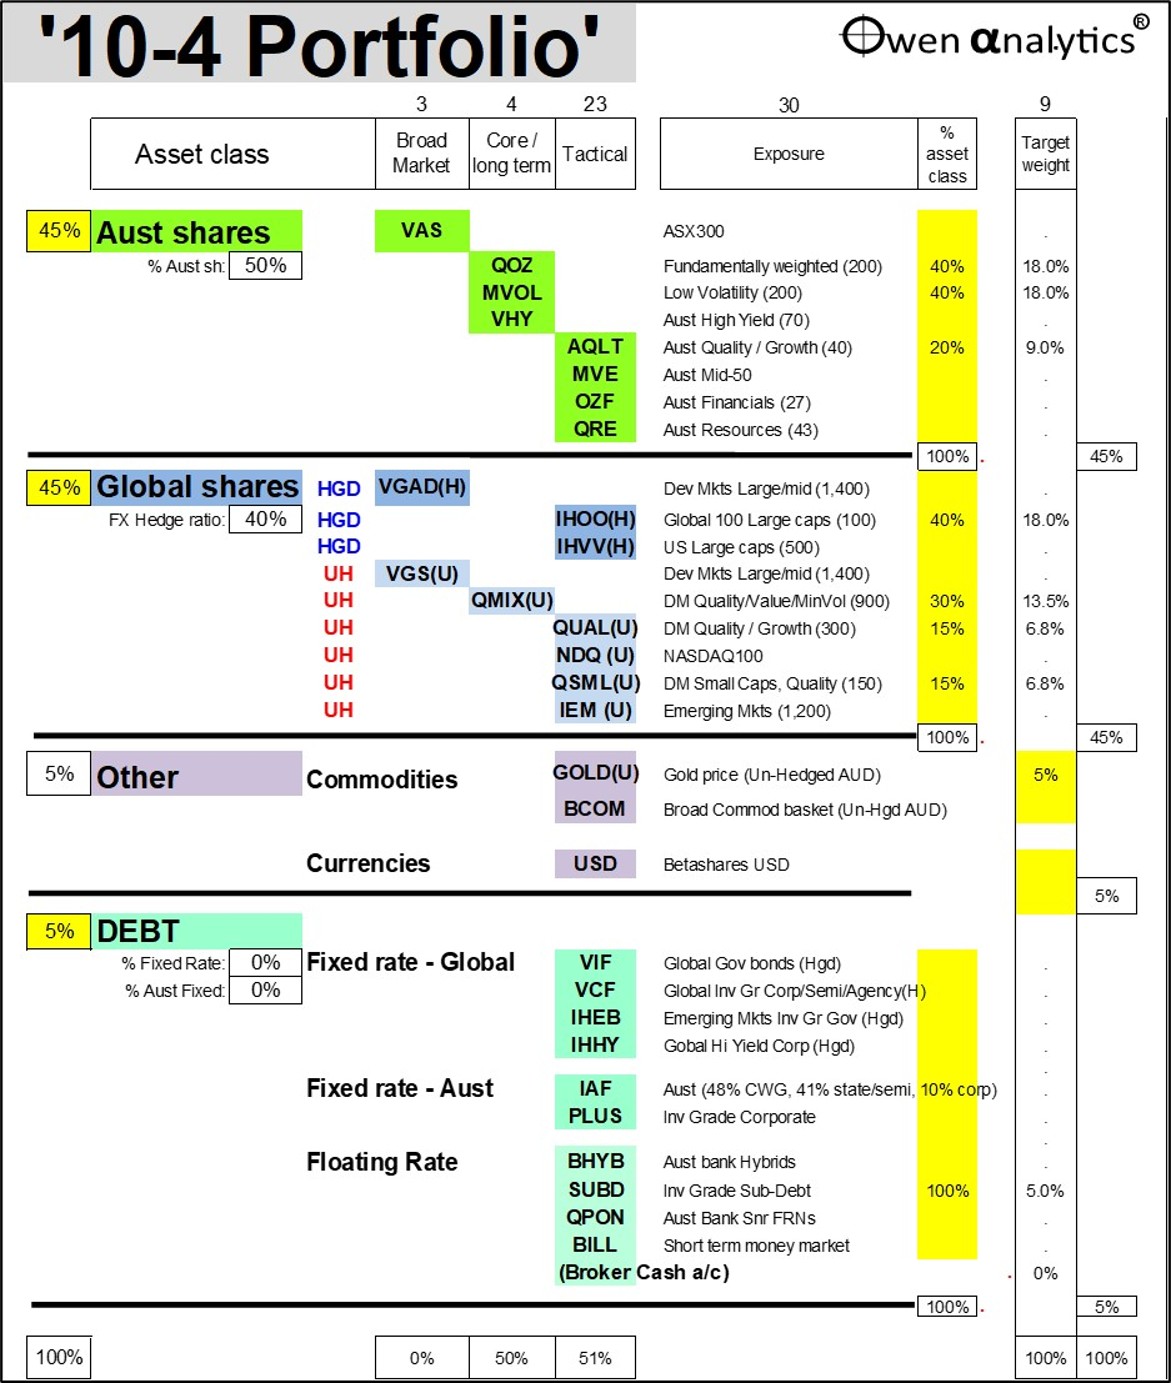
I have a couple of dozen ETFs ‘in the squad’ (ETFs I approved for use in this portfolio) – which I classify as either ‘Broad market’, Core / long-term’, or ‘Tactical’ ETFs.
Of the ETFs in the approved squad, nine are in the portfolio (in the game). The second article above outlines the rationale for each ETF in the squad and each ETF selected in the game.
Here are the ETFs with their portfolio weights (this is from the second article above):
Returns
The portfolio beat its benchmark (VDGR: Vanguard Diversified Growth ETF) by 3.3%, over the two years and beat almost all ‘Big Super’ funds by even more in both years. (Most Big Super funds failed even to match the passive benchmark VDGR ETF!)
Median Big Super returns for Growth/Balanced funds was10.4% in 2024/5, and will be less than 10% in 2025/6.
(This is ‘net total returns’. ‘Net’ means after ETF fees. ‘Total returns’ means capital gains + distributions).
Net total returns of 30% over the two years is not bad considering the current conditions – wars in Europe and the Middle-East, energy shocks, tariff wars, rising inflation, rising interest rates, aggressive tax hikes in Australia, and political fracturing here and around the world.
The portfolio’s benchmark is ‘VDGR’ (Vanguard Diversified Growth ETF net total return) because that is the lowest cost, broadly available, easily investable diversified ETF with a similar overall growth/defensive mix.
My ETF portfolio (and VDGR) have also beaten the vast majority of Big Super funds, including Retail, Corporate and Industry funds over the period. That is another story for another day, as the Big Super funds are stacked with all sorts of weird, illiquid ‘private market’ assets with fudged valuations and opaque accounting.
Also on the chart is Australian CPI inflation, which was 6.1% over the period (average 3.0% per year).
What worked / didn’t work
Before getting into the returns from each ETF in the portfolio, the main sources of out-performance were:
- GOLD – particularly in the first 18 months when it soared on rising US/middle-east tensions in the lead-up to the US/Iran war, although it has come back a little in recent months.
- iHOO (hedged top 100 global mega-caps) – rode the US tech/ai boom.
- All three ETFs for Australian shares (QOZ, AQLT, MVOL) beat the local market by good margins despite the ASX lagging global shares badly.
- Avoiding fixed rate bonds altogether and instead using SUBD – investment grade subordinated floating rate notes.
- The main detractors were the unhedged global shares ETFs skewed toward quality and small caps.
- My 40% hedge ratio on global shares detracted value as the AUD rose 3.7% against the USD.
- What I missed was not using Emerging Markets shares (IEM), which soared thanks to chip-makers Samsung Electronic and Hynix in South Korea, and Taiwan Semiconductor in Taiwan.
Returns per ETF
Here are the returns for each ETF. Chart A shows returns for all ETFs in the squad (light green), and those in the portfolio (dark green). Chart B highlights just the returns from the ETFs in the portfolio.
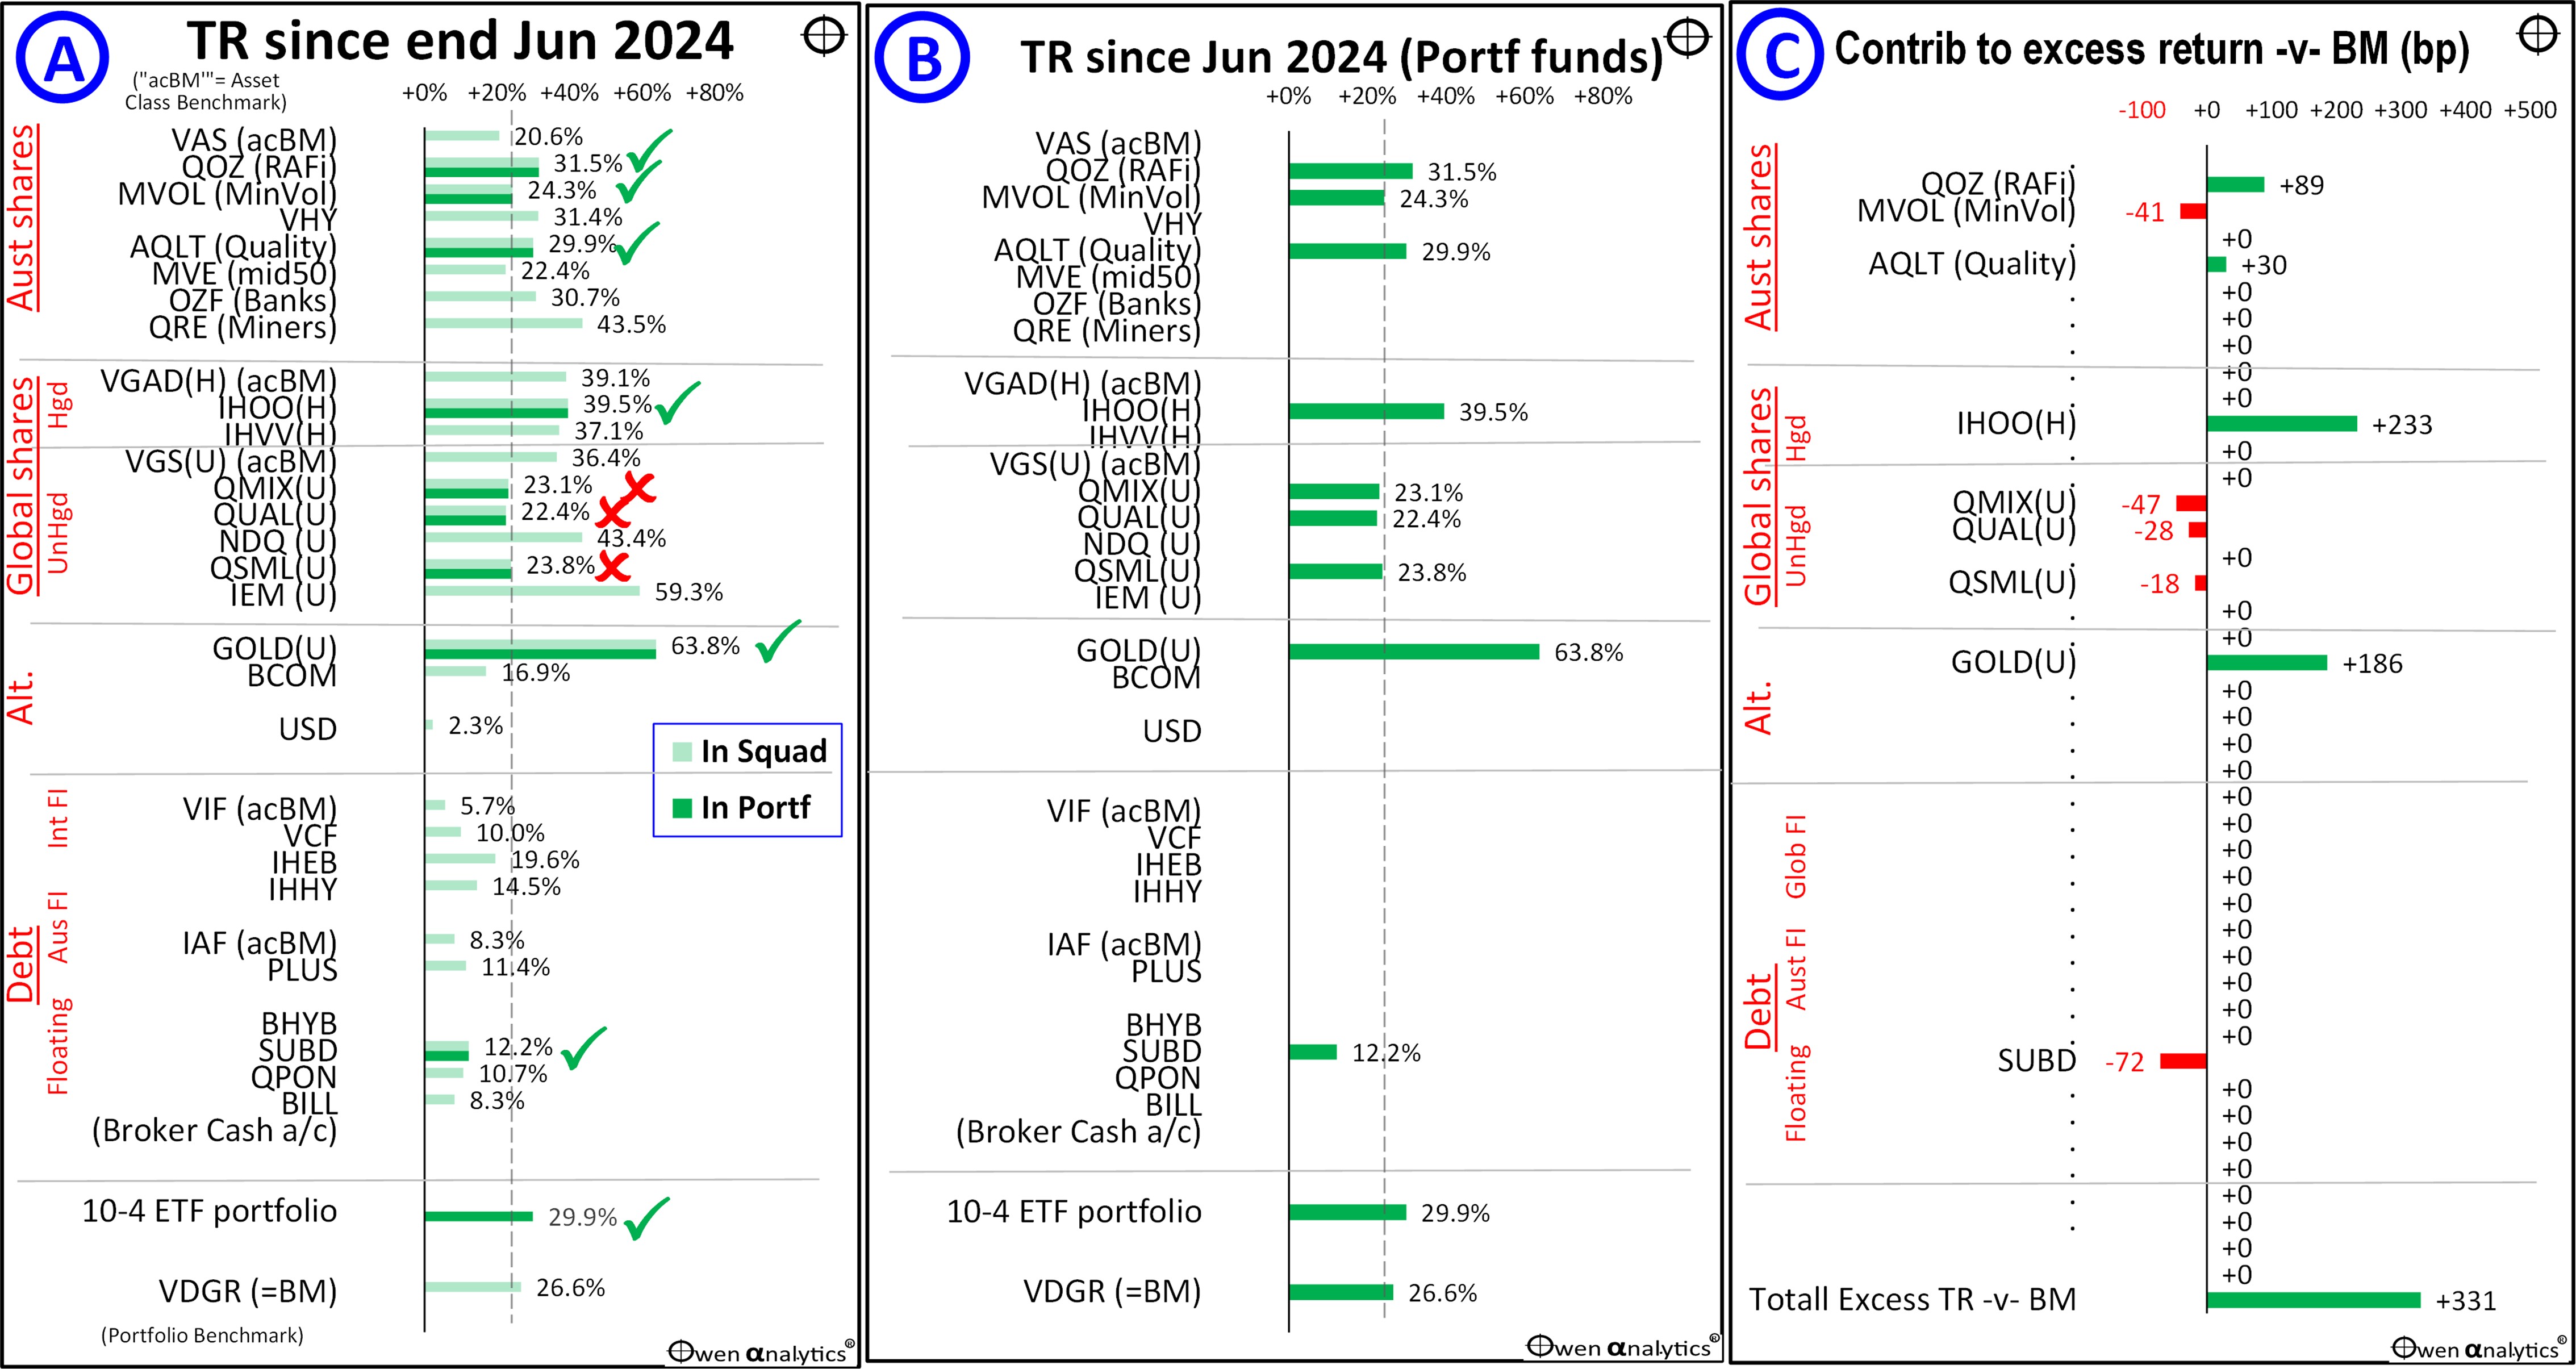
Chart C shows the value added or detracted in terms of basis points (one ‘basis point’ = one one-hundredth of a per cent), relative to the overall benchmark return.
Note that in chart C some ETFs appeared to detract value relative to the overall benchmark return (red negative basis point contributions) but they actually beat the benchmark for their asset class (for example MVOL and SUBD) which is a better test. See below.
The best returns were from GOLD (unhedged physical Gold), iHOO (hedged 100 global mega-caps), and QOZ (Australian ‘Real index’ shares). There were no negative returns.
Looking at each asset class and ETFs in turn:
Australian Shares
- Overall – added value:
- My Australian shares ETF mix beat the benchmark (VAS – tracks ASX300 which is the broadest ASX index) by +7.8%. So, even though the local share market lagged the US and the rest of the world by a big margin over the period, my mix of Aus shares ETFs made up much of the gap.
- All three of my Aus shares ETFs beat the market benchmark ETF (VAS):
- QOZ (RAFI) beat VAS by +10.9%
- QOZ tracks a FTSE-Russell ‘RAFI’ index where company weights are determined by ‘fundamentals’ like revenues, cash flows, dividends and net asset backing. I have always liked this approach (pioneered by Research Affiliates) as it favours companies with economic substance rather than fluff and hype.
- The main reason for its out-performance was the fact that for much of the period it held Newmont (gold miner) as its second largest holding behind BHP, which was great when the gold price was rising. But this year it reduced Newmont and the gold price fell back. It still has BHP as its largest holding but it under-weights CBA relative to the other big banks as it is still vastly over-priced.
- It also under-weights the health-care and tech sectors which are full of over-priced problems that have fallen the most and dragged down the overall ASX market, like CSL and Wisetech.
- MVOL (Minimum Volatility) beat VAS by +3.7%.
- MVOL tracks a MSCI minimum volatility index that assigns greater weights to companies lower volatility, which usually involves higher and/or more consistent revenues, profits and dividends – so it also favours companies with substance over fluff. It over-weights companies with hard assets and higher dividends like Telstra, Transurban, Coles, Medibank, and it under-weights CBA, as well as health-care and tech stocks.
- I like the idea of min-vol indexes not because they reduce price volatility (which does not worry me) but because low volatility companies tend have more robust businesses and usually have less aggressive/ego-driven management (or at least their robust businesses outlive and outlast their inevitable bouts of aggressive/ego-driven management!)
- AQLT (quality) beat VAS by +9.4%
- AQLT tracks the Solactive Australia Quality Select Index – which favours companies based on ‘quality’ indicators including high returns on equity, low leverage, and stable earnings. It over-weights companies like Telstra and even smaller stocks like Monadelphous, and under-weights CBA.
Global Shares
- Overall: detracted value
- The portfolio mix of global shares ETFs underperformed the global shares benchmark mix of 50/50 VGAD/VGS by -8% (50/50 mix of hedged and unhedged = 50% hedge ratio). The hedged side added value (because of skew toward US tech/ai/social media mega-caps), but the Unhedged side detracted because they were skewed away from mega-caps and toward companies with stronger fundamentals, quality and small-caps.
- FX hedging
- Global share ETFs come in two flavours – ‘hedged’ and ‘unhedged’ – where the foreign exchange risk is either 100% hedged or 0% hedged. The vast majority of ETFs are unhedged and the choice of hedged global shares ETFs is rather limited. There are no partially hedged ETFs. Investors manage their FX exposure by using a mix of hedged and un-hedged ETFs.
- My 10-4 portfolio had a 40/60 mix of hedged and unhedged global shares (ie a 40% hedge ratio). A hedge ratio below 50% generally adds value if the AUD falls, but detracts value if the AUD rises. I adopted a 40% hedge ratio at the outset because the AUD was a little above fair value at the time (on a number of grounds including PPP), and was more likely to fall than rise in the medium term.
- My 40% hedge ratio on global shares in the portfolio detracted value because the AUD rose against the USD (by +3.7%), which was more than the gains from the hedge carry (around 1% in favour of AUD because of our higher interest rates here), so the hedged benchmark ETF (VGAD) beat the un-hedged benchmark ETF (VGS) by 2.3%.
- Hedged side:
- On the hedged side of the global shares allocation I had the entire allocation in iHOO, which tracks the S&P Global 100 index of the 100 largest global companies (dominated by the US mega-caps).
- Because the current boom is being led by the US mega-caps, iHOO beat the hedged global shares benchmark VGAD by +0.4%.
- Un-Hedged side:
- On the other hand, the Unhedged global shares ETF mix lagged the unhedged benchmark (VGS) by a total -13%.
- 60% of the overall global shares allocation was un-hedged (40% hedge ratio). Within this I had 30% of global shares in QMIX, 15% in QUAL, and 15% in QSML.
- QMIX lagged VGS by -13.5%
- QMIX tracks the MSCI World Factor Mix A-Series index where stock selection and weights are determined by a mix of Quality, Value, and Low Volatility metrics. This ends up skewing the mix away from high growth stocks (like the US mega-caps) and toward stocks with stronger fundamentals. However, stocks like Microsoft, Apple, Nvidia, Meta, Broadcom, Alphabet/Google are still the largest holdings, but at much lower weights than the traditional market value weighted indexes, and therefore the index tends to have a higher dividend yield, lower price multiples than market value weighted indexes..
- QUAL lagged VGS by -14%
- QUAL tracks the MSCI World ex-Australia Quality index where stock selection is on the basis of high ROE, low leverage, and stable earnings. This penalises high-growth stocks and detracted from returns in the current high-growth tech boom.
- QSML lagged VGS by -12.6%
- QSML tracks the MSCI World ex Australia Small Cap Quality 150 Index. I use this to partially compensate for the skew toward mega-caps in iHOO, but also skew toward quality companies with superior balance sheets. Industrial companies make up the largest allocation, the overall market-value weighted indexes that are heavily skewed toward high-growth tech/ai and social media stocks.
Australia/Global share mix
The question of the ‘ideal mix’ of Australina and global (international) shares has always attracted much debate. There is no ‘right’ answer. For example, since the local Australian share market represents less than 2% of world share market value, why do Aussie investors (including Big Super funds) tend to have up to half or more of their share portfolios in Australian shares? I cover this ‘home bias’ in much detail elsewhere, and I outlined some of my reasoning in the articles I wrote when setting up the 10-4 portfolio.
The Aussie/global mix is especially topical when the local share market is lagging the rest of the world badly, as it has been in the current boom.
In my 10-4 portfolio I stuck to the standard and very common 50/50 split between Aussie and global shares, but I have made up for most of the ASX under-performance via my ETF mix selection for Aussie shares.
Over the two years, the VAS is up +21%, compared to VGAD (hedged) +39%, and VGS (unhedged) +36%.
But my Aussie share ETF mix was up +28%, while my hedged global shares mix was up +40%, and unhedged mix +23%.
Added together, my whole share ETF mix (Aussie/global) beat the default mix of VAS/VGAD/VGS by +3% all up. So the ETF selection decisions more than made up for the Asset Allocation mix in the overall result.
Debt / ‘Defensive’ allocation
- Overall: added value
- The ‘defensive’ side of most diversified portfolios (including most Big Super funds and also the benchmark diversified ETF for my 10-4 portfolio, VDGR) is a combination of Aussie fixed income (fixed rate bonds) and international fixed income. Usually the mix is 50/50 Aussie/global or thereabouts for the entire ‘defensive’ allocation.
- I have been bearish on the medium-term outlook for fixed rate bonds since 2021, fearing elevated inflation and interest rates over the next 5-10 years.
- Bonds are wrongly called ‘defensive’ assets because they have been defensive in the past BUT only when inflation is low/falling like the past 30 years. Fixed rate bonds are NOT ‘defensive’ when inflation is moderate or high and/or rising – which is the world we are in now.
- The benchmark ETF for Australian bonds (iAF) returned just 8% for the two years, which is very poor and barely beat inflation of 6.1%.
- The benchmark ETFs for international bonds are a mix of:
- VIF (investment grade international sovereign government bonds) – returned 5.7%
- And VCF (investment grade international ‘credit’, excludes sovereign government debt) – returned a slightly more respectable 10%.
- I avoided fixed rate bonds altogether and instead used SUBD for the entire ‘defensive’ allocation, which returned 12%.
- SUBD contains investment grade floating-rate subordinated notes issued in the AUD market by highly rated companies (mainly the big Aussie banks but also some other foreign banks and companies).
- This is an area where ordinary investors can beat Big Super because all institutional retirement/pension funds and Australia and around the world (including Big Super in Australia) are forced by their strict mandate rules to buy government bonds - ie forced to lend to deficit-addicted, debt-laden, profligate, pro-inflation governments. It’s a crazy situation where the governments with the biggest debt loads have the largest weights in the bond indexes that pension funds are forced to buy or replicate.
What about re-balancing?
In the big portfolios I ran for advice clients (active fund portfolios and also ETF portfolios) I always followed the text-book approach of regular rebalancing portfolios – generally quarterly.
Re-balancing the asset weights back to their ‘target’ weights essentially involves selling down the ‘winners’ and buying more of the ‘losers’. The idea behind regular rebalancing it is to maintain the target exposures (eg to exchange rates, sectors, regions, volatility, etc) by not letting the assets in the portfolio drift too far from their target allocations.
Re-balancing is also based on the idea that returns tend to be ‘mean-reverting’ – it assumes that any out-performance or under-performance is likely to be temporary and soon ‘revert’. Rebalancing sells some of the winners on the assumption that their out-performance is likely to be temporary so you may as well take some profits before they revert/under-perform.
Likewise, rebalancing tops up the ‘losers’ on the assumption that their under-performance will also be temporary and are likely to rebound, so you may as well pick up more shares or units at bargain prices to benefit when they revert/out-perform.
That is the traditional text-book approach, but in real life most investment markets don’t follow these nice, neat theories. In the real world, markets rarely mean-revert neatly each quarter or so. Often particular market segments or regions or themes can out-perform (or under-perform) for many years before ‘reverting’.
So in my own portfolios I generally let the portfolio weights ‘drift’ for a year or so before taking a look at re-balancing or making strategic adjustments. Not rebalancing religiously or regularly also saves on transaction costs (brokerage, spreads), taxes and admin costs/time.
In this case I have left if for two years without making any changes or even re-balancing - because I was busy (or just lazy!), and I am happy with the outcomes.
The next charts show how the portfolio weights have drifted since the initial set-up target weights (chart D) to their current weights after two years (chart E):
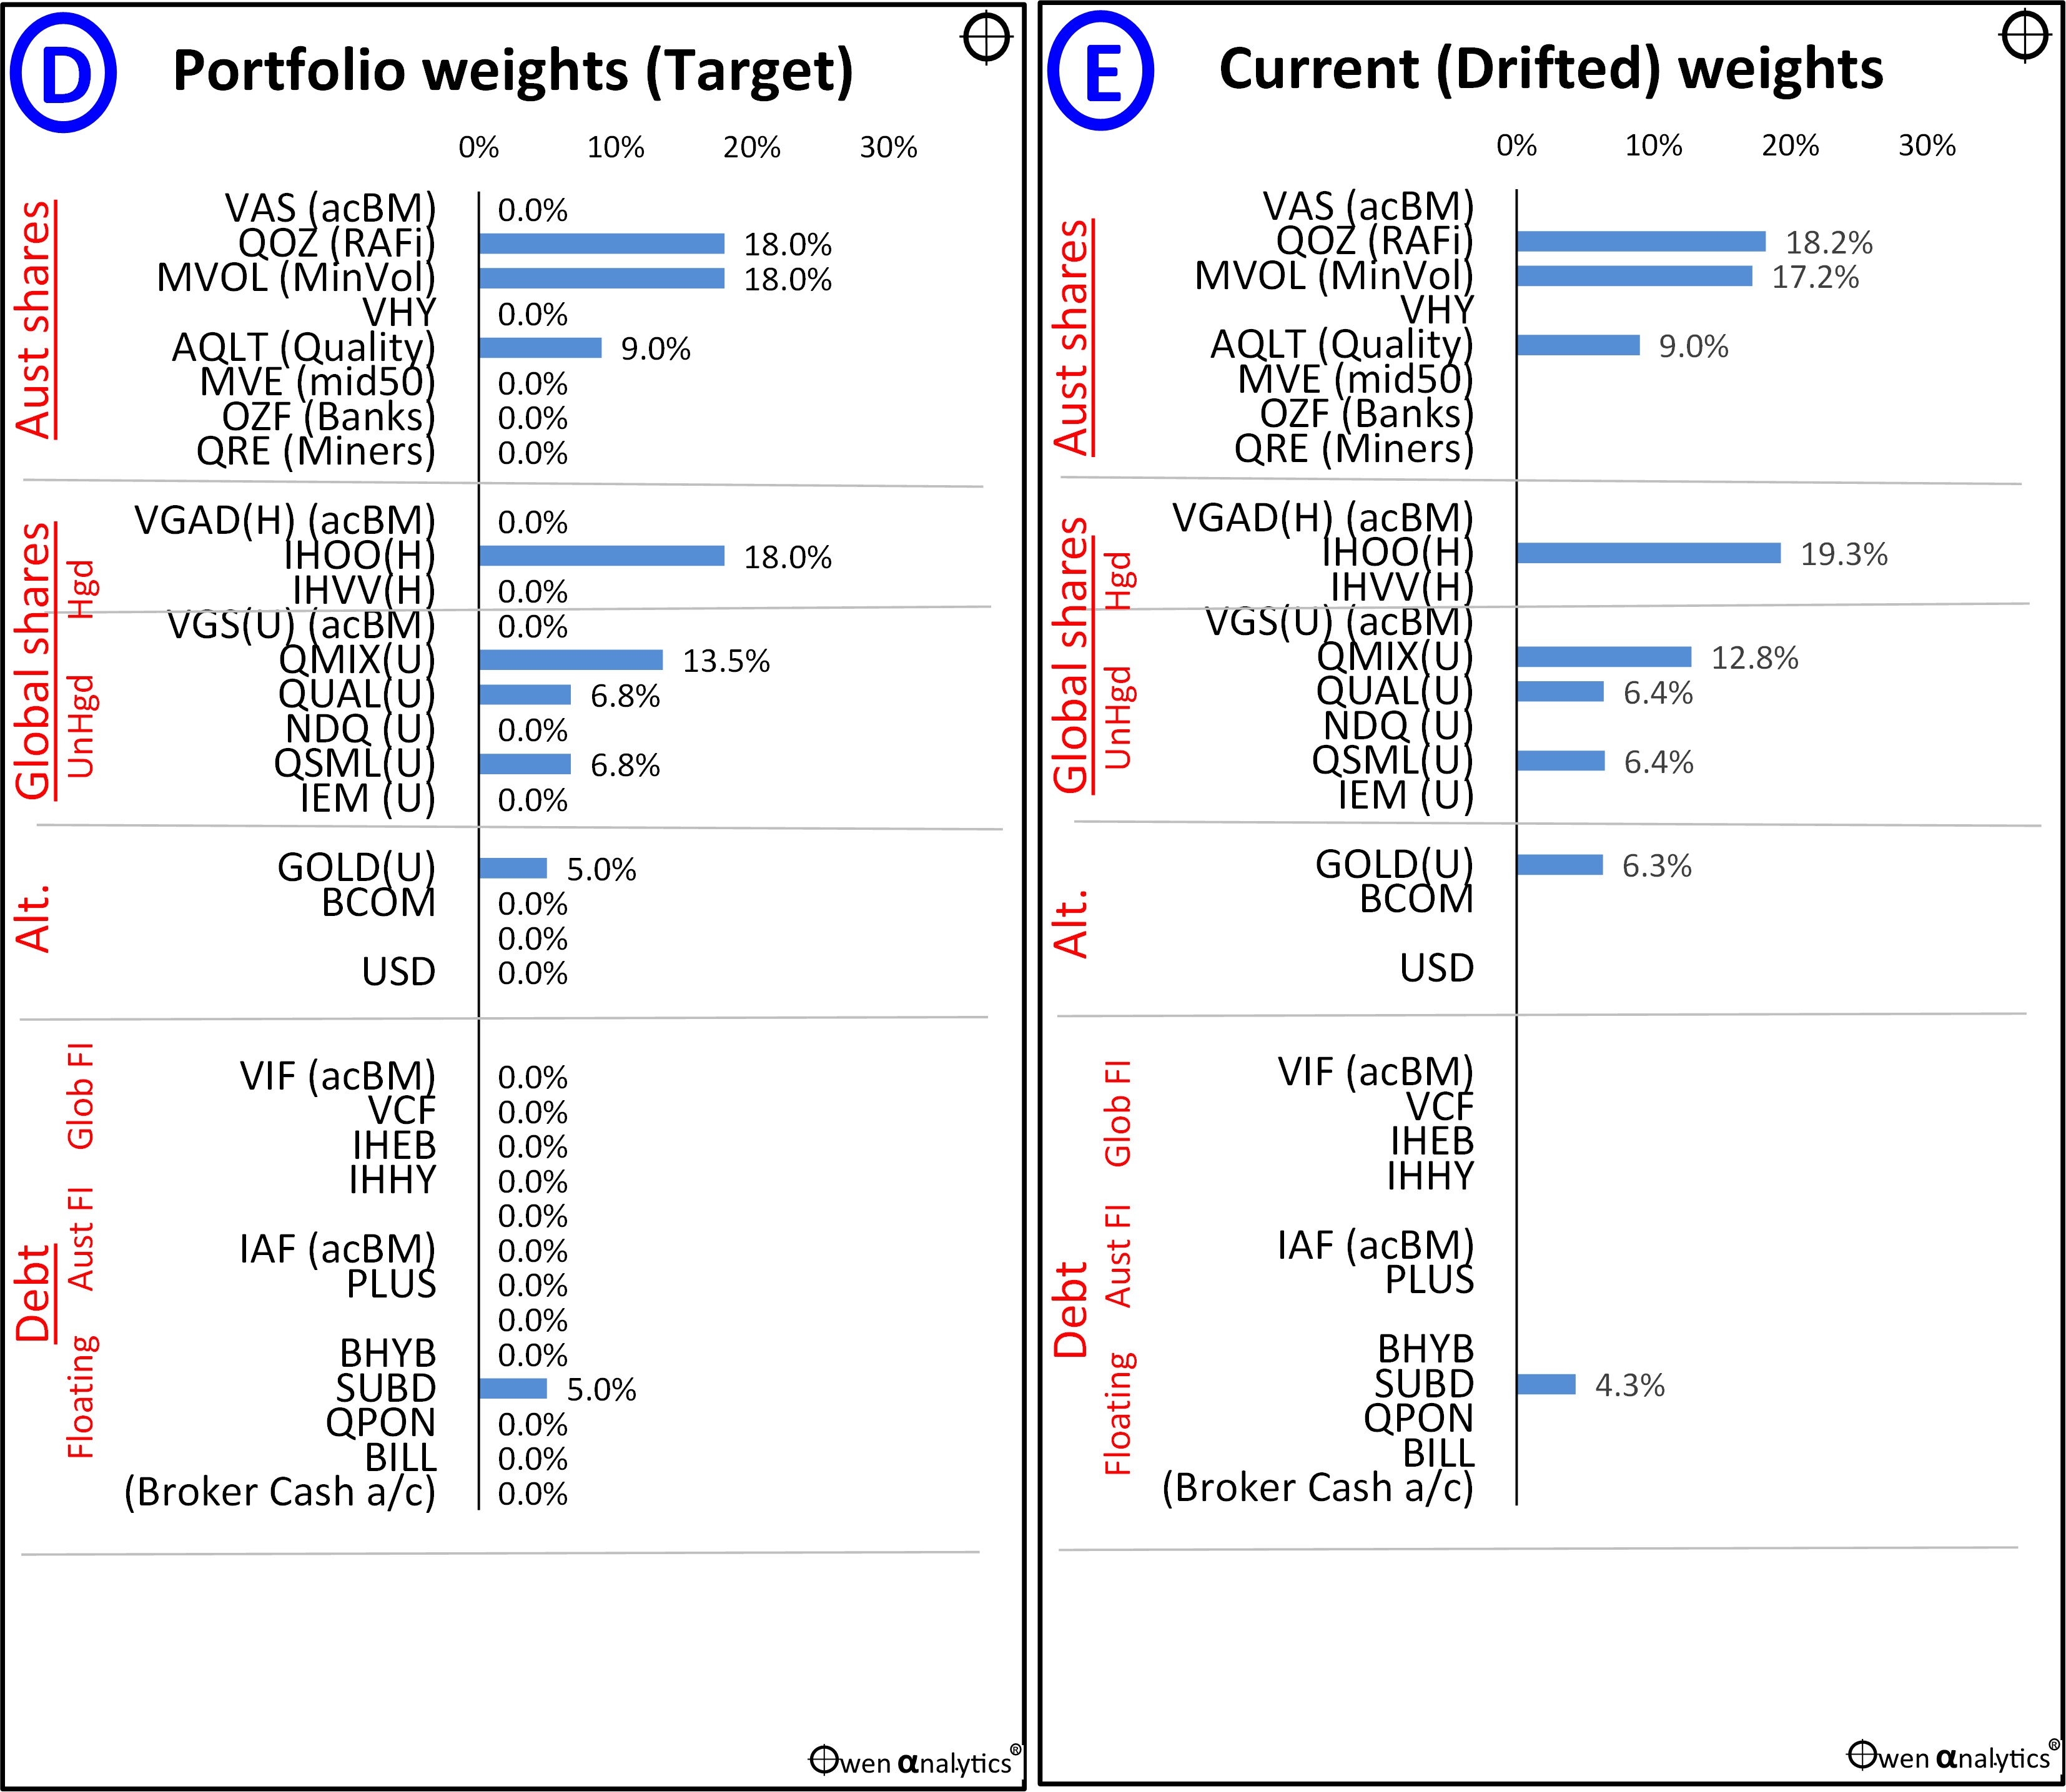
Despite the dramatic global boom over the past two years, the allocations have actually not moved far from their target weights because everything as done fairly well. It would be different if there were some big negative returns, but there were none in the ETFs I used here.
No conflicts of interest
Just a reminder that, unlike most of the garbage on LinkedIn and other social media, (I only single out LinkedIn here because that is the only ‘social media’ I have, but readers are always sending me an endless stream of links to posts on other sites.)
Unlike most or almost all of what is out there on the web, I have NO conflicts of interest in anything I do regarding investments. I receive no direct or indirect financial or non-financial benefit from any provider of any products or services. I do not sell or promote any financial or non-financial product or service.
My website is completely free of ads or sponsorships or sponsored material. There is NO revenue model. My newsletter available from my website is completely free forever.
In my portfolios (my own and advised) I use ETFs from all of the main ETF managers (Vanguard, BetaShares, iShares, Van Eck, State Street, Russell, GlobalX). These track indexes from all of the main index providers (S&P, MSCI, Bloomberg, FTSE/Russell, MarketVectors, Solactive, NASDAQ, Indxx, ICE, Morningstar, Stoxx, DBIQ, JPM MarketGrader).
I have no allegiance to any of them. I have never worked for any of them. I have never sold or promoted any product or service for any of them. I receive nothing in return for using their ETFs or indexes in portfolios or mentioning them in articles. (I get the same mostly lousy ‘service’ and access as everyone else!)
Not advice
Also it is important for readers to fully understand that this article (or anything in my newsletters or on my website) does NOT constitute financial product advice in any shape or form. It is simply a factual account of what I do with my own money. Everyone has different circumstances, needs, goals, risk tolerances, cash flow needs, tax positions, other assets and income, experiences, life stage, health, family situations, etc.
What is appropriate for each person in each situation may be very different to what I do with parts of my own funds. So PLEASE DO NOT follow what I do and/or write about.
Everyone should get their own professional advice from appropriately qualified and experienced professionals who can take into account each client’s entire situation and circumstances.
Stay tuned for more progress reports on the portfolio when I get around to it. . . .
‘Till next time. . . . safe investing, and stay healthy!