Enough of the political platitudes and puffery- here are the facts:
-
-
- Since Federation: ‘Right-leaning’ governments have run surpluses more often than ‘Left-leaning’ governments. The Right ran surpluses in 23% of their years in government, versus 19% for the Left.
- But ‘Timing is everything! - the Left happened to be in power during the big build-ups of deficits and debts in the two World Wars, when the spending was bi-partisan.
- In the post-WW2 era: Left wins – with 28% years in surplus versus 18% for Right.
- Overall, the Left have also run larger deficits on average than the Right: Average -2.0% GDP deficits for Left versus -1.4% for Right. But post-WW2 – deficits have averaged -1.0% of GDP for both sides.
- My verdict - Equal points to Left and Right since Federation.
- But equally POOR scores for both sides post-GFC. Both sides should have used windfall revenue gains to put our national fiscal house in order to be better prepared for global challenges, rather than just increase spending and debt.
- Australia is still a ‘banana republic’, as Keating warned in 1986, where government revenues and national incomes are heavily reliant on global commodities prices and volumes that are out of our control.
- The most effective and easiest way to improve ‘intergenerational equity’ is to use windfall commodities revenue gains to pay off debt rather than think up new ways to spend it.
- In tonight’ budget we are going to see a lot more taxes increases and expanding government, than spending cuts and restraint.
- Here’s my account of every government deficit and surplus since Federation.
- The big pink arrow running across the upper section of the chart depicts the ominous rise and rise in government tax-take and spending. Is this upward trend inevitable or stoppable?
It’s budget time again in Australia – lucky us!
As usual, both sides of politics claim to be better ‘economic managers’, but what to the facts show? Here I look at two of the main indicators of economic management - fiscal discipline (can they ‘balance the budget’?), and government debts (are they merely shifting the burden to the next generation?)
Today’s chart shows Australian Federal Government deficits and debts since Federation. The chart has three sections:
-
-
- The upper section shows federal general government revenues (green line) and outlays/spending (red line)
- The middle section shows the resultant annual deficits (red bars) and surpluses (green bars). Look hard - there are green deficits there, but you may need a magnifying glass to see them!
- The pink bars in the lower section show the level of gross Federal Government debt as a % of GDP.
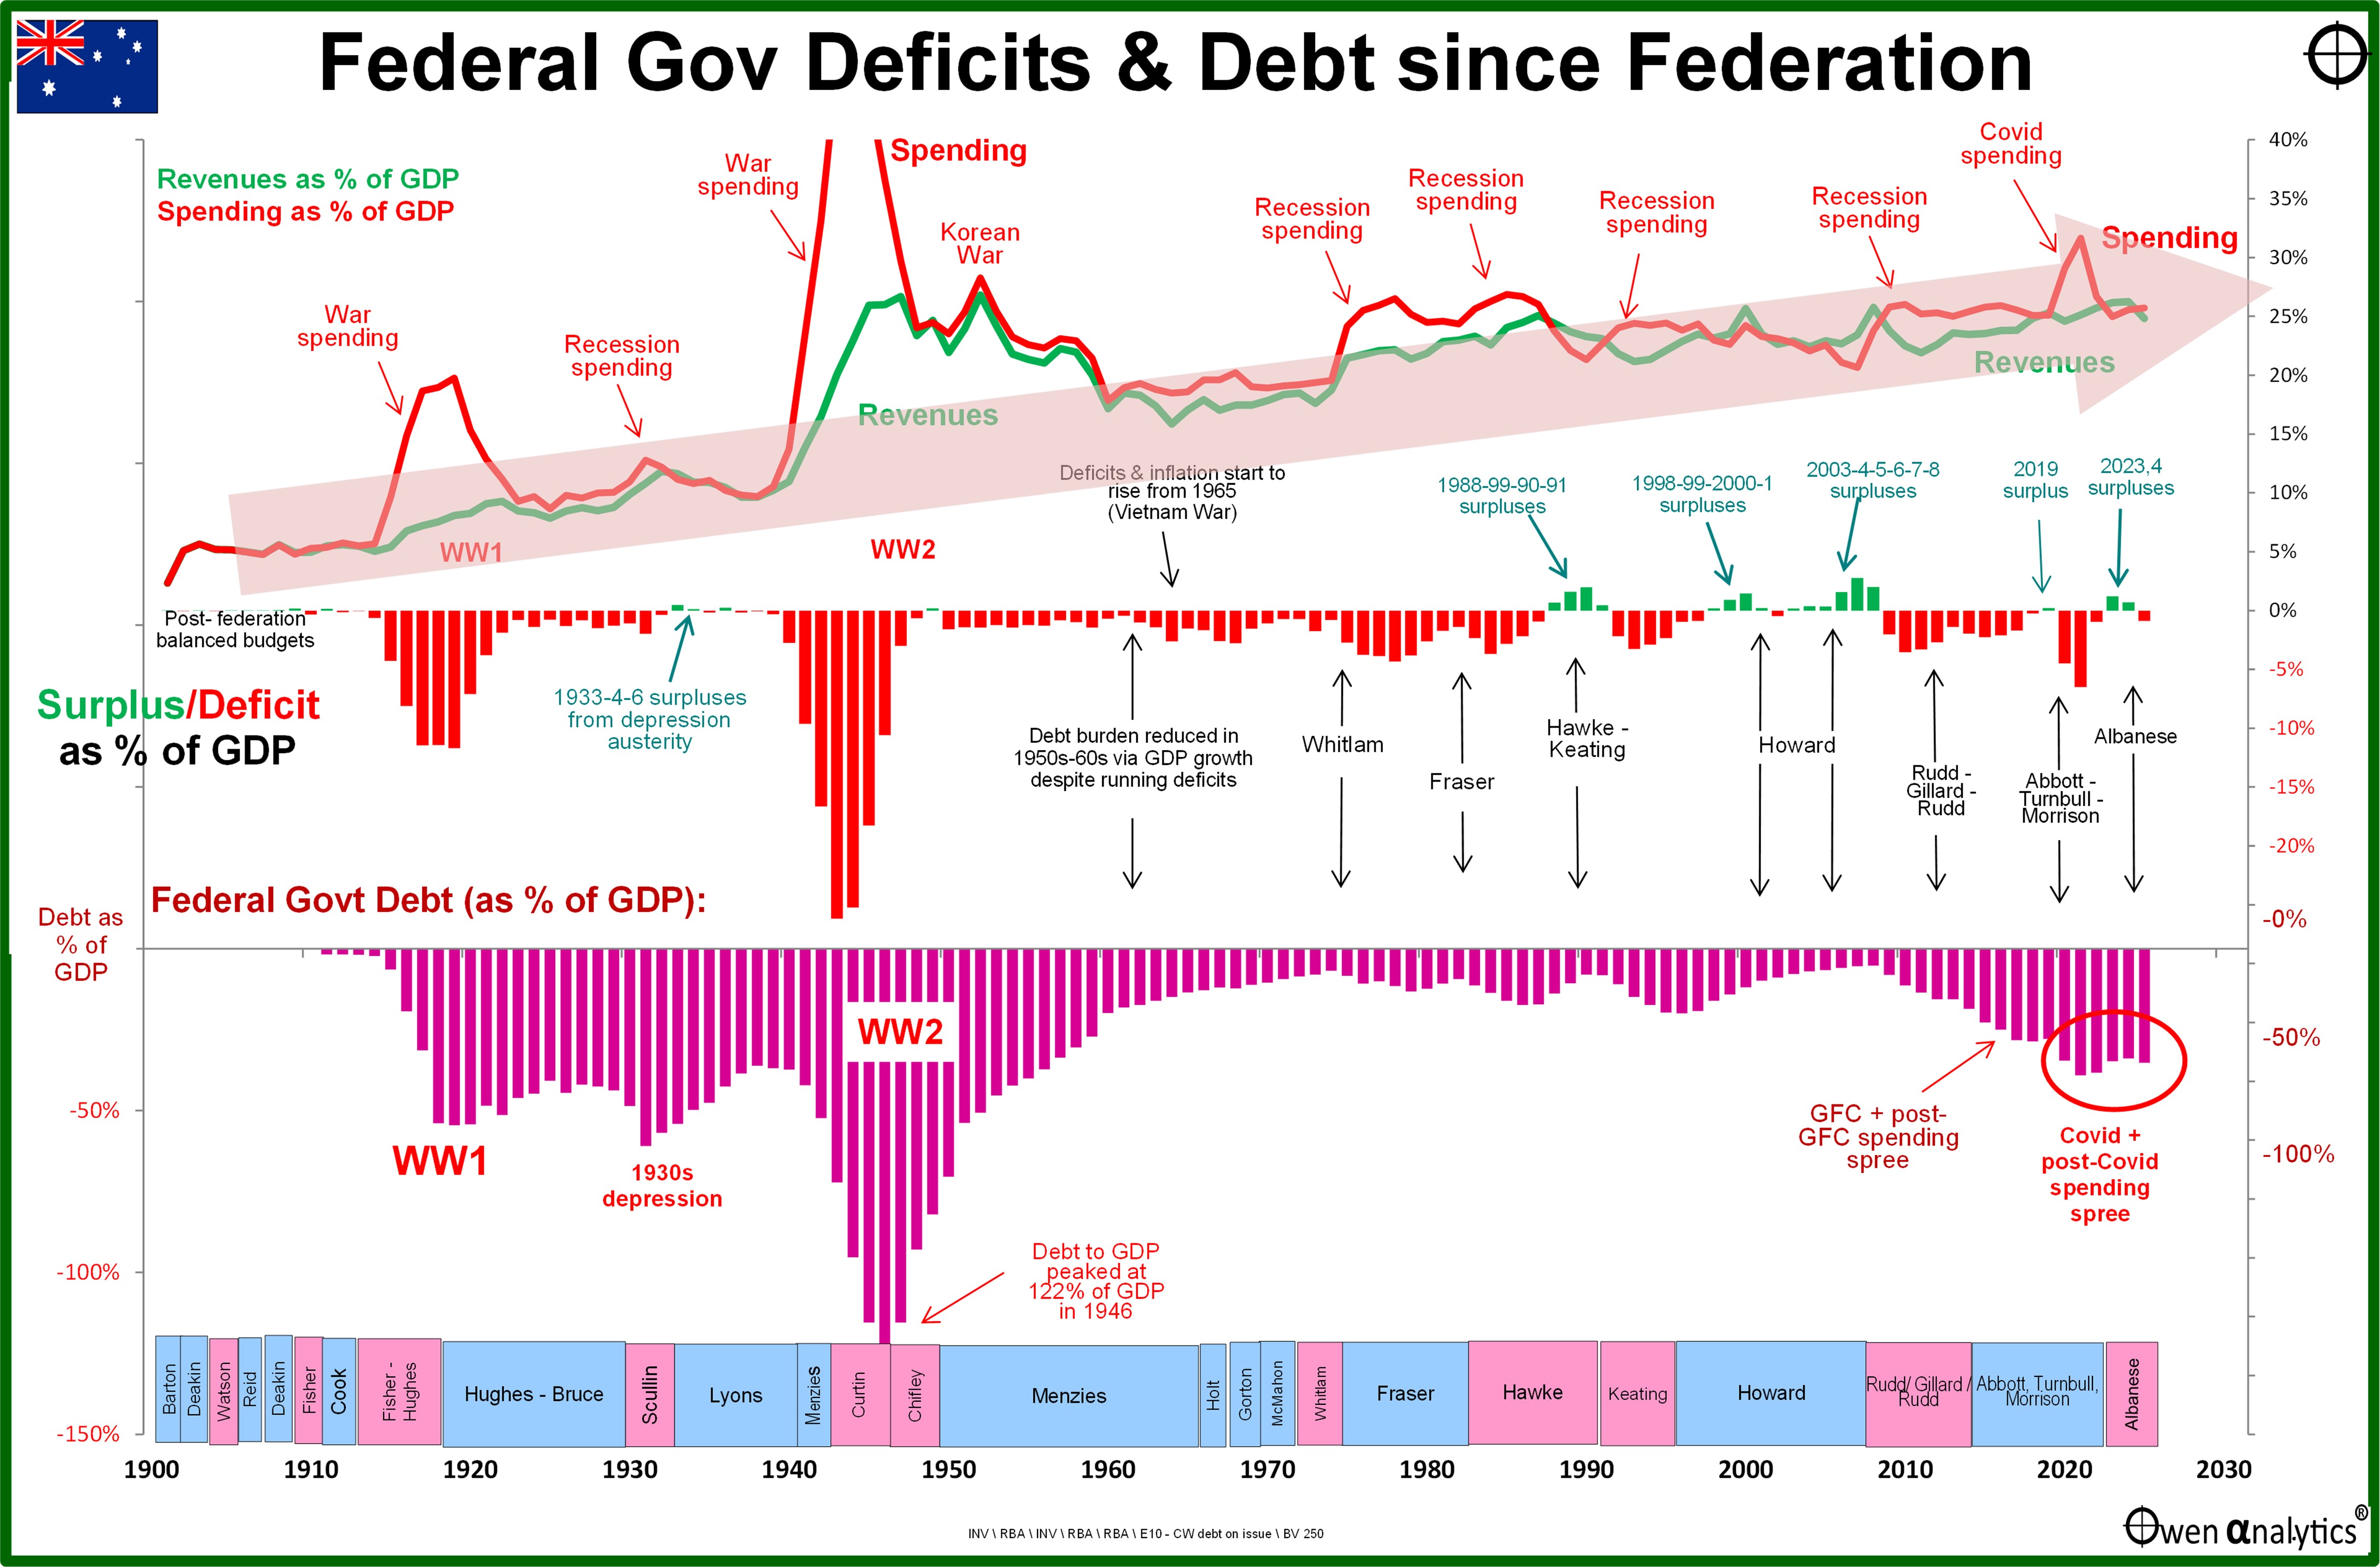
All numbers are expressed as a share of national income (Gross Domestic Product, or ‘GDP’), up to 2024/5 (actual), and best estimate for 2025/6.
I ignore budget forecasts!
I have no interest in political promises or wild guesses about future years (not even the coming ‘budget’ year) because the actual outcomes each year for both revenues and outlays are highly volatile and have almost no relation to the budget forecasts anyway.
Once the budget forecasts are tabled on budget night, they are never mentioned ever again by anyone – politicians, economists, or media. Nobody holds governments to account over how right or wrong their forecasts were because everyone knows they are just political fluff.
Why? Because Tax revenue outcomes are driven largely by commodities export prices and volumes over which the government has zero control.
Outlays are also largely outside the government’s control, either because they are blank-cheque spending programs with no caps or limits (eg NDIS), or ad-hoc pet political projects to win votes (eg propping up failed businesses like smelters, or ‘cost-of-living’ hand-outs, etc).
Enough about political fluff – now to the facts:
Revenues – the relentless rise of taxes
We will start with the revenue side first as it is more stable than the spending side. The green line in the upper section shows government revenues (mainly taxes) as a share of national income. It is essentially a picture of the relentless rise in the government tax-take over time.
In the early years following Federation, the Federal government ran balanced budgets, but that was easy as it had very few functions or costs prior to the introduction of aged pensions in 1909, and prior to WW1. Those were the glorious days when Canberra did not even exist! (aahh, bring back those days!) Canberra used to be just a sheep paddock. Actually, it is - ie full of brainless sheep! (My apologies to sheep).
Since then, there has been a steady rise in the size, cost, and role of the central government from 0% of national income, to more than 26% of GDP today. – an all-time high. (The only year when tax revenues as a share of national income were as high as today was in 1952 due to a massive jump in wool export revenues and also sales taxes hikes in the Korean War boom).
Essentially the big pink arrow running across the upper section of the chart depicts the ominous rise and rise in government tax-take and spending. Is this relentless upward trend inevitable or stoppable?
Spending – the relentless rise of government
The red line in the upper section is Federal ‘general government’ spending as a share of national income each year. Aside from the big jumps in war-time spending (covered below), the spending side has been very cyclical, even more so than the revenue side. Governments generally increase spending to support jobs and businesses in economic recessions.
Economic recessions also contract the size of GDP, so the impact of increased spending in recessions plus a smaller GDP result in cyclical bumps in the red line on the chart. Many of these bumps in recession spending are indicated along the red line in the upper section of the chart.
The main exception to this recession spending pattern was in the 1930s ‘Great Depression’ when the commercial banks, the government’s own Commonwealth Bank, and London bankers all refused to lend to the government. London and New York bond markets also closed the doors on Australian federal and state borrowing after NSW and the Commonwealth defaulted on their debts in 1931.
War-time deficit spending & debt build-ups
This is the elephant in the room. The main debt build-ups were due to huge deficit spending in the two World Wars. Debt was finally brought under control in the 1950s and 1960s economic booms. The government still ran small deficits in the post-war booms (1% to 2% of GDP) but rising tax revenues from the booming economy were enough to pay for expanding services and nation-building projects, and still reduce the debt/GDP ratio to pre-war levels by the early 1960s.
Government deficits started to rise again in the mid-1960s with the Vietnam War and social infrastructure spending with the post-war immigration and baby boom. Deficits continued into the 1970s and 1980s. Despite the general trend to higher government spending as a proportion of national income from the 1960s onward, both sides of government were able to generate surpluses in several years. Full marks to both sides.
Rare surpluses – from both sides
The Hawke-Keating Labor (‘Left’) governments generated surpluses in the four years from 1988 to 1991 inclusive, and the Howard Liberal/National coalition (‘Right’) generated surpluses for four years from 1998 to 2001, plus another six years from 2003-2008.
The Left had two surplus years from windfall commodities booms in 2022/3 and 2023/4 – which were pure luck (global supply restrictions). Australia overtook South Africa to become the world’s largest coal exporter (Covid restrictions at South African mines and ports), also overtook Brazil to become the world’s largest iron ore exporter (Covid restrictions plus Samarco mine disaster), and overtook Qatar to become (briefly) the world’s largest LNG exporter.
(There will, of course, be heated debates over who took the honours in some years due to the timing of elections, but I have done my best here to attribute credit/blame where it is due, given the lags between policy decisions and fiscal outcomes).
A government can produce a surplus in one of two ways – by cutting spending and/or by increasing tax revenues (and also selling of government assets – like Telstra, CBA, etc – which benefited Left and Right governments from the late 1980s to early 2000s).
Most of the surpluses have been from windfall revenue gains - mainly from fortuitous mining booms (and wool booms up to the early 1970s).
The problem is that tax revenues rely on commodities booms driven by global commodities price cycles that are completely outside our control. Hence Keating’s famous ‘banana republic’ warning in 1986.
Cutting spending is difficult and politically unpopular
Only rarely have our surpluses been achieved by governments cutting spending. This was the case with the 1930s surpluses, when Australia was unable to follow Roosevelt’s big spending approach in the US. Instead we had to endure harsh ‘austerity’ cost-cutting imposed by London bankers in the ‘Niemeyer Plan’. The government wasn’t able to borrow anyway as it was shut out of global credit markets after defaulting on its debts in 1931.
Arguably the severe austerity cuts prolonged the depression in Australia and stunted the recovery (similar to how German austerity rules stunted Europe’s growth in the 2010s).
Surpluses mainly from windfall commodities revenues, not spending control
The only other period of surpluses produced by cost-cutting was the four years from 1988 to 1991 by the Hawke/Keating government. Hawke-Keating also established the philosophical and mechanical process for privatisation of government enterprises which contributed to surpluses on both sides in the 1990s and early 2000s.
Tax revenues fell during the Hawke-Keating period (as commodities prices collapsed), but they were still able to produce surpluses by cutting spending by even more. These spending cuts no doubt contributed to the deep 1990-1 recession.
Both of the Howard government’s runs of surpluses were driven mainly by windfall tax revenue gains and one-off asset sales. The first (four years from 1998-2001) in the ‘dot-com’ boom, and the second (five years 2003-2007, or six years if you count the 2007-8 year during which Rudd came to office), were from boom-time mining revenues.
In addition, government spending was also reduced over the Howard years – from 25% of GDP in 1996 down to 21.7% in 2007. However, because most of the gains were from boom-time tax revenues, the windfall surpluses quickly disappeared when the booms ended. It is unfair to say that Howard squandered the windfall export revenue gains on middle-class welfare because he did pay off the national debt and reduce government spending as a share of GDP.
For the surplus years during from the late 1980s to early 2000s era (ie pre-China boom) – I award the Left (Hawke/Keating) two-thirds of the merit points, and one-third to Right (Howard/Costello).
2000s mining boom revenue windfall
By the end of the 2003-7 mining/China boom, the debt was down from 20% of GDP in 1996, to an all-time record low of 5% of GDP by 2007 – a combination of paying off debt plus a strong economic growth boosting GDP. (Net debt was zero, but today’s chart shows gross debt, which is a simpler and more intuitive concept. There is a lot of fuzzy accounting in what qualifies as an ‘asset’, but a debt is a debt.)
Then the GFC hit, and the new Labor government (a revolving door of Rudd-Gillard-Rudd) raised government spending dramatically. That was fine for a one-off spend in the GFC, but the spending spree lasted a decade!
The problem was that both Labor and Lib/Nat governments after the GFC became addicted to big spending, and they kept running up deficits well beyond the GFC. They ran deficits for the next nine years until 2018, for what was really just a one-year GFC crisis, especially as the Chinese stimulus re-boot in the GFC boosted exports, revenues, and jobs from 2010 onward. The deficits and debts were completely unnecessary.
Increasing spending is easy and politically popular. Reining in spending is hard, and is political suicide.
Windfall iron ore revenues produced a tiny surplus in 2019, but Federal debt had grown from $101b (8% of GDP) in the GFC in 2009, to $540b (28% of GDP) in 2019.
Then the Covid pandemic hit (or rather the government-imposed lockdowns hit), and the government started borrowing $30-$50b per month to fund hand-outs to counter the effects of their lockdowns.
The national debt reached 39% of GDP in 2020, which was highest level since the late-1950s when Australia regained its AAA credit rating after the 1931 default.
Let’s cut to the chase – ‘Right’ or ‘Left’?
In order to measure which side of politics has a better record on deficits and debts, first we need to label each PM and their government as either ‘left-leaning’ or ‘right-leaning’.
Since the 1940s, this has been relatively simple – ‘right’ for Liberal and Country/National parties, and ‘left’ for Labor. Traditionally, ‘left’ tended to mean pro-worker and big government, and ‘right’ has tended to mean pro-capital (business) and small government, but it is not that straightforward as governments often stray far from their labels.
The first 40 years after Federation was more complex as it wasn’t a question of Liberal versus Labor. A variety of political parties held government at various times. Prime Ministers switched parties, and the parties also changed policies.
For example, Billy Hughes (PM from October 1915 to February 1923) was a member of five different political parties at various times! I count Hughes as ‘left-leaning’ during his Labor and National Labor periods as PM, but ‘right-leaning’ for his Nationalist period as PM.
Based on their economic policies at the time, I have labelled the following parties as ‘right-leaning’ – the Protectionist Party, Fusion Party, Free Trade Party, Nationalist Party, the early Liberal Party, United Australia Party, and Country Party. I have labelled the National Labor Party and the Australian Labor Party as ‘left-leaning’.
In terms of timing, given the numbers are for June fiscal years, I awarded each year to the government that was in power for most of the fiscal year (except 1932, which I split 50/50 between Scullin/Lyons, because Lyons took office in January 1932 and he continued the same fiscal policies as Scullin). There is a degree of subjectivity involved here of course, but it is probably a good starting point. Please let me know in the Comments section!
On this basis we have had right-leaning governments for 67% of the time since Federation, and left-leaning governments for the remaining 33% of the time – a neat two-thirds / one-third split.
Which side wins?
Here are the summary outcomes for deficits under ‘Left’ and ‘Right’ governments in Australia:
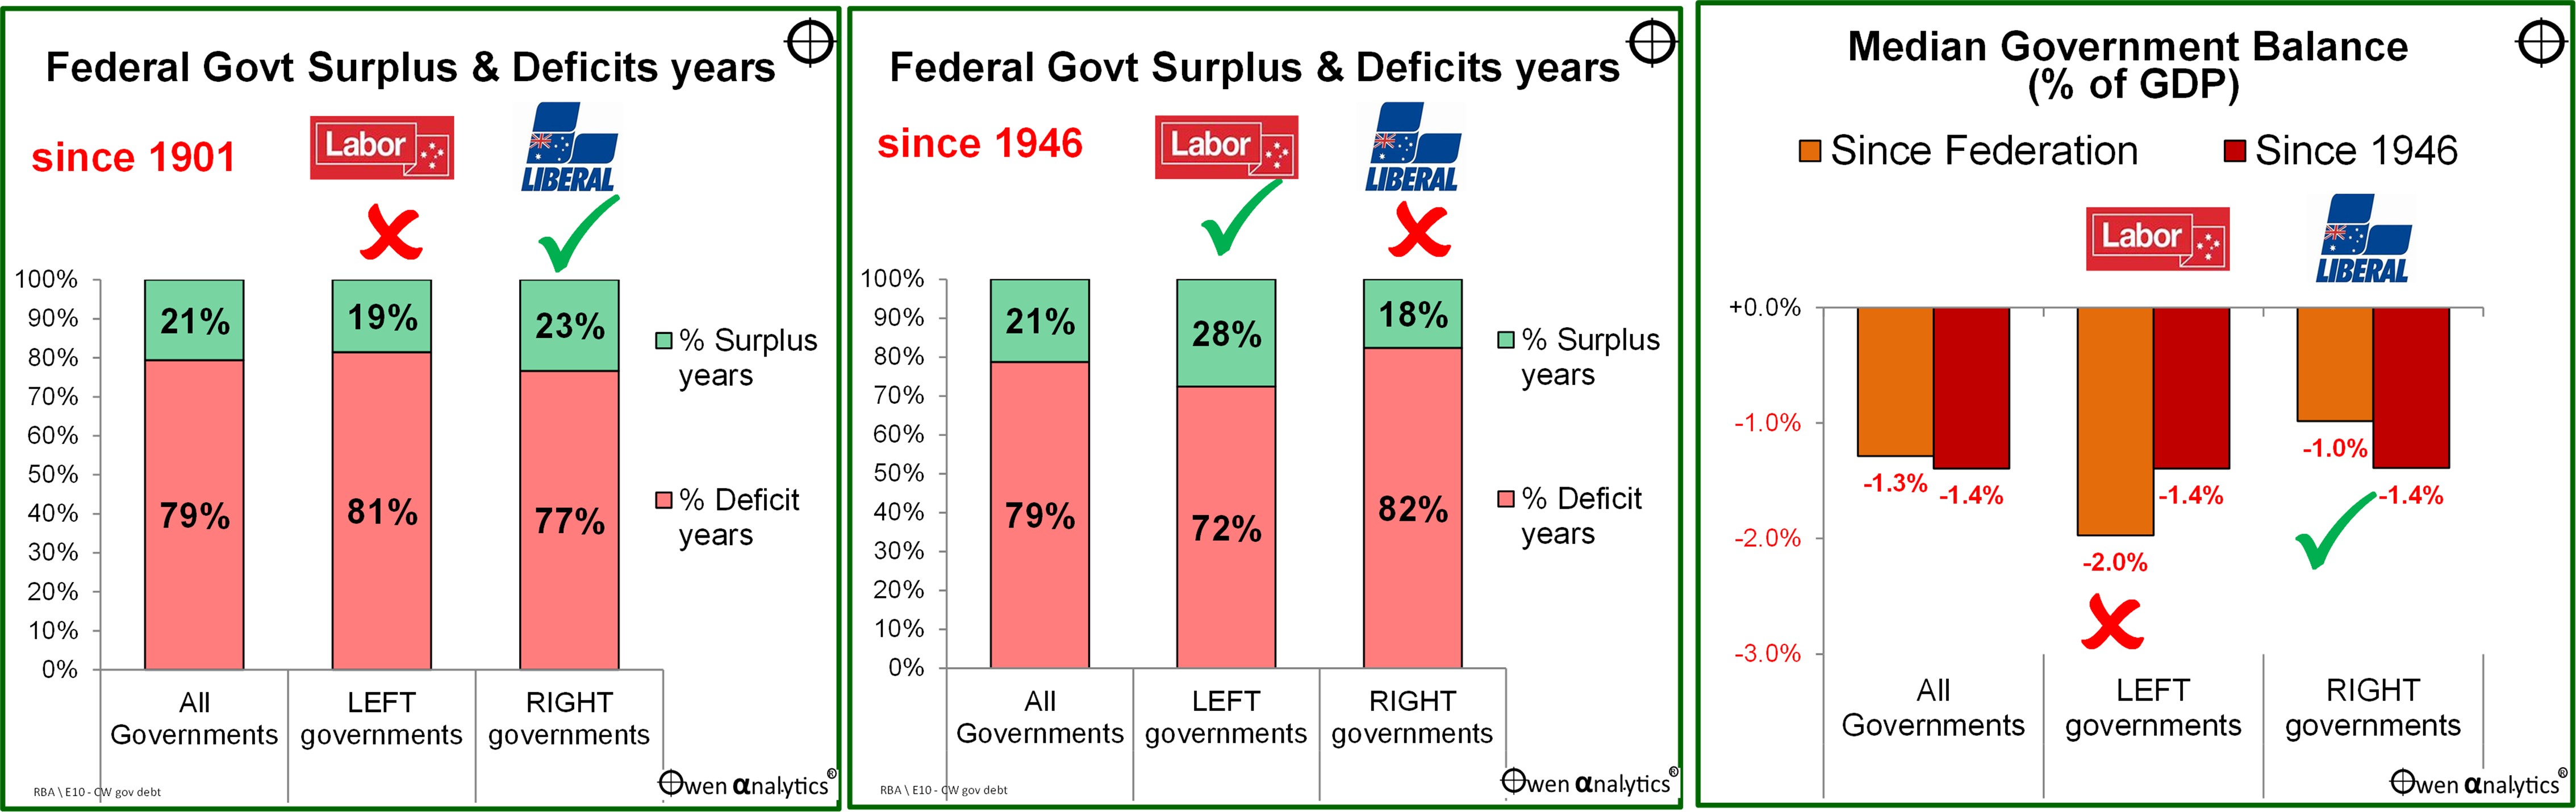
Since Federation in 1901 (left chart) - ‘Right-leaning’ governments have run surpluses more often than ‘Left-leaning’ governments. The Right ran surpluses in 23% of their years in government, versus 19% for the Left.
However, if we just look at the post-WW2 era (middle chart), Left wins, with 28% surplus years versus 18% for Right.
In terms of the size of deficits, Left have run larger deficits on average (orange bars on the right chart): deficits of -2.0% of GDP for Left versus -1.0% of GDP deficits for Right.
However, in the post-WW2 era (red bars in right chart), the average deficits (in the years they ran deficits) have been the same under Left and Right governments.
Timing is everything!
Although history shows that Left governments have a poorer record than Right governments overall on deficits and debts, the main reason was that Labor happened to be in power during the two main periods of war-time deficits and debts, where the spending and borrowing programs were bi-partisan.
Andrew Fisher (Labor) took office just 44 days after the outbreak of WW1, replacing Joe Cook (Lib, Nationalist).
Jim Scullin (Labor) to office just six days before Wall Street’s ‘Black Monday’ 1929 crash at the start of the Great Depression, after the long 1920s boom under Stanley Bruce (Nationalist, ‘Right’).
Then Joe Lyons (UAP, ‘Right’) took office from January 1932, and he continued the same austerity plan that Scullin had adopted. Neither had any real choice, with the credit taps turned off by bankers, and global bond markets black-banned Australia after its 1931 default.
In the Second World War, Menzies (UAP, Lib, ‘right’) was in power at the start of the war in Europe, but John Curtin (Labor) took office right before Pearl Harbor, the fall of Singapore, and the Japanese bombing of Darwin, which led to the dramatic rise in Australia’s war-time spending and debt.
On the other hand, the right chart above shows that ‘Left’ governments contributed to the largest improvements in budget balances – ie reducing deficits, mainly after the big war-time build-ups. The debt reduction (as a % of GDP) was mainly due to growth in the economy, rather than ‘paying it off’, but both sides were committed to running balanced budgets over a cycle.
Post-WW2 era
If we look at just the post-WW2 era (send small chart above), Left wins on running surpluses in 28% of years in power versus 18% for Right.
However in the post-WW2 era (red bars in right chart), the average deficits (in the years they ran deficits) have been the same under Left and Right governments.
It is notable that the post-WW2 deficits (since 1946) have been LARGER than pre-1946 which includes the big spending increases in WW1 and WW2 (median -1.4% deficits for all governments pre-1946 versus -1.0% post-1946).
My verdict?
Equal points to both sides on past outcomes for fiscal responsibility. Looking at recent decades:
- Howard (Lib) produced 10 years of surpluses (or 9 if you credit 2007-8 to Rudd). It was NOT just windfall mining boom revenues (pure luck, no points for that), but Howard also cut spending (as % of GDP), and importantly paid off the national debt, which deserves bonus points.
- Hawke/Keating (Lab) produced 4 years of surpluses, which scores extra points because:
- (a) they were during a deep economic recession (the spending cuts undoubtedly worsened the recession), and
- (b) there was NO windfall mining boom effect, in fact commodities prices and revenues were collapsing during the 1980s and early 1990s.
- Additional points for Left also for undertaking the painful but necessary economic reforms that had lasting effects over the next couple of decades (including the Howard surpluses).
- However, in the post-GFC era, both sides score equally poorly:
- (a) both sides squandered windfall revenue gains by extending spending well beyond the short-term emergencies of the GFC and Covid,
- (b) both sides relied mainly on ‘bracket creep’ as the main source of increased (tax by stealth), and
- (c) both sides abandoned the principle of offsetting spending increases with savings elsewhere, and both sides have also abandoned the philosophical aim of balancing the budget over a cycle.
- Double demerits for recent Labor governments for progressively dismantling many of the productivity-enhancing reforms of the Hawke/Keating era.
Future?
That is the past – but what of the future?
Both sides of politics, besides mouthing empty platitudes, have abandoned any thought of fiscal responsibility (balancing the budget over an economic cycle). Both sides seem hell-bent on tit-for-tat escalation of ever-expanding ‘me too’ hand-outs to buy votes.
This is certainly disappointing but is probably just a continuation of the post-GFC and post-Covid theme when both sides were guilty of squandering windfall mining revenues, and racking up debt despite positive economic growth, and low unemployment.
The main revenue raising mechanism has been bracket creep accelerated by inflation. Bracket creep was not as visible during the low-inflation era, but now it is becoming much more visible with higher inflation lifting wages and increasing the tax take.
At a deeper level, the GFC appears to have heralded a whole new political-economy era – not just in Australia but around the world. Governments have become much more populist and interventionist, and much more eager to throw money at anything to support jobs and business to get elected or re-elected, regardless of the cost or cost-effectiveness.
How do we rate?
What is amazing is that, aside from the disturbing post-GFC pattern of both sides squandering windfall mining revenues and abandoning balanced budgets as a policy principle, Australia still has relatively low levels of federal government debt. See -
Australia also has the most favourable economic fundamentals of any ‘rich country’ – demographics and immigration. See-
So I would argue that Australia, relative to its peer nations, has a ‘lazy balance sheet’ - it should be borrowing more to finance productivity-improving investments and reforms.
For example, the US is running deficits of 6% of its GDP (worse than Australia has ever had since 1946, including during Covid), and US federal debt is 120% of GDP (the same as Australia at its very worst in 1946).
Opportunity wasted
Australia is truly a ‘lucky country’ – blessed with seemingly endless resources the rest of the world wants and is willing to pay for. Whenever the world wants a new commodity, we seem to find it under a rock somewhere.
Both sides of politics in Australia could have prudently used the long period of global peace and prosperity plus windfall mining revenues, to get Australia’s fiscal house in order, and build a ‘war chest’ in case things turn sour (global slowdown, pandemics, US political/financial turmoil, trade wars, cold wars, hot wars, having to ‘fend for ourselves’ militarily).
Because of fiscal irresponsibility from governments of both flavours (federal and state) since the early 2000s, we are in poor shape to deal with the global disruptions we are experiencing now.
Meanwhile, keep your eye on that steadily rising red arrow casting an ominous shadow in the upper section of the chart – the rise and rise of big government!
Do voters really care about fiscal responsibility? About putting our national house on a strong fiscal footing to better face unknown future challenges the world may throw at us? Or are they just interested in a quick sugar hit from hand-outs?
‘Till next time. . . .safe investing!
For my most recent monthly update for Aussie investors: