Greetings fellow investors!
This is an update on a story I wrote a couple of years ago about how companies fared through the Covid and immediate post-Covid era.
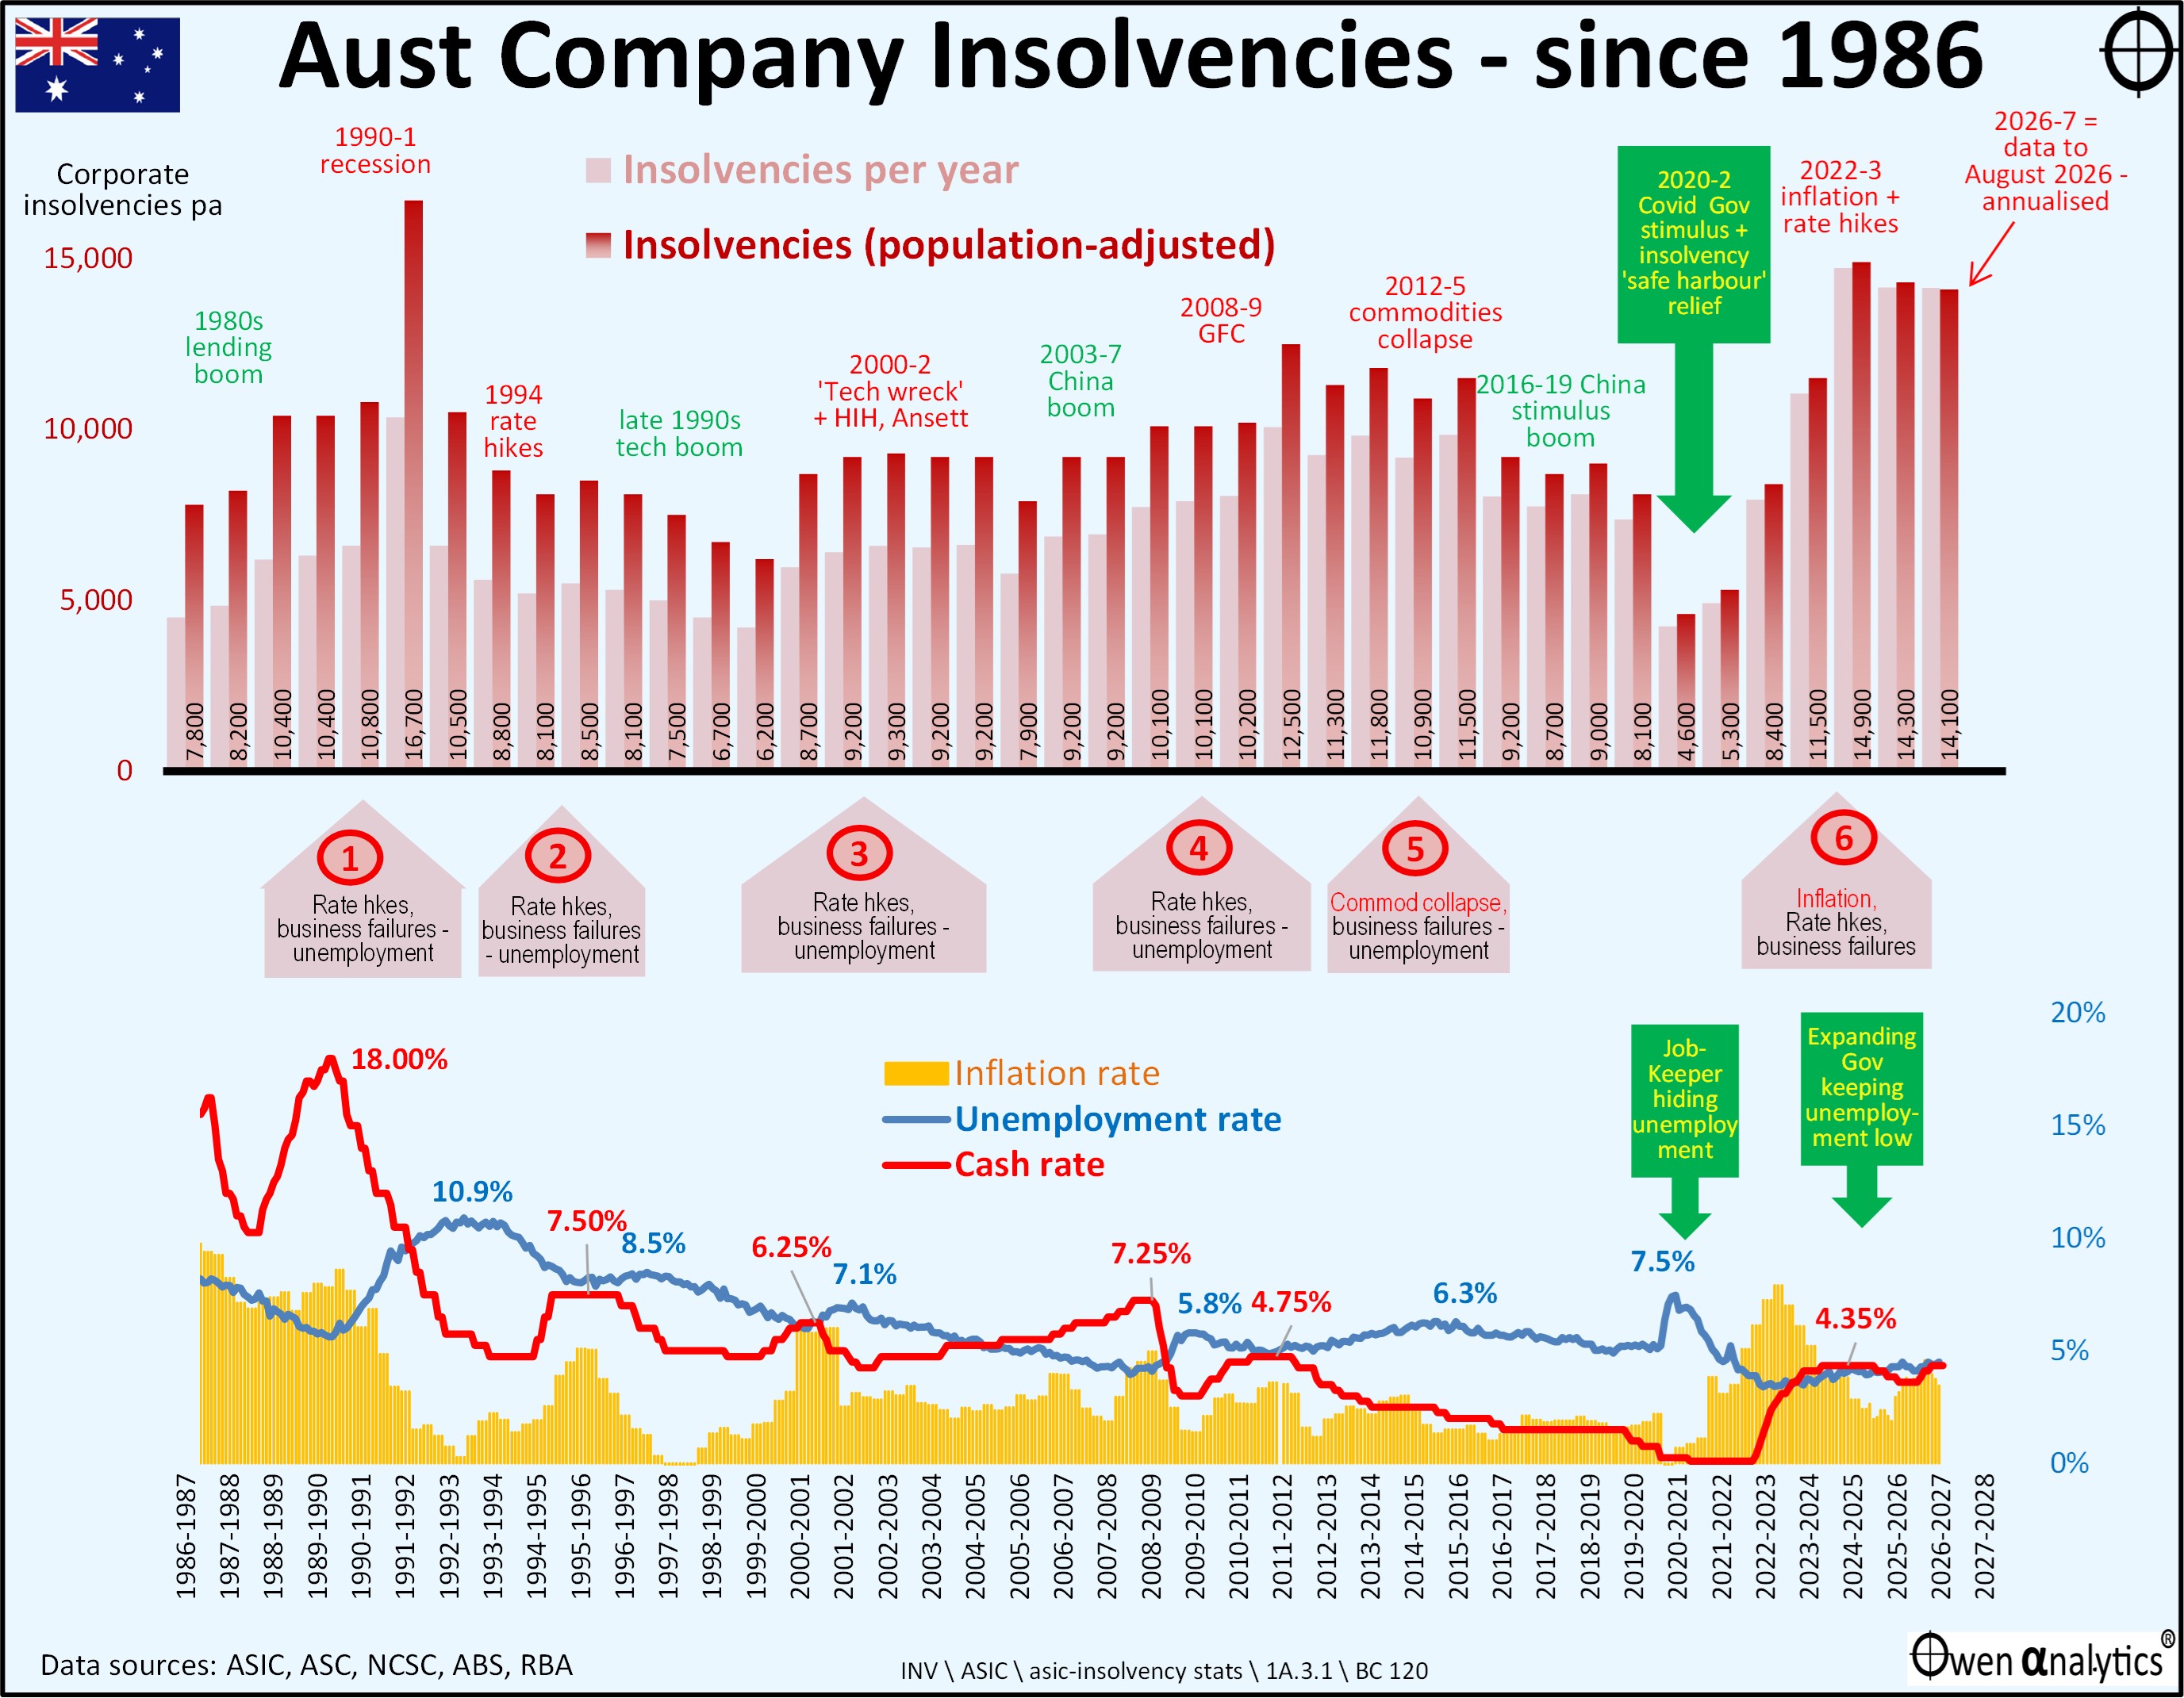
Today’s chart shows company insolvencies in Australia per year since 1986, which covers six business cycles:
(I started out as a commercial / property lender with Citibank in the early 1980s doing work-outs and re-finances in the early 1980s recession that followed the late 1970s property boom. I’ve lived and worked hands-on through a few cycles!)
The light pink bars In the upper section show the number of insolvencies per June year since 1986-7. To the far right, the number for the current 2026-7 June year is a simple 12-month extrapolation of the most recent data to late August 2026. It is a fraction lower than the last two years, higher than the worst year of the GFC, but not as high as early 1990s recession peak.
(Data is from ASIC insolvency statistics - https://www.asic.gov.au/about-asic/corporate-publications/statistics/insolvency-statistics#series1and2insolvencystatistics. Pre-ASIC data is from ASIC’s predecessors – ASC and NCSC)
Need to adjust for population growth
I have added maroon bars in the upper section to show the insolvency numbers in population-adjusted terms. This is necessary so we can compare like for like. Australia’s population has increased by more than 70% over the period, and so we can expect the level of economic activity, like company insolvencies, would be higher by more or less a similar proportion.
In the past 40 years covered in this chart, the worst year for company insolvencies was 2024-5 following the series of 13 rate hikes in 2022-3 to attack the Covid stimulus inflation outbreak. There were 14,700 business insolvencies (56 business failures per trading day), or 14,900 in population adjusted terms.
The following year, 2025-6, had slightly fewer insolvencies, and so far the current year, 2026-7, is tracking at around the same rate. So things have been fairly steady over the past three years.
Bathla collapse not in the numbers yet
Note that this does NOT include the Bathla collapse, which will probably trigger a significant number of related insolvencies among its 1,000+ sub-contractors and trade creditors. More about Bathla later.
Insolvencies, interest rates, unemployment and economic cycles
The lower section of the chart shows inflation, cash rates, and unemployment rates over the period. These are integral to business / insolvency cycles.
Insolvency numbers rise and fall with economic cycles. The number of business failures rise in economic slowdowns, then declines in economic recoveries and booms as business conditions improve. Most, but not all, economic slowdowns are preceded by interest rate hikes (normally to cool rising inflation in economic booms), and are then followed by rising unemployment.
Six business / insolvency cycles in the past four decades
The chart highlights six economic cycles in Australia since the mid-1980s. The pattern is the same in almost every case –
· (A) rate hikes to tackle inflation, resulting
· (B) a rise in business failures putting people out of work, which
· (C) lifts the unemployment rate.
Cycle 1 – Keating’s ‘recession we had to have’
Bank deregulation in the mid-1980s triggered an orgy of mad and bad lending that fuelled speculative booms in corporate take-overs and property construction (I know. I was in the middle of it!). Interest rates were hiked to up 18% in November 1989 to tackle 8.6% inflation, resulting in a spike in business failures, sending unemployment to 10.9% by the end of 1992. Cash rates had to be cut back to 4.75% in the recession to stimulate business recovery and employment.
Cycle 2 – 1994 inflation scare & bond crisis
After the revival of business activity and inflation following the early-1990s recession and banking crisis, interest rates were hiked back up to 7.5% by December 1994 to tackle 5.1% inflation, resulting in a spike in business failures, and sending unemployment back up to 8.5% by February 1997.
Cash rates were then cut back to 4.75% again to stimulate business recovery and employment.
Cycle 3 – 2001-2 ‘tech-wreck’
In the latter stages of the late 1990s speculative ‘dot-com’ boom, interest rates were hiked up to 6.25% by August 2000 to tackle 6.1% inflation, resulting in a spike in business failures, and sending unemployment to 7.1% by October 2001.
In the slowdown, cash rates were cut back to 4.25% to stimulate business recovery and employment.
Australia avoided an economic ‘recession’ on that occasion, unlike the US, where the recession was deep and protracted. Although we only had a relatively minor ‘dot-com’ boom and ‘tech-wreck’ crash, the broad economic slowdown in Australia was exacerbated by some large, un-related corporate collapses here – notably HIH Insurance and Ansett Airlines, both of which had major knock-on effects to large numbers of small and medium sized businesses across the economy.
Cycle 4 – 2008-9 global financial crisis
In the late stages of the 2003-7 China / commodities / credit boom, interest rates were hiked to 7.25% by March 2008 to tackle 5% inflation, resulting in a spike in business failures, and sending unemployment to 5.8% in June 2009. Cash rates were cut back to 3% in the recession to stimulate business recovery and employment.
Insolvency numbers did not rise as much in the GFC (which was a much deeper economic contraction in Australia than the 2001-2 ‘tech-wreck’) because the GFC was quickly followed by the 2010-11 Chinese stimulus boom, plus various government support measures.
Cycle 5 – 2014-5 China slowdown, commodities collapse, oil/gas/steel crisis
This particular cycle was NOT caused by inflation, as it was running at a very low 1.5% at the time. This cycle was caused by China’s post-GFC-stimulus slowdown, resulting in a collapse in global commodities prices that caused a string of oil / gas / steel bankruptcies in Australia and around the world, resulting in a spike in business failures, and sending unemployment to 6.2% from January 2015. Cash rates were cut back to 1.5% in the economic slowdown to stimulate business recovery and employment.
Although it was not technically a ‘recession’ here, we had some major collapses in 2015-6 including: steel maker Arrium (formerly OneSteel, spun out of BHP), Clive Palmer’s Qld Nickel, South Australian copper miner Hillgrove, retailer Dick Smith, restaurant group Keystone, the Masters Hardware chain, QuickSilver, Homeware chain HomeArt, Vocation, building group Home Australia, Linc Energy, Pumpkin Patch, Laura Ashley, and many others.
Covid lockdown insolvency hiatus
When Covid arrived on our shores, State and Territory governments saw fit to lock the entire nation of citizens in their homes and out of their workplaces and businesses. The lockdowns triggered the sharpest and deepest economic contraction since the 1930s Great Depression here and around the world.
Cash rates were cut to 0.1%, the unemployment rate soared to 7.5%, but business insolvency numbers did not rise, they fell!
The number of insolvencies fell dramatically due partly to the government support measures and hand-outs, but partly also because of the measures preventing creditors from suing for debts. Here is how they worked:
To counter the economic effects of the lockdowns, governments acted on three main policy fronts:
1.. Monetary policy measures
These included: cash rate cut to 0.1%, RBA’s bond buying programs (‘QE’ or ‘quantitative easing’) to artificially suppress long-term interest rates, and providing ultra-cheap loans to banks to on-lend to businesses and consumers. (This was supposed to be for lending to businesses, but almost all of it just went on housing loans that inflated house prices)
2.. Fiscal policy measures
These included: one-off payments to pensioners and other recipients, Job Keeper payments, wage subsidies for trainees and apprentices, spending on hastily planned capital works programs.
Many of these policies were aimed primarily at companies as employers – including many companies that pocketed Job Keeper payments instead of passing them on to employees. There were other measures including increases in thresholds for Instant Asset Write-offs, and waving payroll taxes.
These sudden monetary and fiscal policy measures led to booms in spending, jobs, house prices, and booms in pretty much anything else people could think of to throw buckets of free money at – including designer sneakers, ‘meme stocks’, cryptos, and NFTs.
3.. Directly suppressing insolvencies by curtailing creditors’ legal rights
There were also several measures that directly reduced company insolvencies, including:
· increasing the threshold at which creditors could issue a statutory demand on a company from $2,000 to $20,000;
· temporarily extending the time companies had to respond to a statutory demand they received from 21 days to 6 months;
· temporarily relieving directors of personal liability for insolvent trading with respect to debts incurred in the ordinary course of a company’s business (the ‘safe harbour’ provisions).
Essentially, the rules were changed temporarily, to severely curtail creditors’ legal rights, limiting their ability to pursue companies for debts owed, including winding up orders. These measures kept many thousands of businesses alive and also supressed the official unemployment numbers. It made the numbers look good but all they did really was shift the losses from the debtors their creditors instead.
There is little doubt that Australia’s artificial support of businesses and suspension of insolvency laws and creditors’ rights were at least partially responsible for Australia’s very poor labour productivity performance in recent years, especially in contrast to rising productivity in the US, where businesses were allowed to fail if they were unable to pay their creditors, which is the normal cleansing & renewal function of recessions and business cycles (Joseph Schumpeter’s ‘creative destruction’).
Cycle 6 – Post-Covid inflation & business failures – the current cycle
The massive waves of monetary and fiscal stimulus (plus temporary supply restrictions from the Covid lockdowns, and several unrelated weather events) sent inflation soaring. Interest rates were hiked, belatedly and reluctantly, to 4.35% by December 2023 to tackle 7.9% inflation.
When the stimulus measures and bankruptcy law relief ended, so did the hiatus in business failures. Insolvency rates rapidly soared back to well above pre-Covid levels.
Insolvencies running high, but conditions are benign
The current rate of business failures is well above pre-Covid levels, and even above the deep and very painful early-1990s ‘recession we had to have’, but business conditions at the moment are not at crisis levels. Far from it.
· Australia’s overall economy is ticking along nicely – growing at more than 2% above inflation. True, it is all just population growth, but that is precisely what businesses want: more customers arriving!
· Interest rates are not high. The current rate of 4.35% is still low relative to history and relative to inflation. The RBA should, and now probably will raise rates further (as it should have done in 2025 but bowed to political pressure to cut rates instead in an election year.)
· Unemployment is also not high. It has risen from a low of 3.1% in late 2022 to 4.5% now, but this is still relatively low and inflationary / expansionary (according to RBA and Treasury models). We are also at record ‘participation rates’ (the number of people in the workforce as a percentage of working age population).
(The problem is that the jobs growth over the past half-dozen years has been almost entirely due to expansionary government hiring and in government-related ‘nom-market’ sectors like NDIS service providers, health care, aged care, etc. In addition, arbitrary, productivity-free wage rises in the government-related sectors and via our rigid centralised wage-fixing system are adding to inflationary pressures.)
Deeper dive: insolvencies by industry
Here is a picture of monthly company insolvency numbers by industry, since 2013:
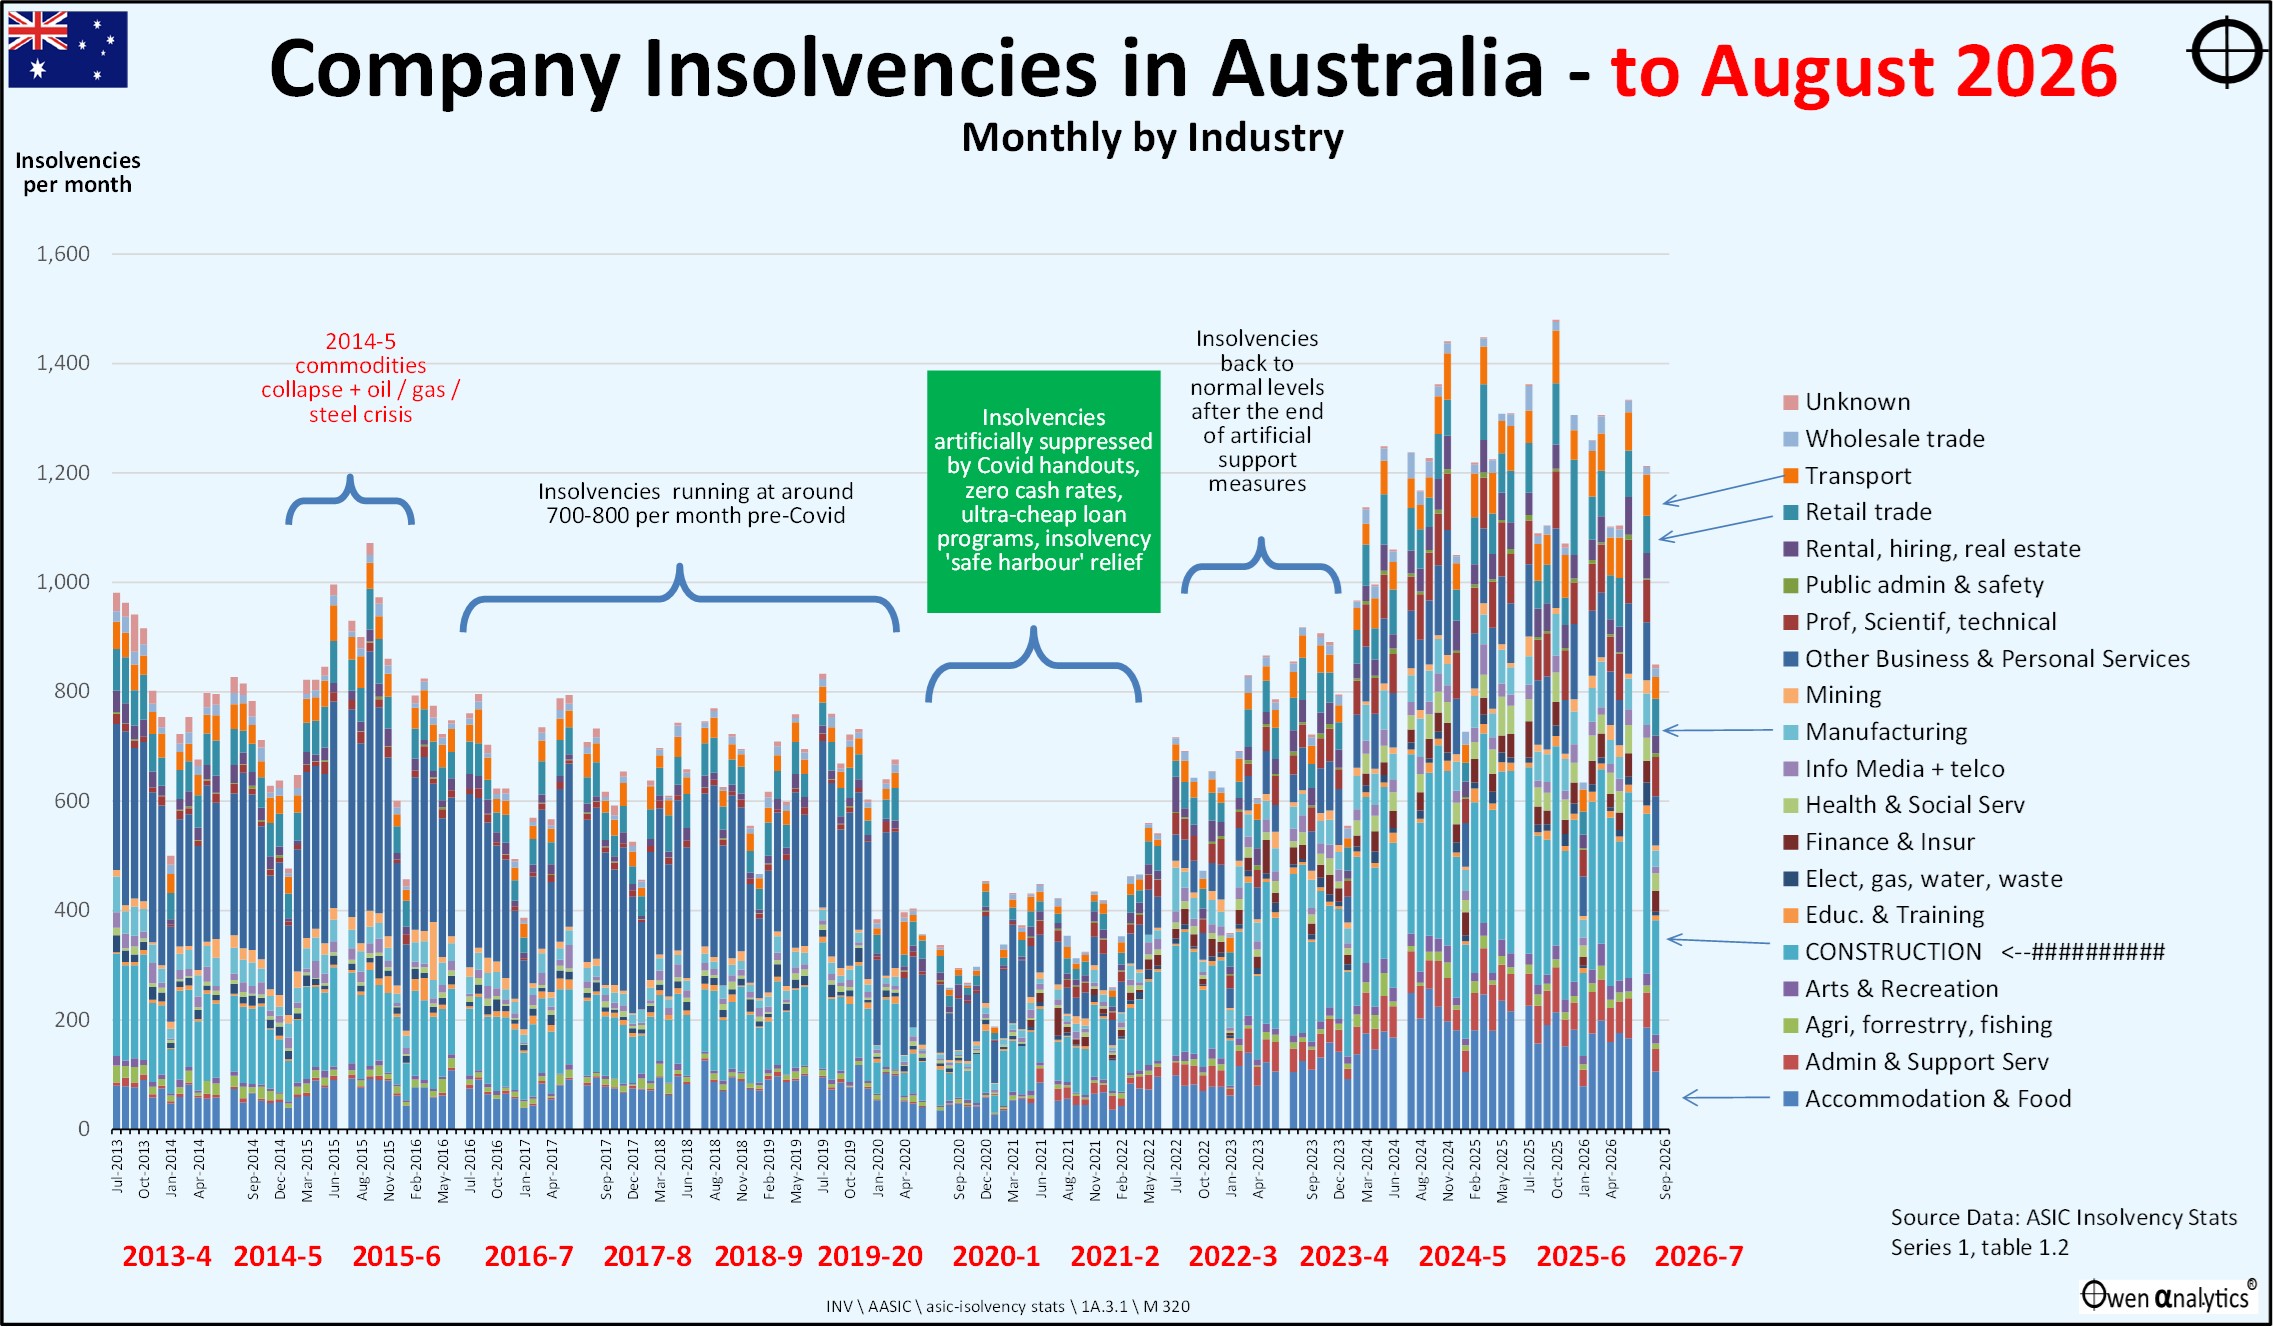
Here we see the policy-induced hiatus in business failures during 2020-1 and 2021-2, but insolvencies quickly returned to pre-Covid levels in 2022-3.
It may well be that the high number of insolvencies in the past three years is little more than a catch-up from the artificially suppressed levels in the Covid years – ie the rebound in insolvencies in 2022-3 and 2023-4 are probably just the failure of the zombie companies that would have failed in the Covid era had it not been for the temporary Covid support measures.
Also, the high level of business failures in 2025-6 is unlikely to be the impact of the three rate hikes this year because the rate hikes in 2026 were just reversals of the three rate cuts last year. Cash rates today are the same as they were nearly three years ago.
But things are about to get worse – fast.
Construction industry the one to watch
Since Covid, the largest bars on the above chart are construction companies (light blue in the lower third of each bar). This is the largest area of concern, given the out-sized impact on other sectors of the economy via consumer confidence and spending.
Australia is ‘construction central’, with an unusually large reliance on building and related industries and trades. Construction companies have been hit not only by rising interest rates since the mad rush into housing fuelled by artificially ultra-low interest rate in Covid, but also by rapidly rising costs of materials and labour, which can be fatal for building companies with fixed price construction contracts.
There have been a number of high-profile construction company failures in the past three years (pre-Bathla) but these were relatively isolated and did not lead to contagion within the construction sector, nor spill-over into other related industries.
What’s new? Government tax attack on housing market
The big difference has been the Federal government’s multi-pronged tax attack on housing investment (and investors generally) in the May budget. This attack has accelerated the decline in house prices, crippled buyer confidence, transaction numbers, and new construction lending and investment.
The Bathla collapse will probably trigger a significant number of related insolvencies among its 1,000+ sub-contractors and trade creditors, plus probably many of its customers (the lowest-ranking unsecured creditors) will see their deposits lost or frozen.
The Bathla collapse has also forced property construction lenders (banks and ‘Private Credit’ funds) to tighten credit, raise interest rates, and take more hands-on control of firms in trouble – which often means fire sales at low prices.
I will update this in a few months so we can see how the story unfolds.
Stay tuned!
‘Till next time – safe investing and stay healthy…!
[Disclosure: I was a senior lender (including senior exec running national business units) at major banks through the 1980s-1990s cycles, including corporate, commercial, and property lending. Half of my personal wealth has come from residential properties over the past 40 years across three States (the other half from shares), but I currently own no investment properties. I have no investments in, nor affiliations with, any Private Credit funds. I have consistently warned investors, advisers, investment committees and portfolio managers to be extremely wary and stay out of Private Credit since the start of the recent Private Credit boom.]