Share Market Pricing per country
This chart plots share market pricing for the 20 largest share markets in the world at the start of 2024, using two of the most common measures of pricing – ‘price/earnings ratios’, and ‘dividend yields’.
The ‘price/earnings ratio’ (or ‘p/e’) for a given market is the price index for the market divided by the aggregate reported profits for the most recent 12 month period. It is essentially the current price per dollar of profits generated by the market.
The ‘dividend yield’ is the aggregate cash dividends for the most recent 12 months, divided by the broad price index for the market. It is the cash yield per dollar of current value.
The upper-left sector is the most expensive – with high pricing per dollar of profits (high price/earnings ratio), as well as high pricing per dollar of dividends (ie low dividend yield).
The lower-right sector is the least expensive – with low pricing per dollar of profits (low price/earnings ratio), as well as low pricing per dollar of dividends (ie high dividend yield).
The size of the symbol for each country represents the relative size of each country’s share market.
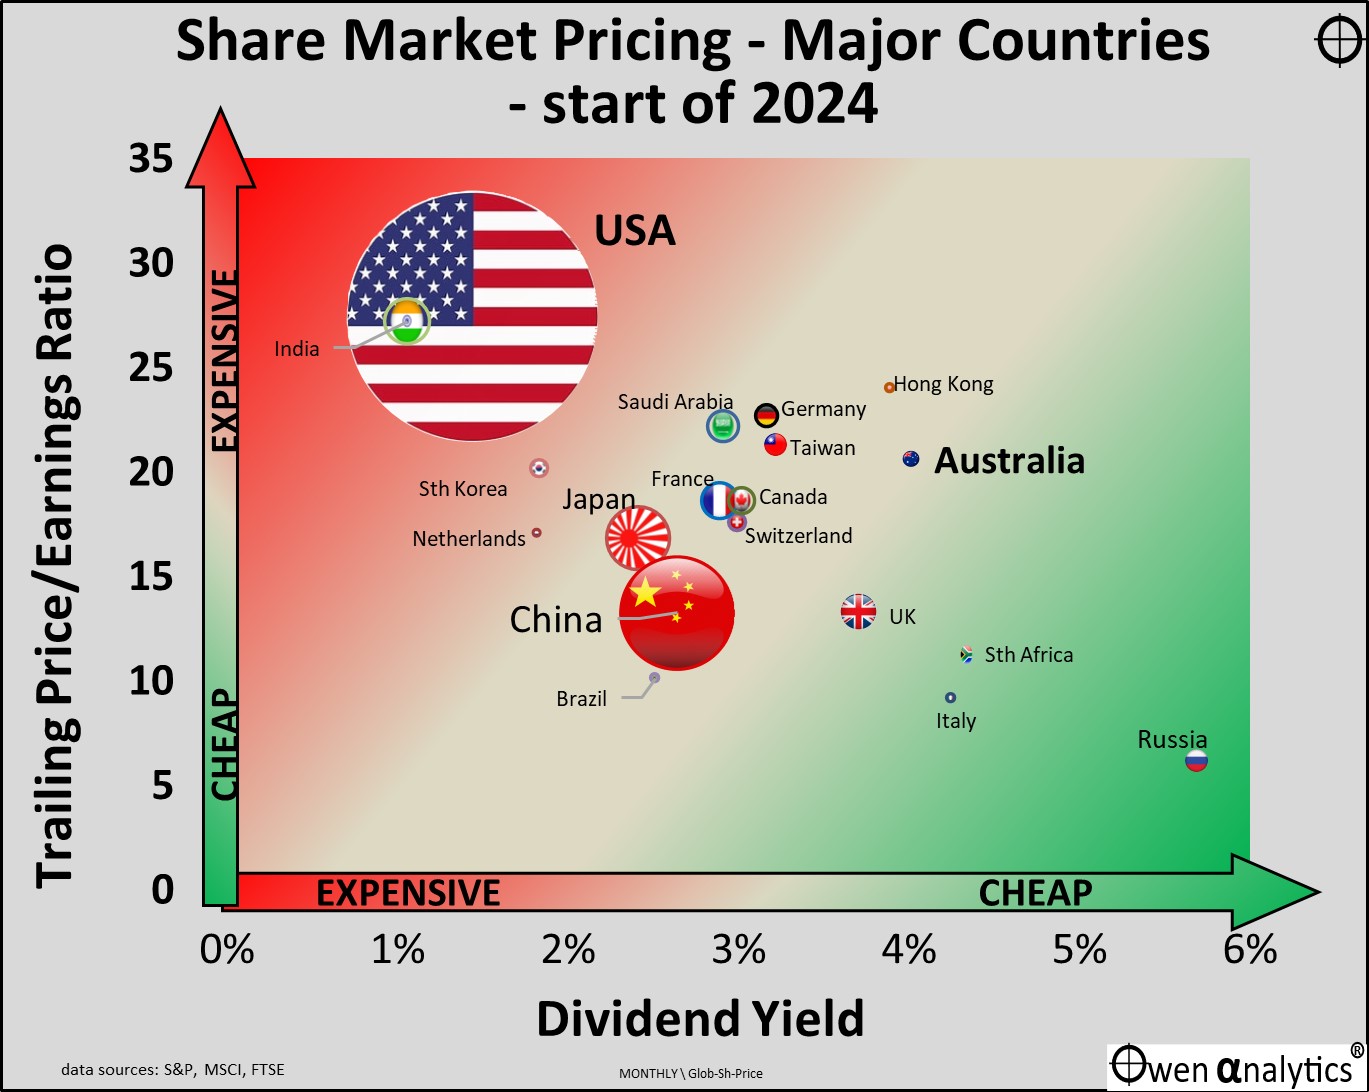
World share markets are expensive because the US market is expensive
The US stands out for two obvious reasons. First is it’s sheer size, at around half of the total market value of ‘investable’ world share markets.
US listed companies account for US$49 trillion out of the world total of US$106 trillion, although the US accounts for just one fifth of companies by number (3,000 US companies out of a total of 15,000 investable companies on world stock markets).
The second stand-out feature on the chart is the fact that the US is the most expensive market by a big margin – on both measures – ie significantly higher price/earnings ratio, and significantly lower dividend yield.
The US market is the sole reason for the current expensive level of pricing of the overall global share market.
Without the US, the overall global share market would be much more reasonably priced, at 17.5 time earnings and a dividend of 2.7%. Ex-US world pricing would be roughly where Japan is on the chart.
The only other country in the upper-left ‘Expensive’ end of the chart is India – see note below.
US companies are not all ‘expensive’
The US market is expensive overall because of a small handful of tech companies, and two in particular - Amazon and Nvidia. We will cover the pricing ‘lumpiness’ of US companies in a separate story.
‘Expensive’ does not mean ‘poor value’ or ‘sell’
There are plenty of people who have done very well from US tech stocks – including anyone with a global shares index fund in recent years.
There are also plenty of very wealthy and smart people who are more than happy to hold, and buy more, of stocks like Amazon and Nvidia at 80 times earnings, Tesla at 70 times, Netflix or Adobe at 50 times, Microsoft at 40 times, Apple or Meta/Facebook or Alphabet/Google at 30 times earnings.
Dividends – as sign a company has run out of ideas!
Dividends are often seen as a sign that a company has run out of ideas, or that it lacks the confidence or opportunity to generate high returns on equity.
For a ‘growth’ stock, paying dividends is a sign of failure! No self-respecting company that can generate a higher return on equity than its cost of capital would want to pay a dividend.
For example, out of the globally dominant US tech stars mentioned above (Amazon, Nvidia, Tesla, Netflix, Adobe, Microsoft, Apple, Meta/Facebook, Alphabet/Google) – only two of these actually pay dividends – Apple and Microsoft. Arguably, these two started paying dividends when their high-growth era ended - after Steve Jobs died and Bill Gates left.
Therefore, for a genuine growth company that is likely to keep generating returns on equity well above the cost of capital, and likely to keep growing earnings at well above the market average, a zero dividend yield does not seem to deter investors at all. Until the party stops, anyway.
See also:
· US market - ‘Shiller/CAPE’ ratio update: It’s flashing orange. . . but what action should we take?
‘Cheap’ does not mean ‘good value’ or ‘buy’
At the extreme ‘cheap’ end is Russia, which is dominated by oil/gas stocks controlled directly and/or indirectly by Putin and his henchmen. The Russian market is trading on just 7 times earnings, and a high dividend yield of nearly 6%.
This does not make it ‘good value’ or ‘good buying’.
Australia - how do we rate?
Relative to other countries, Australia appears more or less reasonably priced at around 20 times earnings, and a dividend of 4% (excluding 'franking credits’).
However, a p/e of 20 is well above (ie more expensive than) Australia’s historical average.
Also, Australia’s 4% dividend yield appears high (better value) relative to other countries, but it is actually lower (more expensive) than historical averages for the local market.
We cover pricing of companies in the Australian market in a separate article.
See:
· Australian share market ‘Shiller/CAPE’ ratio – not over-priced like the US. Uncle Sam still calls the tune
Countries relative to each other, not relative to their historical averages
It is important to note that today’s chart is purely a comparison of countries relative to each other.
This country-against-country comparison is a handy way of seeing relative pricing in a global context, but it ignores differences in circumstances and structural conditions within each market.
For example, the Indian share market has always paid very low dividend yields relative to most other countries, due to its relatively low pay-out ratios, as Indian companies have always been financed mainly by domestically sources, especially retained earnings.
India’s lack of reliance on foreign capital has been a strength at times (during crises like the 1997 Asian crisis and 2008-9 GFC), but also a weakness as it has hampered growth.
At the other extreme, the Australian share market has always paid high dividend yields relative to most other countries, due to relatively high pay-out ratios, as Australian companies on the whole have been financed largely by external capital (secondary raisings), and foreign capital.
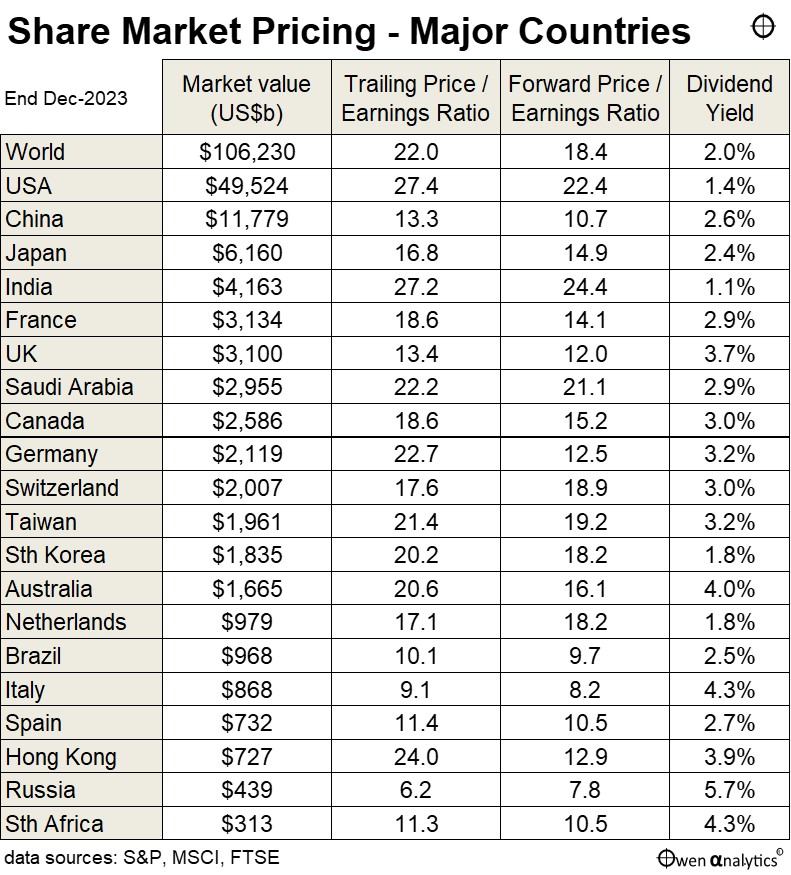
‘Trailing’ -v- ‘Forward’ earnings ratios
The above chart uses actual reported company earnings (net profits) for the most recent year 12-month period. Thus it is ‘historical’ and backward-looking.
As investors, we are investing for the future, not the past, so another common measure is the ‘forward’ price earnings ratio. This is the current price divided by an estimate of future profits in the coming year.
These forward estimates have problems of course, as they are based on all sorts of assumptions about future demand, sales, input costs, wages, write-offs, interest rates, exchange rates, and a host of other variables.
The table below sets out both the ‘trailing’ and ‘forward’ price/earnings ratios for each market.
See also:
· Australian share market ‘Shiller/CAPE’ ratio – not over-priced like the US. Uncle Sam still calls the tune
· US market - ‘Shiller/CAPE’ ratio update: It’s flashing orange. . . but what action should we take?
· ASX reporting season in 4 charts - $40b wiped off profits! - where did it go, and why?
·