The All Ordinaries index hit a peak of 6,853 on 1 November 2007, but it is barely above that 16 years later. Why?
Is the local share market in terminal decline? Has it lost its mojo? Is it ever going to get back to growth? Is it time to give up on the local share market and look elsewhere?
Growth everywhere, but not in share prices
How can share prices remain flat for the past 16 years when, over the same period:
- The Australian population has grown by 26%
- The overall Australian economic pie (GDP) has more than doubled in size.
- The aggregate value of ASX listed companies has increased by 51% (that’s mainly because a lot of shareholder-diluting capital has been raised over the period)
- Aggregate profits for ASX listed companies have risen by 23%
- Aggregate dividends have risen by 83%
Despite all of this growth over the past 16 years, why have share prices in aggregate gone nowhere?
Of course, amongst individual stocks, there have been wide variations over the 16 years:
- There have been some winners (e.g., CSL, FMG, Transurban, CBA, Macquarie, Wisetech, JB)
- Some losers (e.g., Telstra, WBC, NAB, ANZ, ASX, QBE, all property trusts including Goodman)
- And many that have gone nowhere (e.g., Wesfarmers, Woolworths, Qantas, BHP, AGL)
However, here we are talking about the share market as a whole. Anyone can buy this with a low-cost passive index fund – which would have beaten the vast majority of ‘professional’ fund managers and individual investors.
Frankly my dear . . . we need to include Franking Credits in reporting and portfolio planning
(We should also deduct inflation from returns to get real returns - but we'll leave that for another day.)
Timing is everything!
That headline about 16 years of nil growth is true – but it is only a fraction of the truth.
By carefully selecting specific start and end points, you can come up with pretty much any story you like!
Those headlines selected 1 November 2007 as the start date because that just happened to be the very top of the pre-GFC credit / China boom, immediately before the GFC crash.
Subsequent returns are always going to be very poor if measured from the tops of wild booms. Big market crashes generally take many years to recover, and the recovery from the GFC crash has been similar to past major crashes.
Pick a different start date, and you get a different story!
Instead of picking the start date at the top of the pre-GFC boom, if we start at the bottom of the GFC crash (6 March 2009 in Australia), then we see that the All Ordinaries index actually has risen +133% in the 14.7 years up to now.
This is an above-average price gain of 6% per year.
The lesson is simple: if you buy in a wild speculative boom (they are easy to spot at the time), even if you buy a diversified index fund covering hundreds of stocks across all industries, then you will probably have to wait many years to get back to square one.
‘Buy high - sell low’ – history repeats in every cycle
The sad fact is that the tops of wild speculative booms are when hoards of new investors finally pluck up the courage to enter the market. They have been cautiously watching prices rise for several years, and they finally succumb to ‘FOMO’ – the 'Fear Of Missing Out', after seeing their friends and family make 'easy money'.
Equally, after the inevitable crash, in the depths of despair at the bottom of busts, most investors are shell-shocked and can’t bring themselves to buy the very same assets at a fraction of their boom-time prices.
It is hard enough getting people to not to completely sell out at the bottom, which turns temporary price falls into permanent losses of capital.
The charts
The main chart in the upper section shows the daily price index since 1920 (All Ordinaries and predecessors).
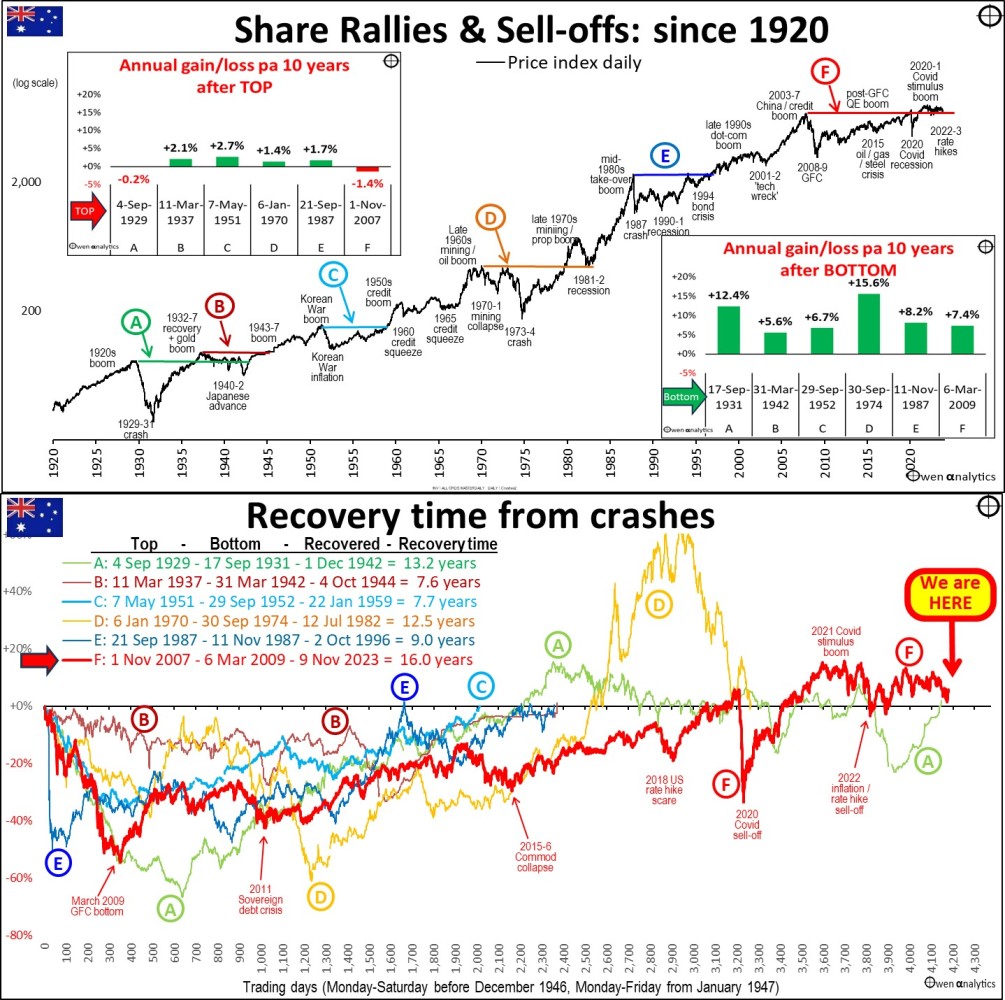
Also in the upper chart are two smaller charts we will cover below.
The price index has risen by an average of 5% per year over the past century, but there are no straight lines – ever. There have been a few booms and busts along the way – about once per decade.
I have highlighted six major busts from which it took many years to recover back to square. From the tops of the booms, it is not unusual to have to wait a decade or more for the market to recover back to the boom-time top.
Each of the cycles is shown from a common start point in the lower chart above.
In Cycles B, C and E – it took 8 to 9 years to recover boom-time peak prices.
In Cycles A, D, and F – prices took more than 10 years to recover (including cycle F, which we are still struggling to recover for good, and put behind us).
Cycle A – the 1929-1931 crash
The 1929-1931 crash at the start of the Great Depression was our deepest market fall, but it was shallower than the US market. Our market started recovering a year earlier than the US market (we were quicker to devalue our currency, we had no banking crisis, and our boom market was less speculative and less over-priced).
The local market actually recovered its September 1929 high by late 1936 (seven years), but it fell back from early 1937 through to March 1942, in the early stages of WW2. It finally recovered its September 1929 high by the start of December 1942.
Cycle B – the 1937-1942 lead into WW2
The market fell from March 1937 in the lead-up to WW2, but started to rise in April 1942 when the US started to look like defeating Japan in the South Pacific. Prices finally recovered the 1937 high in October 1944, during the WW2 boom. The recovery would have been quicker, but wartime price controls limited share price rises.
Cycle C – 1951-2 Korean War inflation spike
This was a sharp share market fall as the government aggressively tightened fiscal and monetary policy to fight 25% inflation caused by the Korean War and lifting of WW2 price controls.
Cycle D – 1970-1 mining crash + 1973-4 property/finance crash
The double crash was nearly as deep as the 1929-31 crash and took nearly as long to recover (12.5 years), during the stagflation 1970s. Prices had recovered their January 1970 high by September 1979, soared in the 1980-1 mining/property boom but then fell in late 1981 and first half of 1982 in the early stages of the 1981-3 recession. Finally put the January 1970 high behind it in July 1982.
Cycle E – October 1987 crash
This was our sharpest and third deepest crash, and only recovered the September 1987 high nine years later in October 1996.
Cycle F – 2008-9 GFC
This is the one we are still struggling to recover. It included not only the 2008-9 GFC crash but also some recent sell-offs during the recovery:
- 2011 sovereign debt crisis
- 2015 China slowdown/commodities collapse
- Late 2018 US rate hike scare
- Feb-March 2020 Covid lockdown sell-off
- and now the 2022-3 inflation/rate hike sell-off
The index actually did recover the November 2007 high a few times in late 2019, but then fell back below square in the Feb-March 2020 Covid lockdown sell-off. It recovered again in December 2020 and rose in the 2021 Covid stimulus boom, but fell back below par during the 2022 inflation/rate hike sell-off.
The index has been staying a little above the 1 November 2007 high of 6,853 since 13 October 2022, and almost fell back to it on 31 October 2023. Today (10 November 2023) it is just 5% ahead.
If we can finally move ahead and not retreat to 6,853 again, we will finally rule a line under it and call the cycle over as at 13 October 2022, a fraction under 15 years from the November 2007 top.
Ten-year returns from different points in time
Below are the two smaller charts that are embedded in the main chart above. These show the actual price gains/losses over 10-year periods starting from the tops of booms (left chart), and from the bottoms of busts (right).
As expected, the left chart shows virtually nil returns in the 10 years starting from the tops of booms.
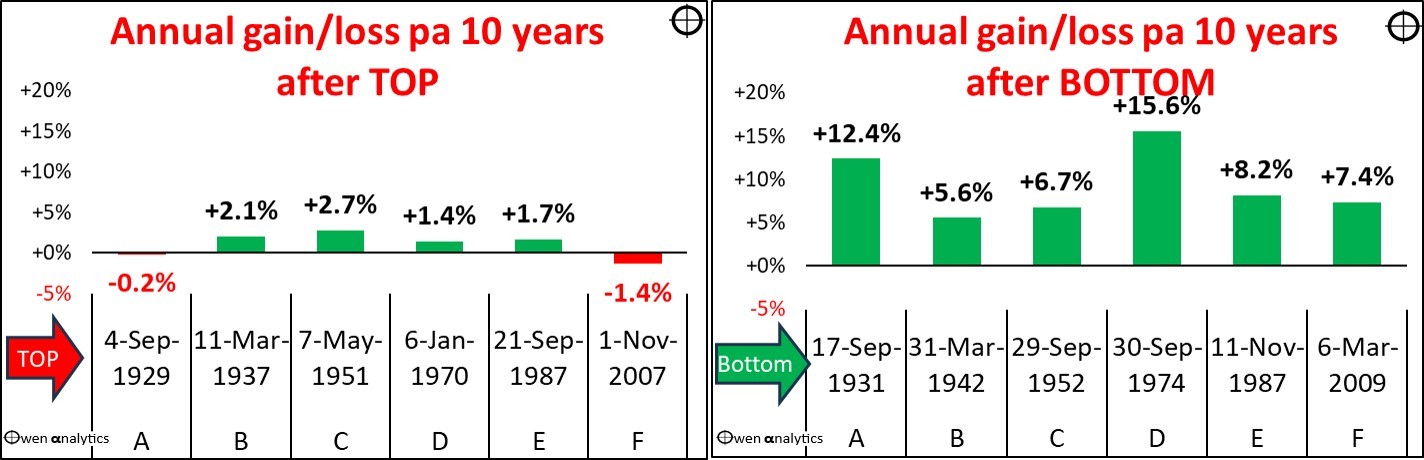
This shows that the current cycle (F) has had very poor 10-year returns from the top, on par with all the similar prior cycles.
On the other hand, the right chart shows above-average returns in the 10 years starting from the bottoms of every one of the busts. When you buy cheap, you get above-average returns.
Where are we now?
The current cycle (F) has been a little longer than prior similar cycles, probably because both fiscal policy (government spending/tax policies) and monetary policy (interest rates and QE) were far too loose for far too long – in Australia as well as in the US and elsewhere. This just prolonged and worsened problems and crises.
However, monetary policy is finally being restored to ‘normal’, inflation rates are retreating from their 2021 highs. However, fiscal policy is still loose and inflationary, and global trade and military tensions are rising, so there are a few challenges yet.
Pricing very different now
The big difference is pricing of the local share market.
The fact that the overall price index has remained flat for 16 years despite aggregate profits for ASX listed companies rising by 23%, and aggregate dividends rising by 83% over the period, tell us that we get 23% more profits, and 83% more dividends per dollar of shares we buy now, compared to what it bought at the top of the pre-GFC boom.
The market was substantially over-priced in 2007, but it is much cheaper now. We are not in a market crash or correction at the moment, so prices are not super-cheap as they were in early 2009 at the bottom of the GFC crash, or in March 2020 at the bottom of the Covid lockdown crash.
However, the market is certainly much better value than it was at the top of the market in 2007, and at the top of the 2021 Covid stimulus boom.
See: Australian share market ‘Shiller/CAPE’ ratio – not over-priced like the US. Uncle Sam still calls the tune, but Australia is better placed for growth
The local share market is not ‘broken’.
We have lagged the US market because we don’t have a big tech/online sector. That has taken the US market much higher than ours, but the US will be hit much harder when the boom ends, as they always do.
You could look at the past decade and a half in two ways:
- no growth for 16 years if you start from the top of the pre-GFC boom
- above average growth for 15 years if you start from the bottom of the GFC bust
The first makes for a great headline to scare people.
The second is equally true, but good news rarely makes the headline.
Let’s remain sensible
The reality is that you probably neither bought most of your shares at the top of a boom, nor at the bottom of the bust. So the headlines that pick specific start and end periods don’t apply to you or me anyway.
You probably did what sensible investors did –
- just kept to your strategy,
- probably buying regularly,
- but avoiding paying too much in the booms,
- buying ‘in dips’ with cash hoarded from reducing purchases and/or taking some profits in the booms.
- Do your own research, form your own views of value.
- Never follow the crowd.
- Ask plenty of questions. If people give you answers you don’t understand, it’s because they don’t want you to understand. Just ask more questions until you are satisfied, or walk away.
Although individual companies come and go - some multiplying in price, and others going bankrupt – it is extremely unlikely every company in the broad index will go bankrupt, so diversification using low-cost index funds avoids total capital loss, and is likely to beat the vast majority of active fund managers and individual investors.
If you do find an active fund that is widely diversified (it is easy for a concentrated fund to beat the index from time to time, but that is always temporary), by all means use it while it works, but retain a very close eye on it.
See:
Most active fund managers continue to destroy value and line their pockets with your money – why do we let them?
Few active fund managers add value. But even value-adding managers almost always fade over time. How to pick the good ones before they lose it?
Chasing other sources of growth?
Don’t follow the crowd rushing into ‘private assets'.
‘Private’ just means opaque structures, fudged valuations, hidden leverage and/or derivatives, insider deals, and layers of fees.
‘Private equity’, including ‘venture capital’, has not fully come clean with valuation downgrades in the recent slump and evaporation of IPOs and trade sales as exit mechanisms. For every dollar you buy, you are probably actually getting only 60 or 70 cents worth of assets in the current environment.
‘Private credit’ (or ‘private debt’, which is the same thing) is essentially concentrated non-bank lending, without a bank’s loss-bearing capital buffers, regulations, and without a bank’s lending, loss-recovery, and risk management mechanisms, or government guarantees. I know we all hate banks, but they still have a lot more protections in place to protect creditors (investors) than non-banks.
Non-bank lenders mainly lend to borrowers that have been rejected by banks, and they are the first to be hit when recession strikes. Those private debt/credit funds pay nice 8% or so in interest. . . . . . until they don’t. Their unit prices are a nice neat fixed $1. . . . until they aren't.
Bonds – maybe worth a look in a decade or so!
‘Till next time – happy investing!