Greetings fellow investors!
Sensational headlines this week - Australian government debt hitting A$1 trillion and the US hitting $40 trillion! But how serious are they really?
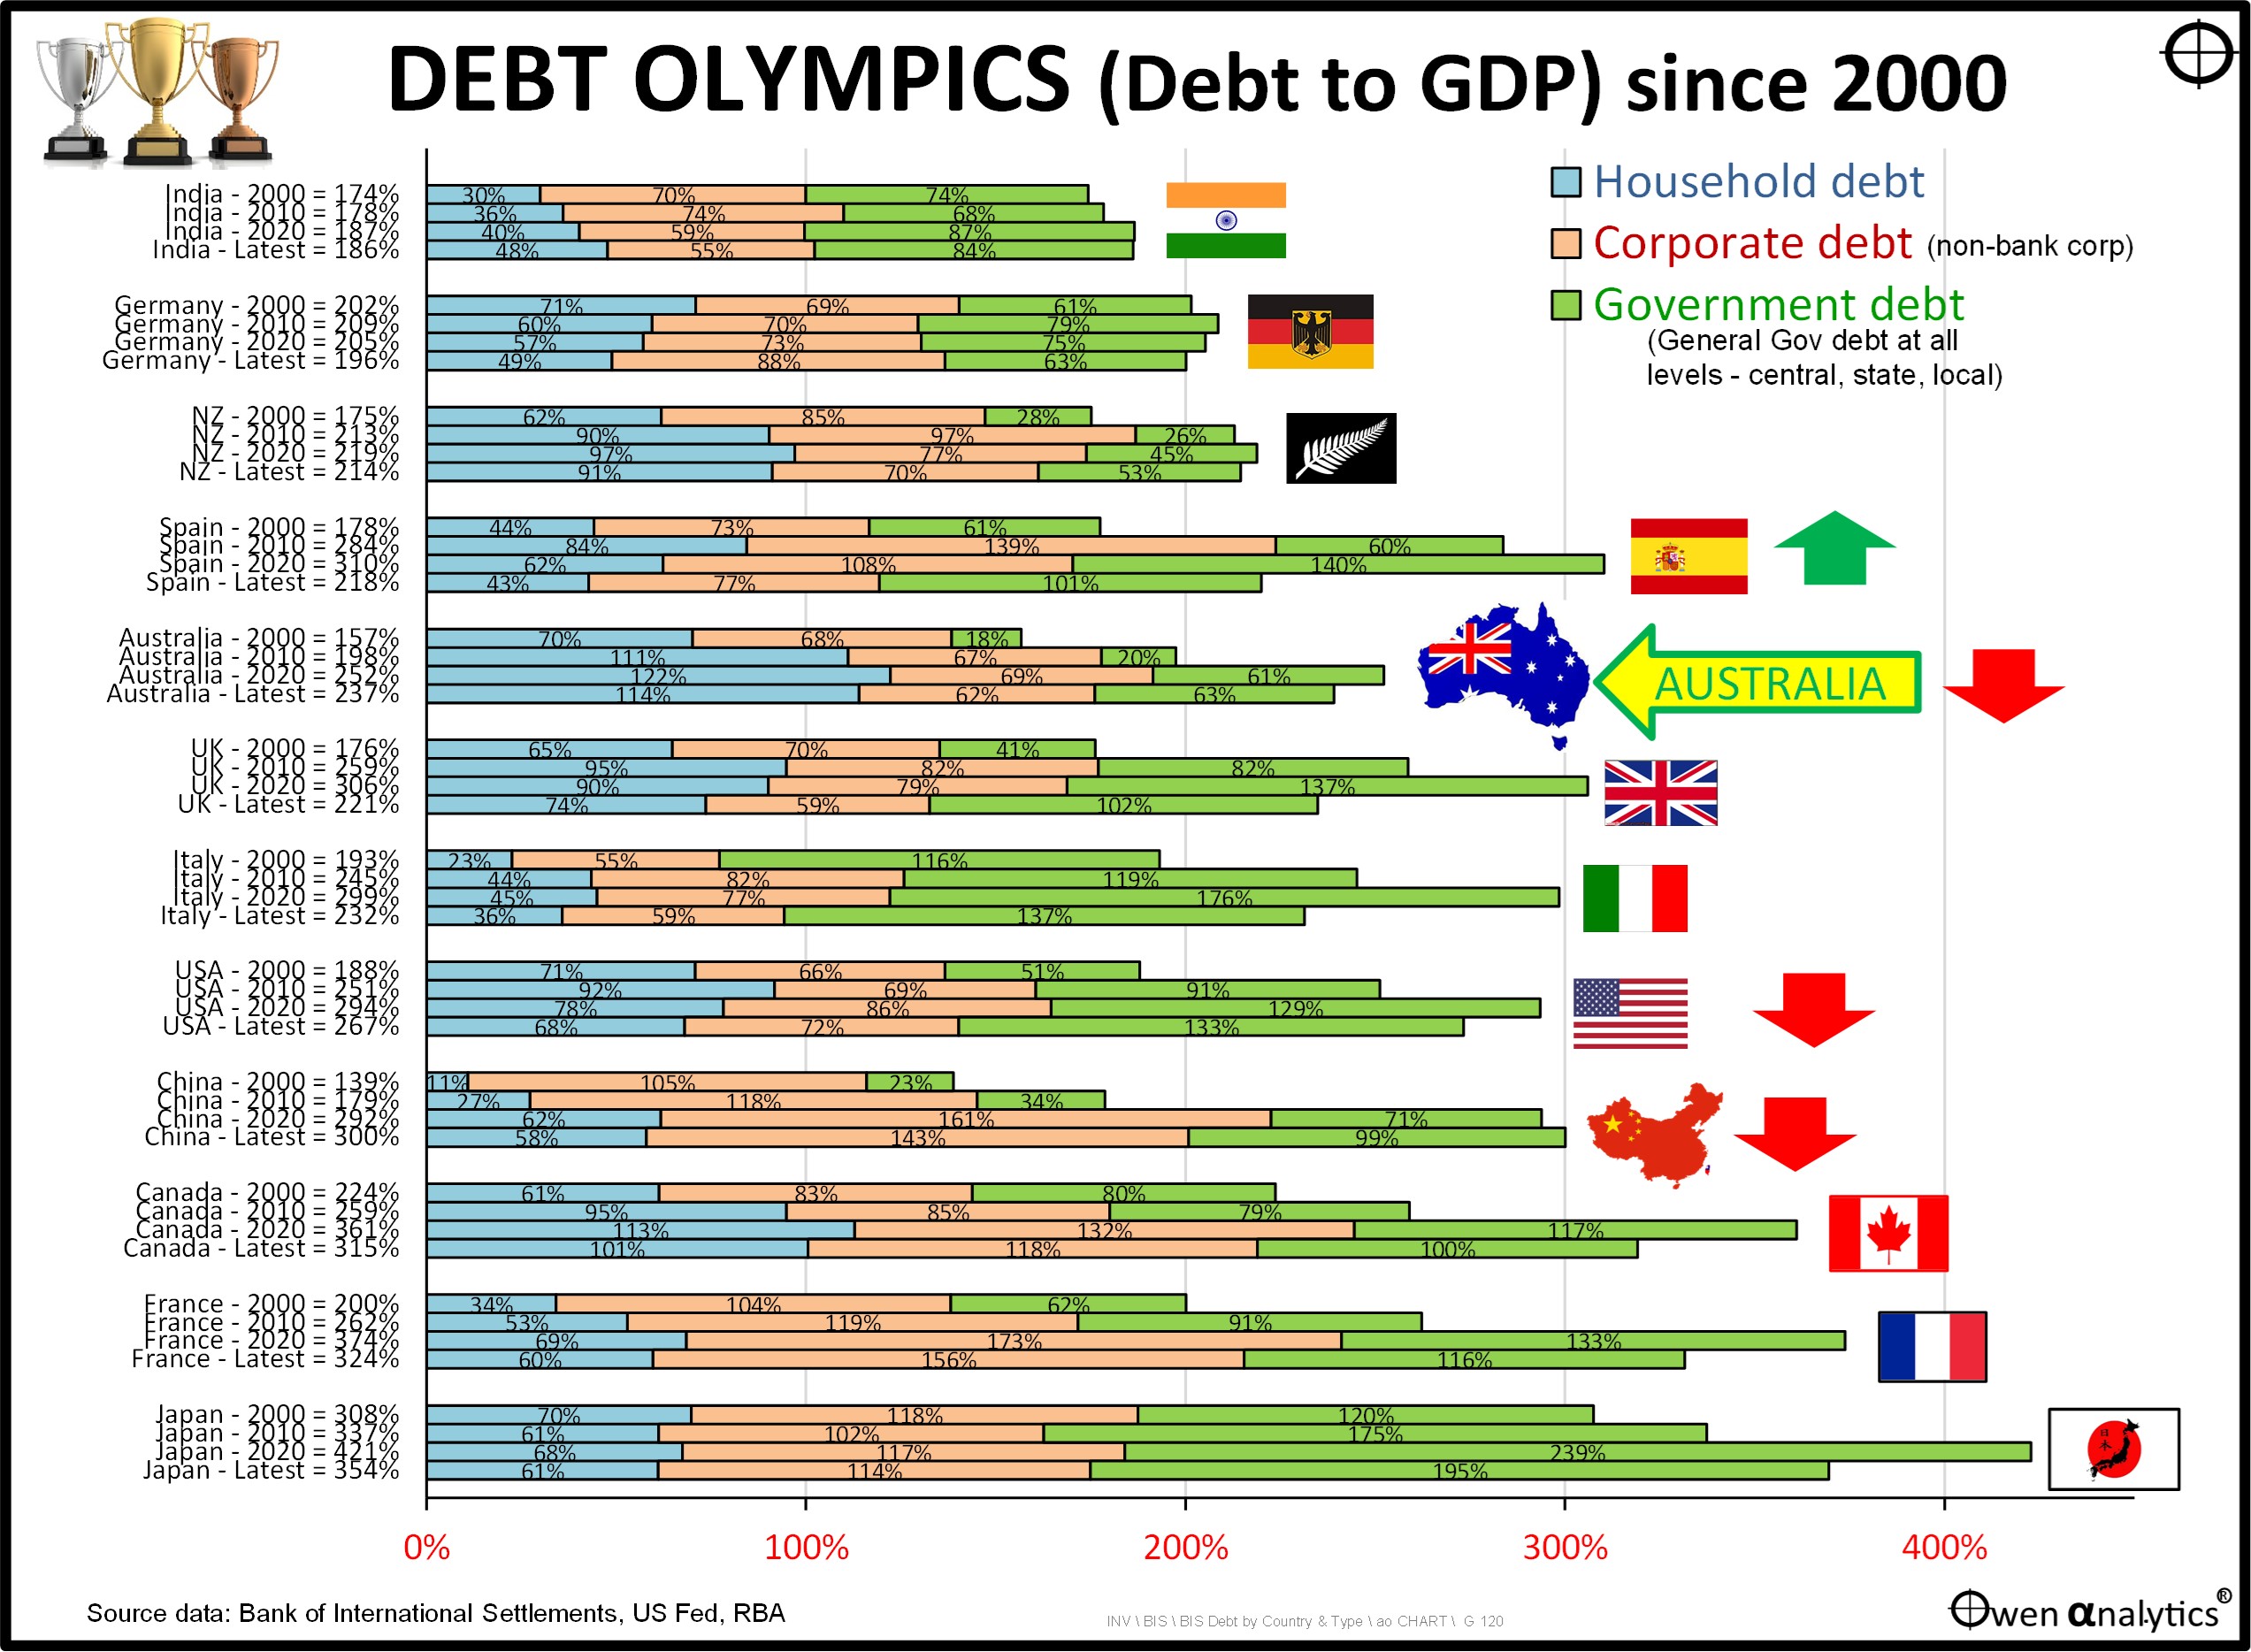
Here is an update of my ‘Debt Olympics’ chart showing all levels of debt (government, corporate, household) since 2000.
The chart shows gross debt as a percentage of national income (GDP) for a dozen major peer countries.
Each country has four bars:
· The top bar is the debt levels in 2000 – at the top of the late 1990s tech boom,
· 2010 - after the debt-build-up in the 2000s credit boom, and the hand-outs and bailouts in the GFC,
· 2020 - after the government deficit spending binges and bailouts in the Covid lockdown recession,
· Latest - the most recent data
Each bar has three sections representing the main types of debt:
· household debt (blue),
· non-bank corporate debt (pink), and
· government debt, including all levels of government (green).
Countries are sorted from lowest latest debt burden (top) to the highest (bottom).
Dramatic build-up of debt over past 25 years
The first striking feature in the chart is the dramatic build-up of debt loads from since 2000, first escalating to 2010 and then escalating further to 2020 - indicated by the top three bars for each country.
These were the ‘Greenspan put’ years of ultra-low interest rates following the end of the late 1990s tech bubble, then further ultra-low interest rates and money printing following the 2008-9 GFC, and then even lower rates and money printing again in the Covid lockdown recession.
The largest contributors to these increases in overall debt loads during these decades were government debts (green bars). Despite the fact that monetary policy of cheap debt mandated by governments (and their central banks) during crises is supposed to be aimed to encourage Corporates and Households to borrow and in turn increase spending and employment, in reality it was the Governments themselves that gorged on their own government-mandated low interest rates and cheap debt even more so than Corporates or Households!
The only exceptions to this trend of rapid debt build-up were our frugal friends at the top the table: India, Germany, and New Zealand.
Those wonderful years of low inflation and ultra-low interest rates are over. Borrowers must now service and refinance those debts at much higher interest rates.
Debt loads on the way down post-Covid
A second stand-out feature of the chart is the fact that that every country except China has managed to reduce their debt loads (relative to national income) since the 2020 peak debt levels.
China is still grappling with enormous debts from its still-declining property construction sector.
Wooden spoon – Japan still
In terms of total debt loads, Japan retains the wooden spoon at the bottom of the table by a big margin. Japan is locked in a death spiral – literally – with ever-increasing welfare bills for its aging/dying population, declining workforce, shrinking tax-payer base, and contracting total population.
Japan cannot reverse this spiral. It is terminal. However, as more than 90% of Japanese government debt is owed by Japanese pension funds, institutions, and arms of government including the BOJ, the problem will probably be solved via ‘internal’ defaults / restructures where Japanese pensioners end up paying the price in the form of lower pensions.
There is no need for Japan to go cap in hand to beg for leniency from external creditors, which is what the US will need to do.
Big movers
At the top of the table with the lowest debt loads, the best (lowest debt) countries remain the same – India, Germany and New Zealand. Likewise, at the bottom of the table with the highest debt loads, the worst three debtor countries remain the same since my last report in 2024 – Japan, France and Canada.
However, there has been much movement in rankings in the middle of the table.
The biggest move DOWN the table (higher debt load) has been China.
Note that In China, although much of the debt is labelled ‘Corporate’, in reality most is state-controlled entities, propped up by endless rounds of refinancing into the never-never by state-controlled banks, terrified of the social unrest that may be unleashed if unprofitable ‘zombie’ companies were allowed to collapse en masse.
The biggest improver – moving UP the table with lower debt load to GDP has been Spain – over-taking Australia and into the ‘low debt’ group at the top of the table.
Australia:
Australia has one of the lowest overall debt burdens in the world. Of our major country peers, only India, Germany, NZ and now Spain are lower. (Also lower, but not on the chart are: Türkiye, Indonesia, Mexico, Poland, Argentina, Saudi Arabia, Hungary, Chile and Brazil)
Although we have relatively low levels of debt overall, our mix of debt is very different to our peers, and therein lie some real challenges for Australia.
Our Government and Corporate debt levels are relatively low, but Household debt is the highest. (Only Switzerland is a fraction higher)
Australia’s Government debt
Australia had virtually no federal government debt going into the GFC, but the government quickly racked up debt to finance the GFC deficit spending sprees. Government deficits were reduced back to zero by 2019, but soared again to fund the Covid deficit spending sprees.
Other countries everywhere also racked up debt in the GFC and Covid, but Australia’s government debt levels are still the lowest in the world (even including state debts), thanks to windfall mining tax revenues in the long post-2001 mining/China boom.
Australia’s Federal government gross debt of A$1 trillion is actually LOW in historical terms (it only seems BIG because of inflation).
It is also relatively LOW in world terms at just 34% of GDP.
Historically, our problem with government debt has been the STATES. Currently, State & Local gov debts add another $820B, bringing total government debts in Australia to A$1.8 trillion, or 63% of GDP. This is still among the LOWEST in the world.
(Also lower than Australia but not on the chart are: Russia, Türkiye, Luxembourg, Switzerland, Denmark, Sweden, Ireland, Chile and Netherlands)
New Zealand also remains a fraction lower than Australia. NZ has fewer levels of government, no upper house, but also has none of Australia’s windfall mining revenues.
For more on Australian government debt see:
· Pre-budget quick quiz - Which side has a better record on Fiscal Responsibility: Labor -v- Libs? (12-May-2026)
Australia’s Corporate debt
Corporate debt levels in Australia have shrunk (relative to GDP) in recent years. The big banks used to specialise in business lending, but since the GFC and Hayne Royal Commission they have retreated and are now little more than bloated building societies lending mainly on housing. They much prefer mortgage lending over business lending because it requires half the capital and a fraction of half the brains.
The low level of corporate borrowing is a real policy problem for Australia. Companies are the engine room for employment, productivity, and economic growth, but the big dinosaur banks have long since lost the skill and will to lend to business.
There is a booming new industry in ‘private credit’ (also called ‘private debt’), including direct lending by industry funds.
‘Private debt/credit’ is just a fancy name for 'non-bank lending'. This is being done without the equity buffer of bank balance sheets, without scrutiny or regulatory supervision, without the strict disclosure rules that apply to banks, and without the credit management systems, collections, and work-out skills the banks used to have.
It will take decades for the new ‘private credit/debt’ industry to get up to the standard the big banks once had. (Spoiler alert: lending money is easy; pricing for risk and getting the money back in a recession is a lot harder! Most local funds have highly concentrated exposures to the property development / construction sector. Big losses are on the way in the next recession.)
Australia’s Household debt
Australia is the perennial winner of the wooden spoon for the highest level of household debt relative to national income (only Switzerland is higher). Well before the GFC, Australia had the highest levels of household debt in the world, and has increased its ‘lead’ even further since then.
Our high household debt levels, combined with the fact that the majority is on floating interest rates, makes Australian households (and the overall economy) more sensitive than any other country monetary policy based on short term interest rates.
Why don’t we have the CHEAPEST housing and LOWEST housing debt in the world, instead of the highest?
Australia should have the most affordable land and housing in the world for three reasons:
-
-
- We have the sparsest population in the world (ie we have the most land per person: an average of 298,000 square metres, or 74 quarter-acre blocks, per head of population). True, much of the land is uninhabitable, but Australia’s habitable land ratio is the highest in the world, higher than Norway, Canada, and Japan.
- We have an abundance of cheap building materials (dirt, rocks, timber, iron ore & coal for steel, bauxite for aluminium, silicon for glass, copper, nickel, lithium, lead, tin, etc, etc).
- We have giant, lazy, well-capitalised banks that do almost nothing but lend on housing! (actually, therein lies a big part of the problem).
But somehow, we have the most expensive housing in the world, propped up by the highest levels of household debt in the world.
Fortunately for highly indebted borrowers, house prices have been kept relatively high by strong demand (mainly from immigration) and by intractable supply constraints (‘NIMBYs’, local councils, and high taxing state governments).
A looming housing /debt crisis? Probably not yet
As long as house prices are kept relatively high (thanks to immigration, NIMBYs, and property taxes), and unemployment remains below say 10% (unemployment reached 10.4% in the early 1981-3 recession, 10.9% in the 1990-1 recession, but only 5.8% in the GFC), another widespread housing / foreclosure / bankruptcy crisis is unlikely here in the current cycle.
Property developers / builders will be hit hard (private credit funds), but banks and housing should hold up relatively well. Banks are much better capitalised now than in prior property collapses (1890s, mix-1970s, early 1980s, early 1990s, and a large majority of regular housing borrowers have relatively low Loan-to-Value ratios thanks to inflation.
USA:
Along with China, the other big mover down the table – in relative terms – is the USA.
$40 trillion of Federal debt (123% of GDP), plus $1.1 trillion of State debt, and $2.3 trillion of Local government debt bring the US total government debt to $43.4 trillion, or 133% of GDP. This is more than twice that of Australia.
Under both Biden and now Trump’s second term, the US is literally spending like there’s no tomorrow, with no end in sight for its deficit spending spree.
Here is a live US debt clock – it is a very scary site and sight! https://www.usdebtclock.org/
US default?
Before both election campaigns in 2016 and again in 2020, Trump raised the prospect of US the defaulting on foreign debt. He did not resort to that in his first term, nor so far in his second term.
Since Trump’s initial unilateral tariff assault in April 2018, and especially since April 2025 tariff announcements, we are now into a global competitive protection race funded by endless government hand-outs and subsidies to appease increasingly fragmented and populist voters.
Rising US government debt levels have not scared off buyers of US bonds. Far from it! Apart from China, which has been selling down US debt, most other countries are still buying up US treasuries at a cracking pace – see:
· Who wants to buy US debt? – ie lend to the profligate US government? Most of the world except me! (12-Feb-2026)
Collapsing US dollar?
Likewise, media headlines everywhere warn that rising US deficits and debts will trigger an imminent collapse in the US dollar. This is also a myth - see:
· Is the US dollar in decline? or on its ‘last legs’? – Hardly! The problem is the dollar is too strong. Implications for Aussie investors (21-4-2025)
Bond market vigilantes
The bond market is where trouble is brewing. With fiat paper currencies, governments can just print more money to service and refinance debts, but it is bond investors who set the price (interest rate they demand).
Rising bond yields, reflecting higher compensation for bond investors to by US treasuries, will probably be what pricks the current tech boom in share markets.
In 1994 Bill Clinton was smacked down by the bond market and was forced to rein in deficits (and he even ended up producing three surplus years in the late 1990s, the only three US government surpluses since Eisenhower in the 1950s).
In 2022 Britain’s Liz Truss was smacked down by the bond market, and was forced to reverse her plans for big spending and tax cuts.
So far in 2026, bond yields have been on the rise in the US and around the world, especially at the long end, reflecting fears of persistent inflation for many years to come. Yields are back up to levels not seen in 15-20 years in the US and many other markets, but we have thus far not seen a major sudden spike that spooks share markets enough to burst the current tech bubble.
We can probably expect more of these bond market tantrums if the deficit spending sprees continue.
Thus far, Trump has shown no inclination to cut spending or raise taxes. Instead Treasury Secretary Scott Bessent has announced plans to ramp up government bond buying to artificially suppress rates. This is exactly the opposite of Fed Chair Kevin Warsh’s stated plans to reduce the Fed’s bond holdings.
Debt per se is NOT a problem - BUT:
Although debts in almost all countries are still well below their historical peaks, there are three big problems with the current trend for deficits and debts:
(1) First - Deficits and debts are heading toward levels in WW1&2 and the 1930s Depression, but we are not in all-out war nor depression. Economies are not even in mild recession, so there is no economic need to run deficits.
Actually, the cause-effect relationship is the reverse: economies are effectively on life support, reliant on continuing deficit spending for growth. Reining in the current deficits would probably send many economies into recession.
(2) Debt is good, but only if it builds long-term productivity capacity that generates additional revenues greater than the interest bill on the debt. However, much of the recent increases in debt are being used for current spending, subsidies, hand-outs and uneconomic political pet projects to appease populist demands and buy votes.
Australia’s additional problem is our huge pile of relatively unproductive HOUSEHOLD debt from decades of failed housing policies at all levels of government.
(3) Governments have abandoned any sense of fiscal responsibility. They no longer aim to ‘balance the budget’ over a cycle. Instead they are resorting to 1950s-style ‘financial repression’ to suppress interest rates to use inflation to inflate away debts.
The US drives world markets and the race to financial repression is accelerating in real time at the moment. Rather than cut spending, Treasury Secretary Bessent is ramping up bond buying to suppress rates at the long end while Fed Chair Warsh is keeping rates low at the short end.
Inflation is not an unintended consequence of monetary and fiscal policy mis-steps. It is a deliberate policy outcome!
The biggest winners from inflation are geared-up asset owners. Trump may not know much, but that is one fact that he clearly understands, as he has been a geared-up asset owner benefiting from inflation all his life! The best way to increase inflation is to start a drawn-our war in the Middle East, so that’s exactly what he did!
For my Big Picture on inflation –
· Inflation BIG Picture: Boomers got rich by lucky timing. Next Gen to get higher inflation & rates (25-May-2026)
The only fly in the ointment is that Trump knows that he must reduce fuel prices at least to some degree in the short term in order to retain enough MAGA votes in the November 2026 mid-term elections for the GOP to retain the House and Senate. The market is expecting the Fed’s Kevin Warsh to not raise rates until after the elections (he probably gave that verbal promise to Trump to secure his appointment). Then we will see how much of an inflation hawk he really is, and how he can reduce bond holdings while Bessent is buying them up!
Interesting times indeed!
‘Till next time – safe investing and stay healthy!