I have never used margin lending, nor have I ever recommended it in any of my books or newsletters or in advice to investors, but I do keep a very close eye on margin lending volumes. Why? Because I have found it to be a very handy barometer of share market booms and busts.
Here is how it works and what it is saying about where we are now in the current boom-bust cycle.
Margin Lending a good indicator of boom-bust cycles
The amount of margin lending in the US has always been closely linked to the overall price level of the US share market. When people are feeling bullish, they bid up share prices, and many investors gear up using margin loans, which pushes share prices up further, accelerating the overall share market boom. This lures in more investors and margin loans, in an upward spiral to the top.
Then, when the boom deflates, share price falls trigger margin calls, and forced selling from investors failing to meet margin calls pushes prices down further, accelerating the overall share market decline. This triggers even more margin calls and more forced sales, and becomes a downward spiral to the bottom.
The following pair of charts show the very close relationship between the level of margin lending in the US (blue line) and the US price index (maroon line). The right chart shows the relationship through each of the boom-bust cycles since the 1950s.
The left chart shows the same relationship between 1920 and 1935 – featuring the extraordinary 1920s boom, followed by the 1929-32 crash. (I have no US margin lending data for the period 1935-1946).
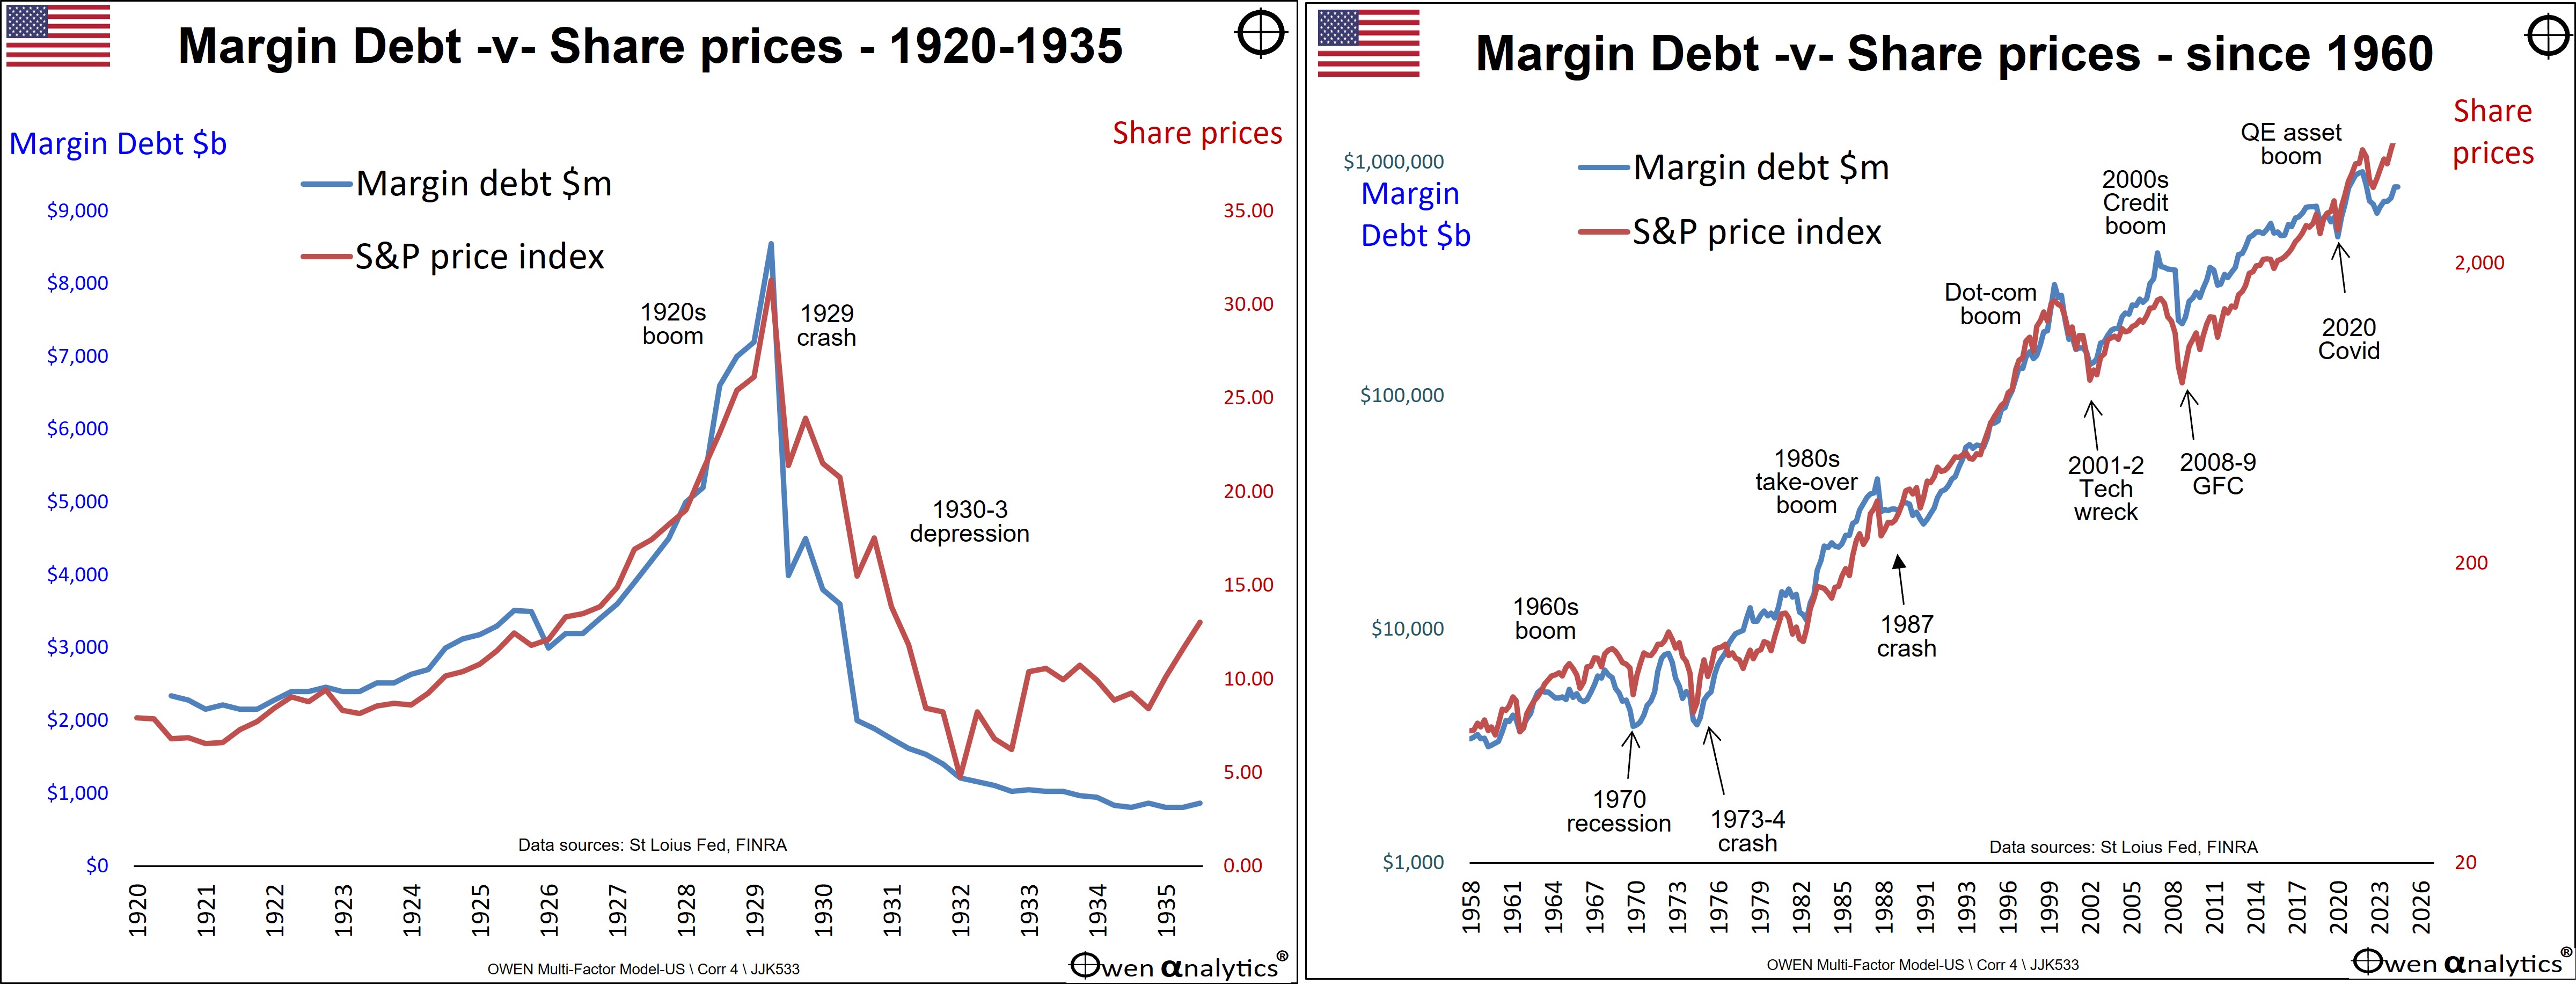
These charts show that every share market boom and bust is mirrored by (and in no small part directly driven by) a corresponding rise and fall in the level of margin lending.
Margin lending to GDP
To create a measure of relative strength or weakness of margin lending in the US, I compare it to the level of US GDP.
This margin lending to GDP ratio has been a good indicator of the level of optimism and speculation (and also pessimism) in the US share market. It one of the long-term factors in my ‘multi-factor multi-timeframe model’ that I have used to guide asset allocation decisions in portfolios for the past 15 years.
Australia follows the US
People often ask me why I seem to spend much of my time and effort studying and writing about the US financial markets whereas I, and most of the firms I advise, are in Australia. It is because what happens in the US drives all world investment markets (shares, bonds, exchnge rates, commodities, etc), regardless of local conditions or pricing, including here in Australia.
Whenever the US share market suffers a big fall, whatever the reason or trigger, our local share market almost always falls with it, regardless of local conditions or pricing here. (The last time a major US share market collapse was not echoed in Australia was the US ‘Panic of 1907’, when the US market fell, but the Australian market held up).
see Australia v US share markets – it’s our turn next! (20 Nov 2023)
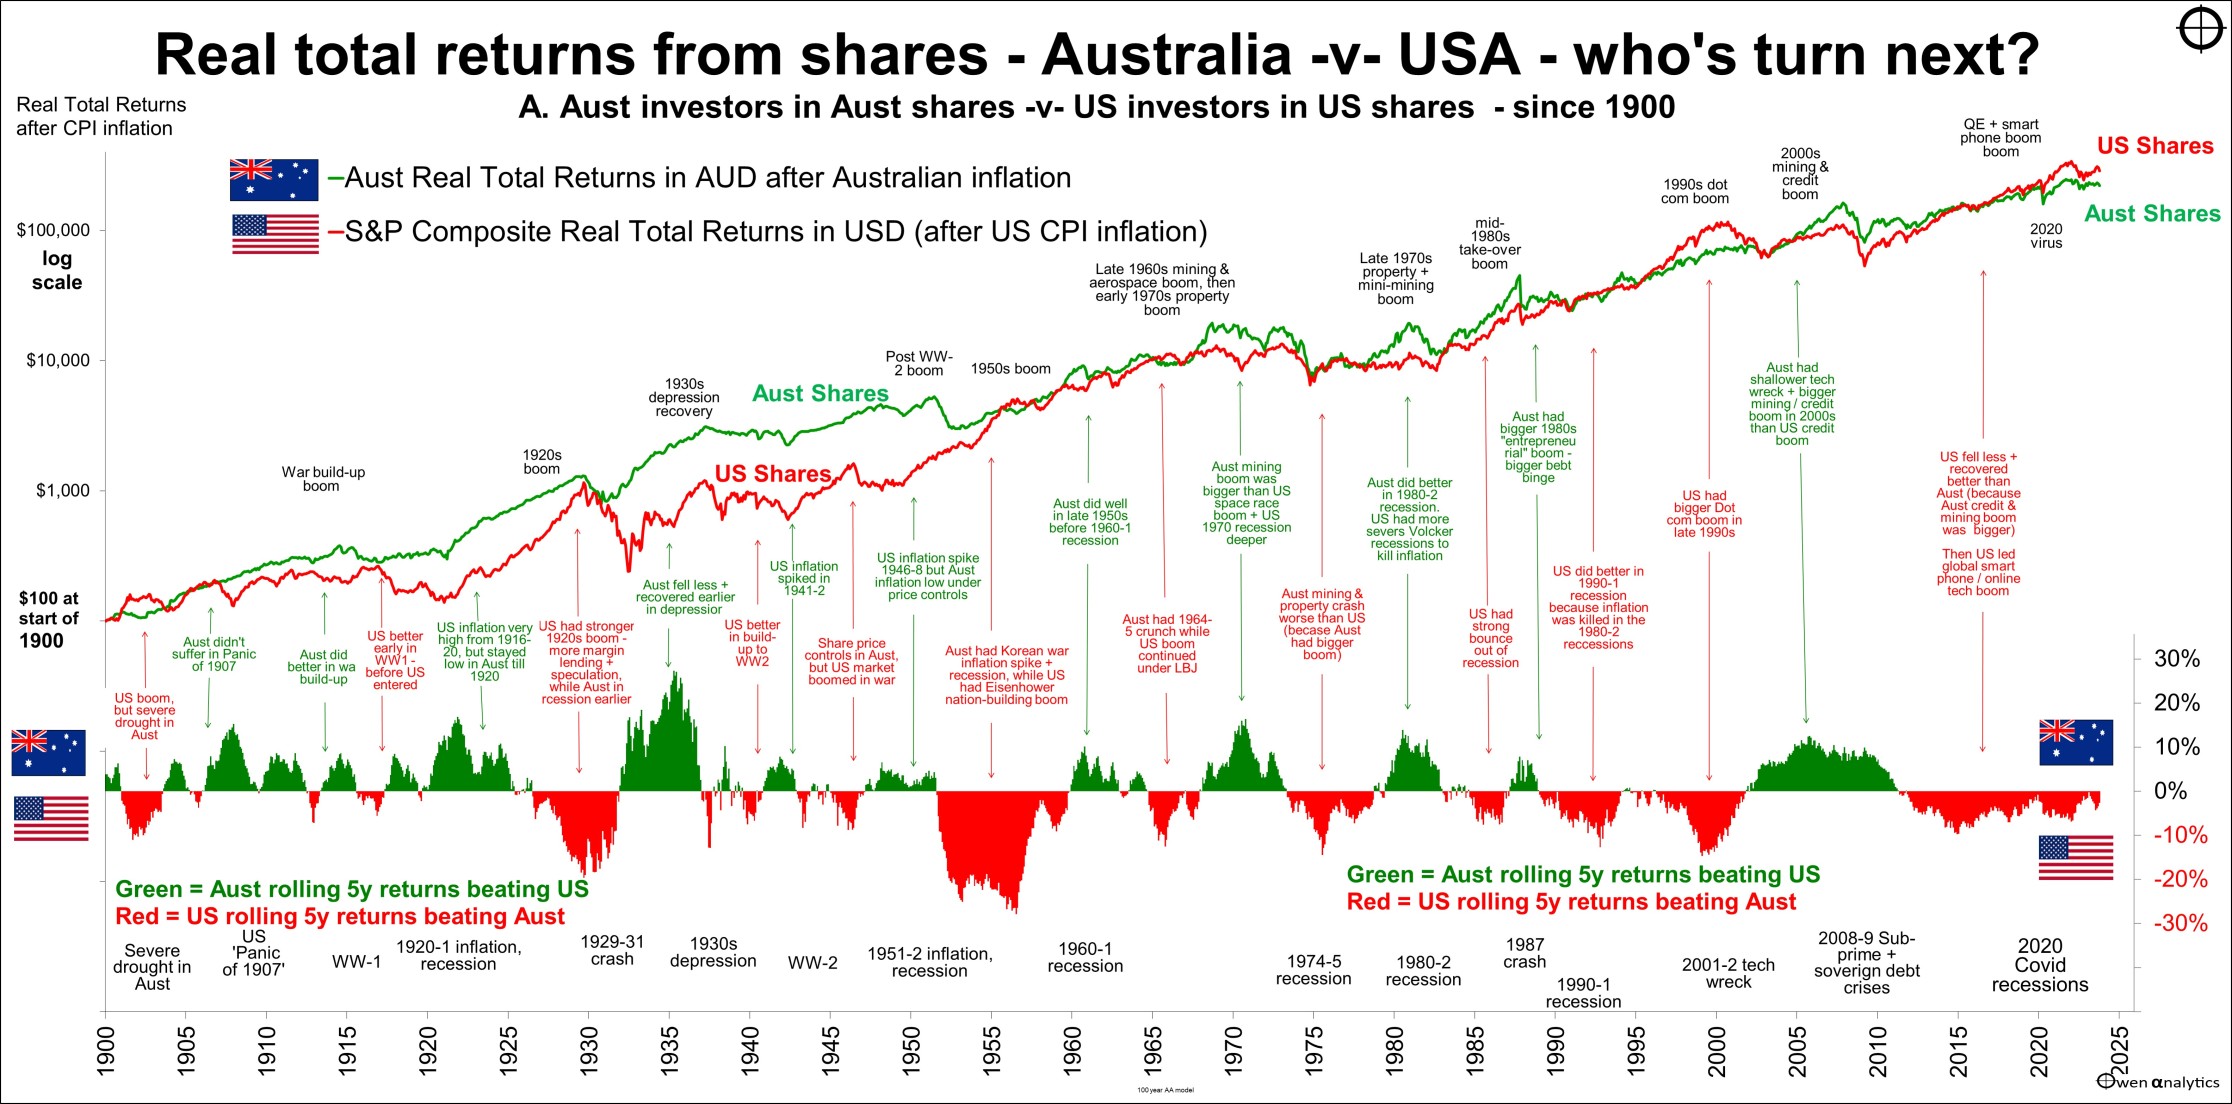
When, not if, the current US share market boom collapses, our local market will certainly fall with it, perhaps not to the same extent because we have a much smaller tech/online/A.I. sector in Australia.
US Margin Lending to GDP charts
The next charts show the ratio of US margin lending to US GDP over the same period covered by the above charts.
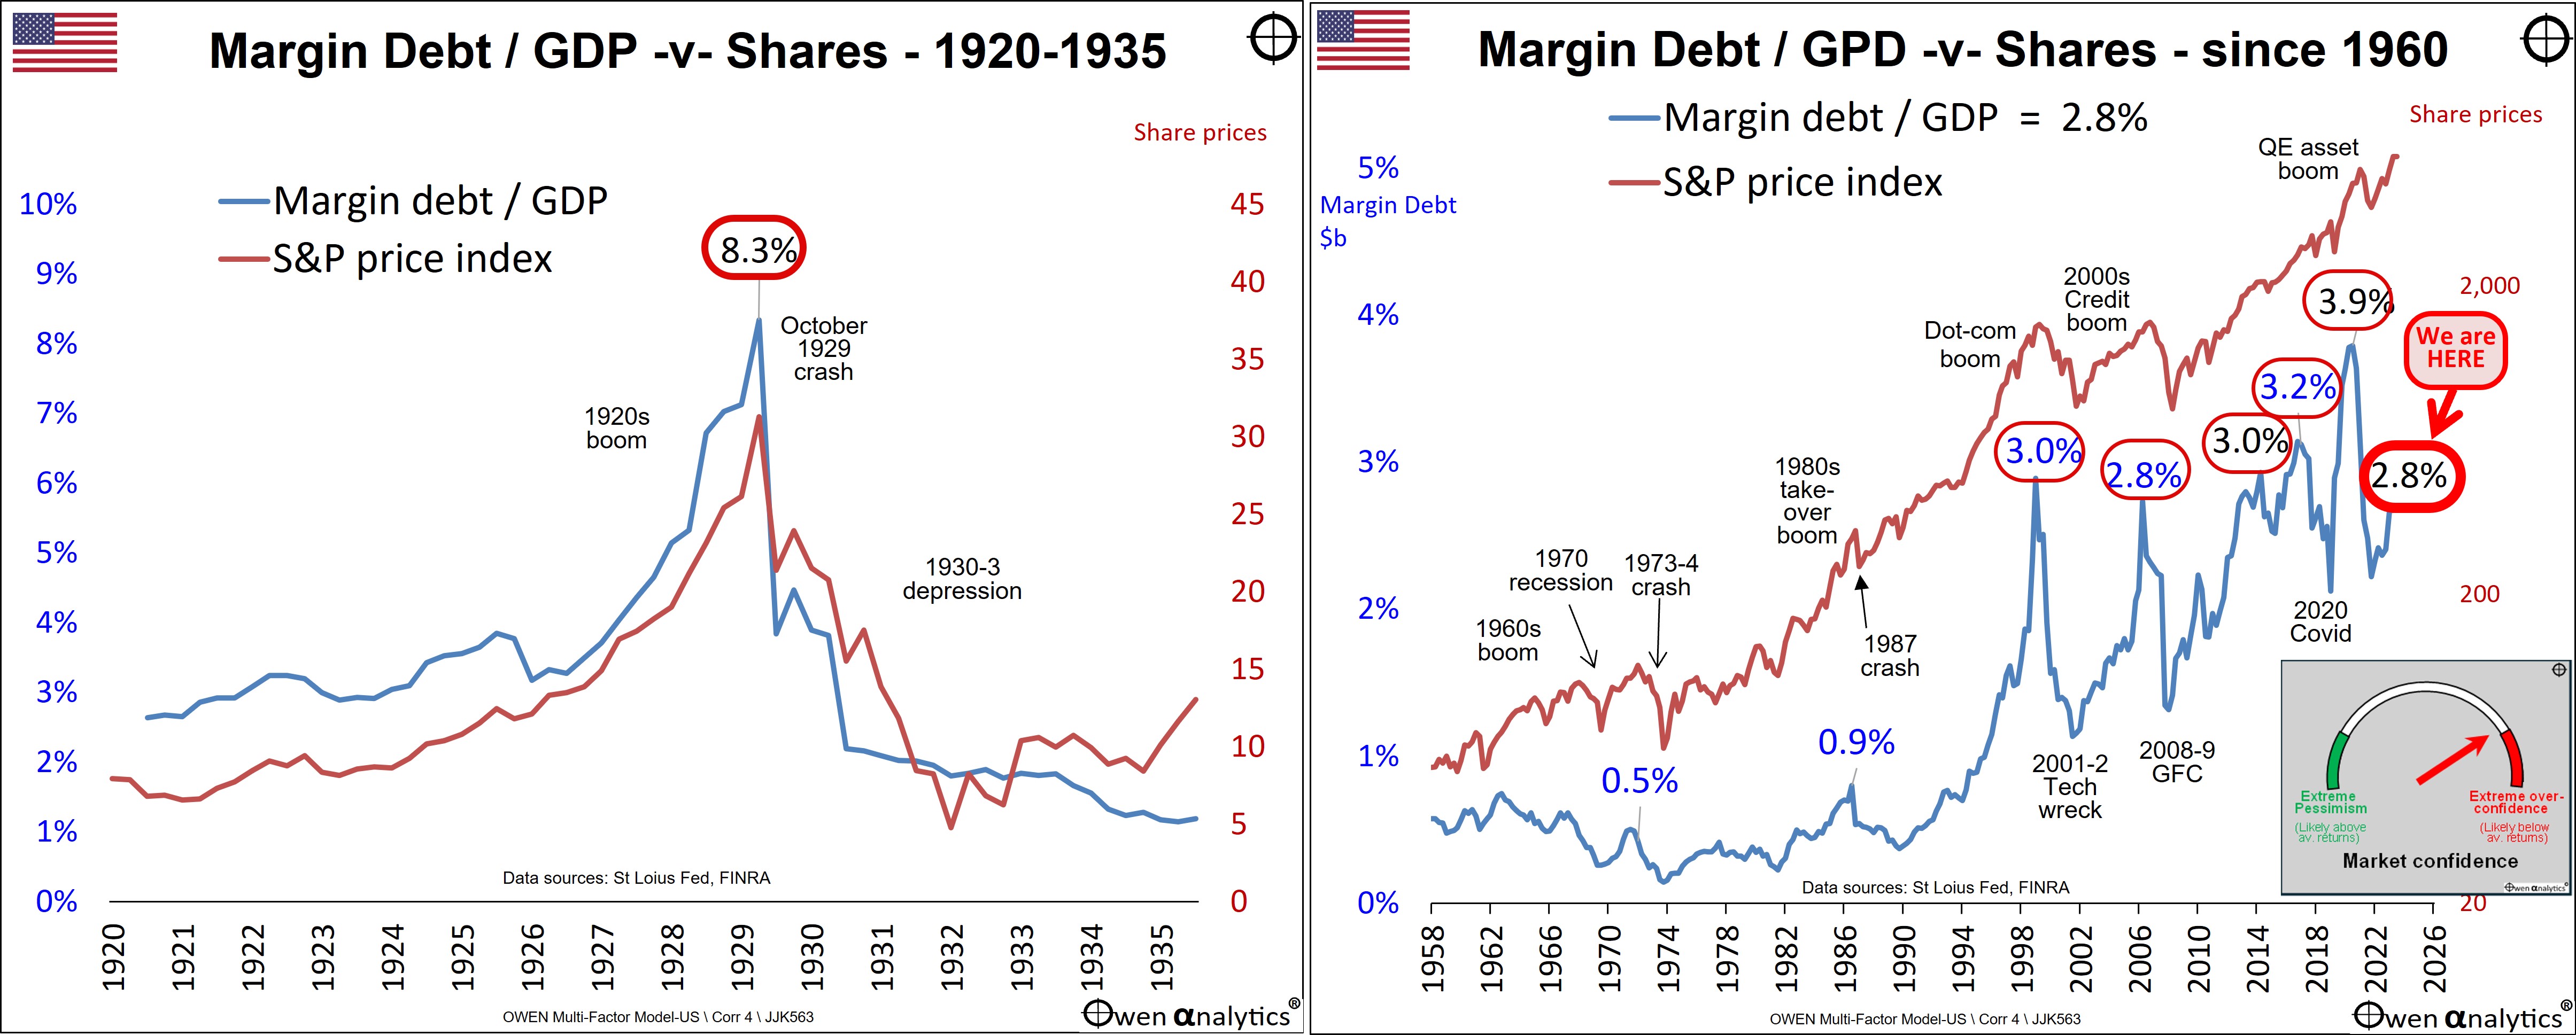
The share market (maroon line) peaks at exactly the same time as the margin lending to GDP ratio (blue line). Margin lending accelerates share price gains in the booms, and then forced sales from margin calls accelerate share price declines in the busts that always follow booms.
1929: the highest margin lending/GDP ratio, followed by the biggest crash
The 1929 crash was the height of extremes (left chart), when the volume of margin lending in the US reached an extraordinary 8.3% of US GDP. The crash that followed took 25 years to recover (1954).
In recent decades (right chart), whenever margin lending reached around 3% of GDP, it has marked the top of a boom before a major sell-off.
It is notable that immediately before the 1987 crash, US margin lending was only a modest 0.9% of GDP. The 1987 crash was a ‘big one’ for Australia (took nine years to recover), but in the US it was brushed off relatively quickly (just one year to recover).
Red flag at 3%
Previous editions of this report flagged that my 3% red warning flag was reached in each of the last three occasions – right before a major sell-off.
3% was also the peak margin lending to GDP ratio reached at the top of the late 1990s ‘dot com’ boom right before it crashed in the 2001-2 ‘tech wreck’, when the S&P500 index fell by -46% and the NASDAQ fell by -75%.
The most recent red flag was at the end of December 2021, when US margin lending reached a record $910b, marking a new post-1929 high of 3.9% of GDP, immediately before the 2022 sell-off.
This 3.9% peak was well above my 3% red flag warning level, probably because of the very unusual conditions in the Covid lockdowns - zero interest rates, free money sprayed around by governments, plus boredom from being locked up at home with nothing to do but bet on meme stocks, cryptos and NFTs.
The market-wide sell-off in the first three quarters of 2022 was triggered by aggressive interest rate hikes to tackle inflation, and Russia’s invasion of Ukraine. My report at the end of 2021 did not predict the exact triggers for the sell-off in 2022, but the red flag of margin lending at well above 3% of GDP was a signal that a sell-off was due, whatever the trigger.
In the 2022 sell-off, margin lending volumes wound back from $910b to $606b (back to 2.3% of GDP), via voluntary and involuntary liquidations from margin calls.
Where are we now?
At the end of March 2024, US margin lending has climbed back up again to $784b, taking the ratio of margin lending to GDP back up to 2.8% of GDP.
(For recent decades I use margin lending data collected and reported by the US Financial Industry Regulatory Authority (FINRA), available here. US Nominal GDP can be found here.)
While this is not a 3% top of the market red flag signal like it was at the last three tops before big falls, it is getting close once again. High but not extreme yet.
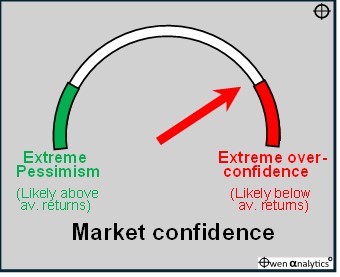
On a scale of extreme pessimism to extreme over-confidence I rate the current position at about 8 out of 10:
It should be noted that the margin lending to GDP ratio peaked at ‘only’ 2.8% (the same as it is now) right before the 2008-9 global financial crisis.
Food for thought. The big correction is on its way. Perhaps there is a little more upside yet (I have been bullish over the past year, and still am, short term), before a whole lot of downside pain when the boom unwinds.
Of course, this is only one measure of market over-pricing, but it is a simple and effective measure that has worked through many boom-bust cycles over many decades.
‘Till next time, happy investing!
Thank you for your time – please send me feedback and/or ideas for future editions.
See also: