Greetings fellow investors!
Australian share market has lagged the rest of the world for the past 17 YEARS! Our ‘Home Bias’ is costing investors dearly
Key Points:
-
- The Australian share market has lagged the rest of the world for the past 17 YEARS since mid-2009, and the lag has ACCELERATED over the past three years in the ‘ai’ boom.
-
- This is the second longest period of ASX lagging global markets in history (the only longer period of lag was 24 years from June 1932 to July 1956).
-
- The current seventeen-year ASX lag has become very serious. Since mid-2009, the ASX has generated total returns (ie including dividends) averaging 8.9% per year compared to 12.1% per year for the overall international share market.
-
- This 3.2% average annual return difference has compounded into huge differences over time. International shares generated 65% MORE total wealth than the local market. That’s a big cost to returns for Aussie investors who are doggedly clinging on to traditionally high ‘home bias’ allocations to the local market.
-
- This ‘home bias’ is enormous. The ASX makes up less than 2% of total world share market value, but almost all diversified long-term funds in Australia (including Industry / Corporate / Retail Super funds, and also diversified ETFs) have much higher than a text-book 2%/98% mix. In most funds, Aussie shares still make up between one third and two thirds of the total share allocation.
-
- There are several reasons for this heavy ‘home bias’, including franking credits on dividends, familiarity with local companies, privatisations & de-mutualisations of major local companies, extra admin / paperwork for foreign shares and, until very recently, higher costs and limited access.
-
- Is it time to reduce allocations to the ASX and allocate more to international shares to chase the current global boom?
-
- If you do, it will probably turn out to be a classic case of ‘Buy High – Sell Low’ - the exact opposite of serious long-term investors who focus more on company fundamentals than price charts.
-
- There is an upside in the current ASX lag of course: when (not if) the current speculative tech boom comes crashing down (it’s only a question of time/trigger), the ASX will most likely hold up better, just as it did in the 2000-2 ‘tech wreck’ after the late 1990s speculative tech boom, and it also held up better in the 1929-32 crash after the 1920s speculative boom.
-
- Why the ASX lag? In upcoming articles I will outline NINE specific reasons why the ASX has under-performed the overall global share market for nearly two decades, including whether the reasons are temporary, cyclical, or more entrenched/chronic.
Why is this important for all long-term investors?
Every diversified long-term investment portfolio contains (or arguably should contain) a mix of local (Australian) and international shares. Aside from the growth/defensive mix in a portfolio, the next most important and impactful portfolio management decision is the mix of Aussie versus international shares in the portfolio (much more important than the active/passive mix or picking hot stocks or hot funds or hot sectors, etc).
Heavy ‘home bias’
Although the local Australian share market makes up less than 2% of total world share market value, almost all diversified long-term funds (including institutional Industry / Corporate / Retail Super funds for Australian investors, and also diversified ETFs) have much higher than a text-book 2%/98% mix. In all major institutional diversified funds, and in advice group model portfolios, Aussie shares still make up between one third and two thirds of the total share mix.
There are several reasons for this heavy ‘home bias’, including franking credits on dividends, familiarity with local companies, privatisations & de-mutualisations of major local companies, higher dividend yields, extra admin / paperwork for foreign shares and, until very recently, higher costs and limited access.
This portfolio decision on the local/international shares mix must be reviewed every few years or so to make sure the portfolio is still on track to generate the desired long-term returns.
Performance over time
The problem is that the ASX has been lagging the overall international share market for the past SEVENTEEN many years, to the detriment of portfolio returns.
(For how I overcome this in my own long-term portfolios – see
· My ‘10-4 all-weather ETF portfolio’ doing well after two busy/lazy years, beating Big Super funds again by big margins (8-Jul-2026)
Seventeen years is a very long period of lag, but it is not the longest. The longest ASX lag was 24 years from June 1932 (when the US market finally hit bottom a year after the ASX) to July 1956 before the ASX surged back in the late 1950s while the US market fell in the 1957-8 recession and the UK had the 1956 Suez Crisis.)
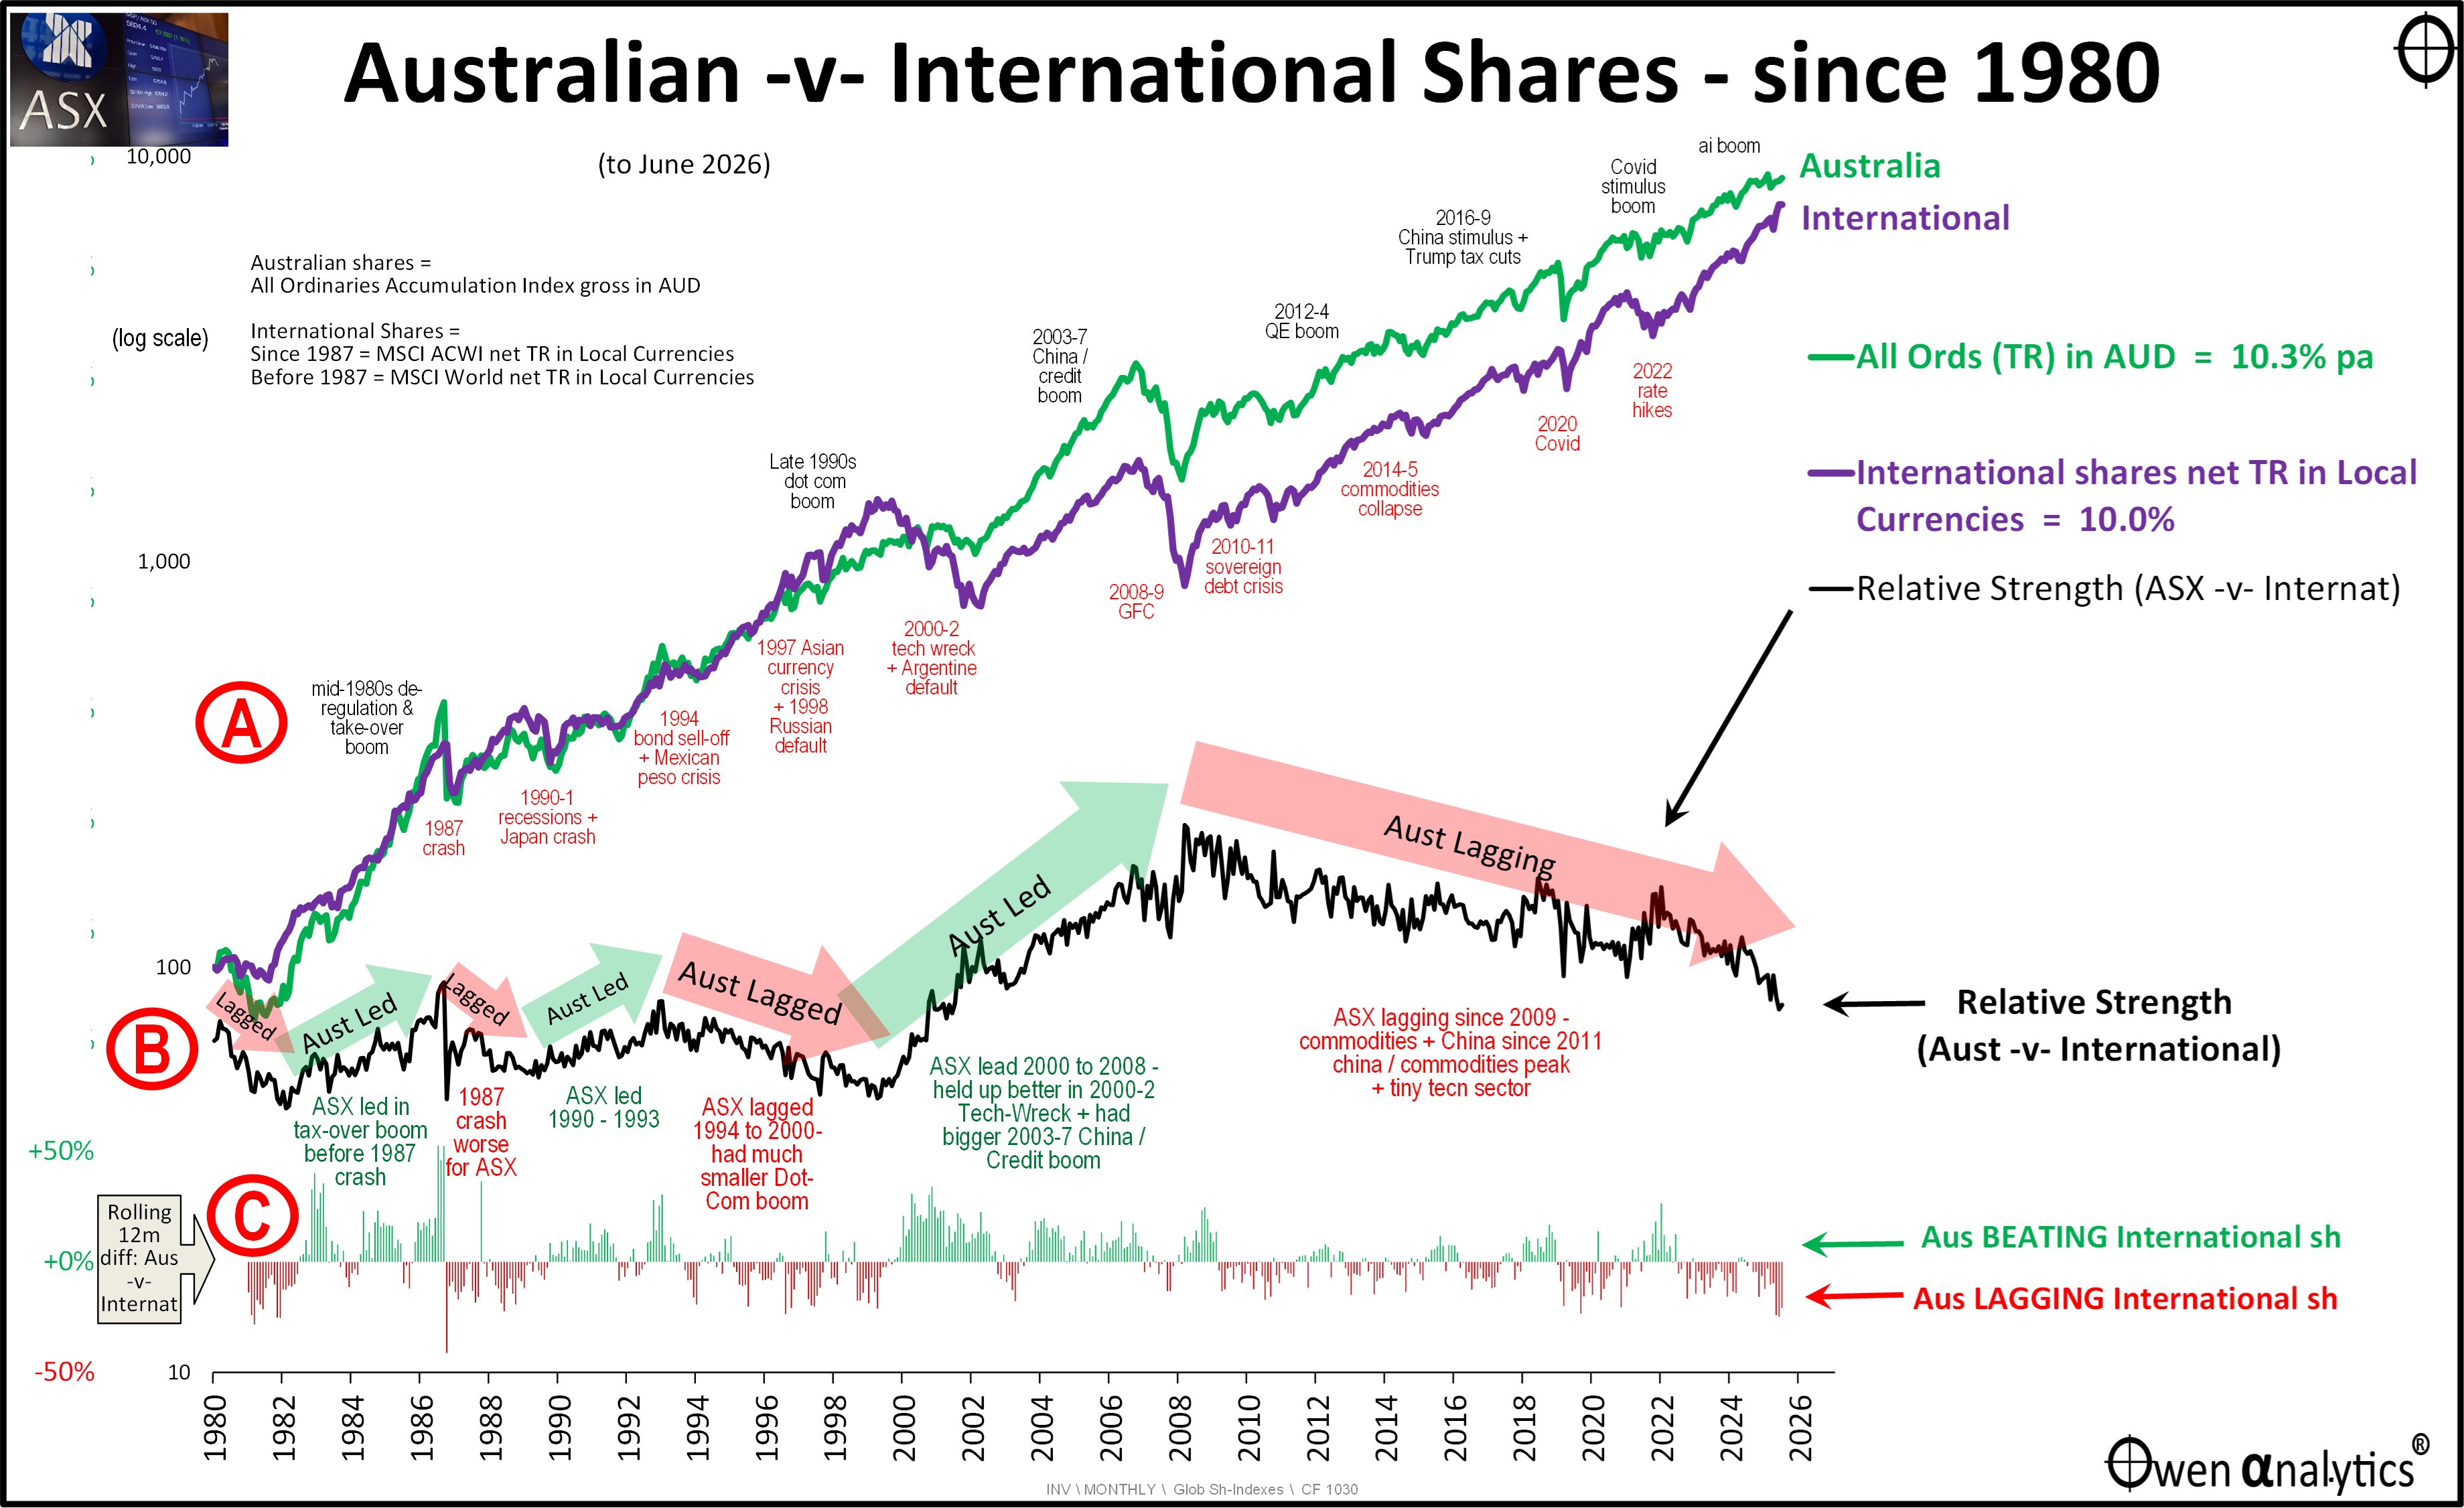
Today’s chart shows total returns from the Australian versus international share markets since 1980.
(For Australian shares: All Ordinaries Accumulation Index gross in AUD. For International shares: Since 1987 = MSCI ‘ACWI’ (‘All Country World Index’ which includes ‘developed’ and ‘emerging’ markets) Net Total Returns in Local Currencies; Before 1987 = MSCI ‘World Index’ (‘developed’ markets) Net Total Returns in Local Currencies.)
NB For the purposes of today’s chart I use returns from international shares in their ‘local’ currencies – ie US shares are in US dollars, UK shares are in Pounds, etc) with the currencies neither ‘hedged’ or ‘un-hedged’, compared to ASX returns to Australian investors in their local currency (AUD), in order to eliminate the impacts of relative currency movements between countries, and also eliminate the impacts of currency hedging which is based on relative short-term interest rates in each country.
By showing returns in local currencies in each country we can see how investors in each country enjoyed returns in their own (‘local’) currencies without the interference of changes in relative exchange rates and relative interest rates in each country.
In other articles I often compare returns from different countries in a common currency (eg USD), or in hedged and/or un-hedged Australian Dollars, but those introduce complications of exchange rates, inflation and interest rates, which are unnecessary for today’s story.)
Overall - Australia still winning
The upper section of the chart (section ‘A’) shows cumulative total returns from a common base (green line for Australia, purple for International). Over the 45 years since 1980, the local Australian market has returned an average of 10.3% per year, which is slightly ahead of 10.0% from international share markets as a whole.
Big swings and cycles over time
However, Australia’s performance relative to the rest of the world has not been consistent over time. There have been long periods where our ASX market has led the world market, and long periods when it has lagged behind.
The middle section (‘B’) of the chart shows the ‘relative strength’ (black line) of the two markets. The relative strength line is simply the cumulative total return for Australia (from a common base) divided by the cumulative total return for international shares. When the ASX is beating international shares the relative strength indicator rises, and when it is lagging the relative strength indicator falls.
We can see that there have been three distinct lead/lag cycles for ASX versus international shares since 1980 – indicated by the large green and pink arrows in section B.
(This lead/lag cycle phenomenon has gone on for more than a century – eg see:
· Australia v US share markets – it’s our turn next! (20 Nov 2023)
Section ‘C’ in the lower part of the chart shows the rolling 12-month difference returns between the ASX and rest of the world. Positive green bars for when the ASX is leading; negative red bars when it is lagging. We can see that it has been mainly negative red bars (ASX lagging) since 2009 apart from some brief periods of ASX out-performance – notably during the 2022 rate hikes.
The ASX lag has accelerated since 2022 (ai boom) – indicated by the sinking black relative strength line in section B and the prevalence of negative red bars in Section C.
Lead-Lag cycles for Aussie share market
Here are the lead/lag cycles for the Australian share market versus international shares (large green and pink arrows in section ‘B’) since 1980:
· After the ASX lagged the world during the 1982-3 recession, it then surged ahead of the world in the global 1983-7 deregulation and take-over boom. Australia’s newly deregulated banks literally went mad and threw money at every hair-brained scheme peddled by every crook and scoundrel they could dig up (apart from NAB which was still asleep).
· The ASX then lagged the rest of the world from the 1987 crash to 1990. Our pre-1987 boom was more extreme than the rest of the world, so our 1987 crash was deeper and took longer to recover.
· The ASX then led the world from 1990 to 1993 – rebounding from the early 1990s sell-off and bank crisis in which Westpac and ANZ suffered near-fatal losses. The State Banks also went mad, especially State Bank Victoria (SBV), and State bank South Australia (SBSA) and both suffered fatal losses / collapses, with knock-on effects across the wider economy and listed companies.
· The ASX then lagged the world from 1993 to 2000 during the global ‘dot-com’ tech boom as our tech sector was much smaller and less exciting. (Believe it or not, the two hottest ‘tech’ stocks on the ASX were News Corp and Telstra!)
· The local market then beat the rest of the world from 2000 to 2009 for two reasons. First: as our ‘dot-com’ boom was smaller, so was the 2000-2 ‘Tech wreck’, which the ASX sailed through with very little damage. (Our two main corporate crashes – HIH Insurance and Ansett Airlines were not tech stocks.)
· Second: between 2003 and 2007 not only did we have a wild speculative credit boom like the rest of the world, but we also benefited from the massive China / commodities boom as well. That 2003-7 period of high returns for the ASX market is the sole reason it is still in the lead overall up to the present day (from the 1980 starting point anyway).
· However, the ASX has lagged the overall international share market since the bottom of the GFC in mid-2009. Again there are two main reasons for the lag. First: Chinese growth (especially real estate development, which was the main engine of Chinese economic growth and commodities demand), and therefore commodities prices, have been weak since China’s GFC stimulus peak in 2011.
· Second: we have virtually no tech sector (eg hardware, software, semi-conductors, social media, E-commerce, streaming, ai, etc), so we are lagging badly in the current global tech boom.
Current lag cycle
The seventeen-year ASX lag since 2009 has become very serious.
Since mid-2009, the ASX has returned an average of 8.9% per year, compared to 12.1% per year for international shares. This 3.2% average annual return difference has compounded into a 50% difference over the seventeen years of lag. This means that international shares have generated more than 65% higher total returns than the local market.
Asset Allocation decisions
Is it time to sell or reduce the local ASX share allocation and allocate more to international shares to chase the global boom?
Spoiler alert: if you do it will probably turn out to be a case of ‘Buy High – Sell Low’ - which is the opposite of serious long-term investors who focus more on company fundamentals than price charts.
There are other ways to make up for the ASX performance lag. Here is how I have managed to make up for most of the ASX lag via my selection of ETFs, as an alternative to just under-weighting the Australian shares asset class:
· My ‘10-4 all-weather ETF portfolio’ doing well after two busy/lazy years, beating Big Super funds again by big margins (8-Jul-2026)
Silver lining
There is an upside in the current ASX lag of course: when (not if) the current tech boom comes crashing down (it’s only a question of time and trigger), the ASX market will most likely hold up better than other more speculative markets, just as it did in the 2000-2 ‘tech wreck’ after the late 1990s speculative tech boom, and it also held up better in the 1929-32 crash after the 1920s speculative boom.
What about Franking Credits and actual returns in AUD?
For completeness, and to head off inevitable reader questions, below is a second version of the main chart.
Recall that in the main chart above: for Australian shares I used the All Ordinaries Accumulation index (in AUD), and for International shares I used MSCI All Country World Index net Total Returns in Local Currencies, in order to illustrate how share markets performed in their own countries for their investors in their own currencies. (it essentially asks the investors in each country: ‘ What has your local share market done for you?’)
However, neither of these indexes in Chart 1 are investable for Australian investors. (There is no listed ETF or unlisted fund that tracks the All Ordinaries index, and for international shares Aussie investors are interested in returns in Aussie dollars, not in the local currencies of each country). Also Chart 1 does not include Franking Credits, which have been a significant element of ASX returns for Aussie investors since 1988.
So, to illustrate the return differences in practical, investable terms for Aussie investors, chart 2 below uses ASX200 Accumulation gross incl Franking Credits for Australian shares, and international shares in unhedged AUD. (Since 1987 = MSCI ACWI net TR in Unhedged AUD, and before 1987 = MSCI World net TR in Unhedged AUD)
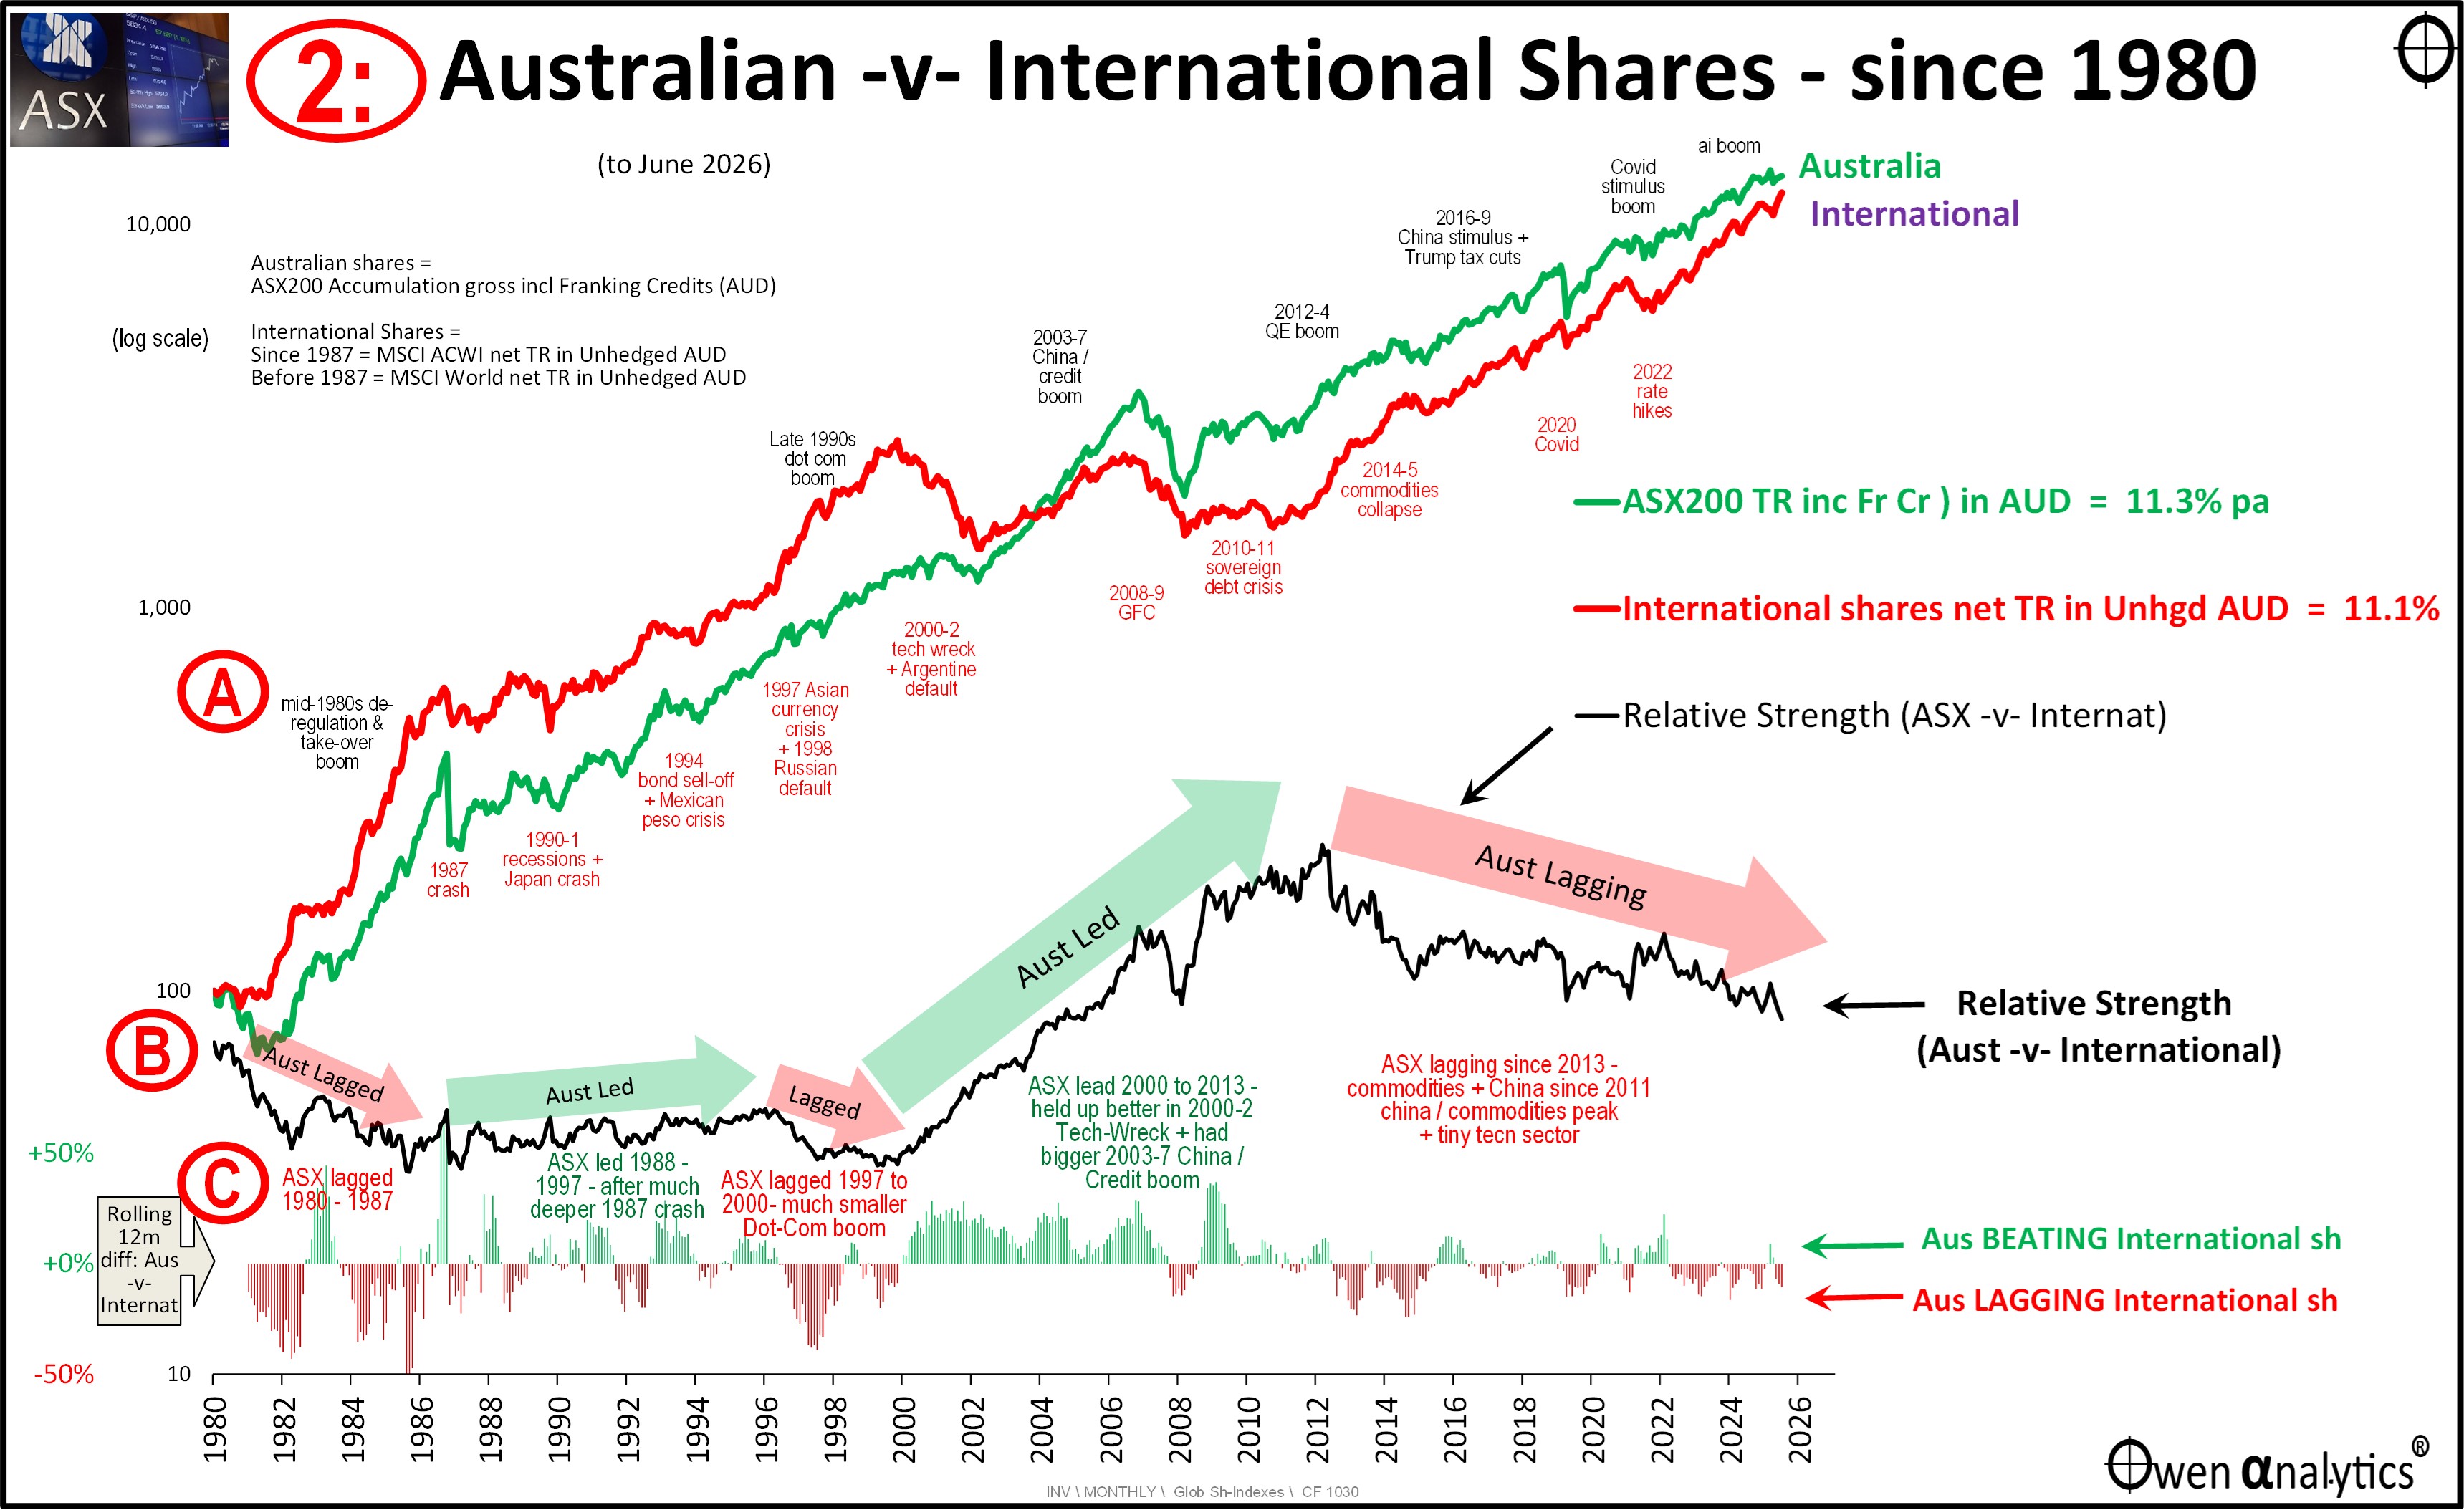
Each of these indexes in Chart 2 is investable to Australian investors (via low-cost ETFs), and it also includes the benefit of franking credits since 1988 on Australian shares. (Franking Credits are not paid by ETFs, they are up to each investor to claim from the ATO).
The picture in Chart 2 is essentially the same as in Chart 1, although the timing of the cycles differs a little due to changes in exchange rates. It also shows the big lag from the ASX since the post-GFC stimulus China / Commodities peak.
Why the ASX lag?
In upcoming articles I will outline NINE specific reasons for the recent under-performance of the local share market, including whether the reasons are temporary, cyclical, or more entrenched/chronic.
Stay tuned!
Here is my new article on the first Reason for the ASX lag:
· Reason 1 for the ASX’s 17-year lag behind global share market: SECTOR MIX