Key points:
-
-
- It’s that time of year again – time to review a whole new year of possible threats, risks, and crises that might blow up our investments in the coming year.
- Every year there is a new batch of ‘End of the World’, or ‘End of Life as we Know it’ threats and risks that scare investors into nervously waiting and watching from the sidelines, but share markets have always seemed to power through them.
- In the past these ‘existential’ crises have included wars (including the ‘World Wars’), revolutions, recessions, depressions, inflation spikes, deflation, pandemics, political crises, devastating natural disasters, and a host of other events.
- They were devastating for human life and whole economic systems, but you would have trouble spotting their impacts on the chart.
- Here is my updated ‘Where’s Wally?’ chart you can use to try to spot the big wars, depressions, and other major crises over the past 126 years.
- In my January 2025 edition of this story a year ago, we had a nice new batch of threats to scare off investors. Economists everywhere were predicting US and global recessions, we had Trump back in the White House, with his plans for unilateral tariffs on the world, plus massive un-funded tax cuts, his threats to seize Canada, Greenland, and the Panama Canal, and also promising to deport of tens of millions of ‘illegal aliens’, and intervene in interest rate decisions.
- But 2025 turned out to be another fantastic year for US and world share markets, not just for ‘US big-tech’.
- For 2026, we have Trump’s threats against Canada, Greenland, various military interventions in LatAm, ICE troops killing US citizens on US soil, the escalating US deficit/debt blowout, Trump’s new Fed chair possibly fuelling inflation with rate cuts, ‘ai’ destroying jobs, industries, and even destroying the ‘ai’ bubble itself! All scary stuff!
- Given the so-called ‘uncertainty’ and expensive pricing of share markets (US, Australia, and many other global markets), is it NOW time to sell up and wait on the sidelines until things ‘settle down ‘and become more ‘certain’?
- You decide!
It’s that time of year again – time to review a whole new year of possible threats, risks, and crises that might blow up our investments in the coming year. (Actually this year I was rather busy in January with cancer surgery and prepping for chemo, but February is still early in the year full of scary new threats!)
Every year there is a new batch of ‘End of the World’, or ‘End of Life as we Know it’ crises and threats that scare investors into nervously waiting and watching from the sidelines, but share markets have always seemed to power through them. These ‘existential’ crises include wars (including ‘World Wars’), political crises, recessions, depressions, inflation spikes, deflation, revolutions, devastating natural disasters, and a host of other events.
Last year's threats/risks?
In my January 2025 edition of this story a year ago, there was a nice new batch of threats to scare off investors. We had economists everywhere predicting US and global recessions, we had Trump back in the White House, with his plans for unilateral tariffs on the world, plus massive un-funded tax cuts, wartime-like deficits and debt, his threats to seize Canada, Greenland and the Panama Canal, letting Russia seize Ukraine, and China seize Taiwan. Plus we had Trump’s promise to deport of tens of millions of ‘illegal aliens’, intervene in interest rate decisions, and the list goes on.
Those threats and risks sure did make nice, scary headlines for the scare-mongers and doomsayers, and my email inbox was full of the usual holiday-reflection questions about what we should worry about in the coming year.
But 2025 actually turned out to be another fantastic year for most share markets around the world – not just for ‘US big-tech’. See:
Fear and scare-mongering make better headlines!
It used to be that ‘bad news sells newspapers’, but these days it is ‘bad news gets clicks’.
There is always a seemingly good reason NOT to invest. Just turn on the news (or internet) any day or night.
Somewhere in the world there is always a war, inflation, deflation, economic crisis, major bankruptcy, banking crisis, famine, drought, flood, civil war, cold war, military coup, revolution, bomb attack, interest rate hike, tax hike, rogue trading loss, terrorist attack, assassination, sovereign default, hyperinflation, trade war, current account crisis, commodity collapse, debt crisis, oil price spike, nuclear scare, foreign invasion, earth quake, tsunami, political scandal, election, currency collapse, virus pandemic, and the list goes on.
When one of these crises hits the news (which is every day), many people lose their nerve and say, “Maybe I’ll just wait on the sidelines for a while until things settle down”.
By the time the current ‘crisis’ does ‘settle down’ of course, there is another good reason not to invest, and so they wait on the sidelines for the next crisis to blow over, and the next, and the next.
Years pass, and they look back and inevitably wish they had ignored the media headlines and scaremongering and just stayed in the market the whole time.
Worse still, because they are now several years behind, it is easy to succumb to the temptation to ‘get it back’, or ‘catch up’ by taking on extra risk, gearing up, or falling for fraudulent get-rich-quick schemes.
‘FOMO’ and ‘FOLE’
‘FOMO’ (‘fear of missing out’) is a very common way to lose money (or under-perform a passive index fund) by chasing high returns, usually at the tops of speculative booms, when everyone else is also rushing in, pushing up prices to economic levels before the inevitable collapse.
At the other end of the scale, I have met just as many people over the years who have been left behind in their wealth-building journey because of ‘FOLE’ (‘fear of losing everything’).
A couple of years ago I met a couple who had been sitting in bank term deposits since panicking and selling out at the bottom of the GFC sell-off in early 2009. They watched in horror as their interest income dropped to zero over the subsequent decade, and inflation ate away at the capital value.
Their bank TDs are government guaranteed, so there is virtually no risk of loss, but the interest is fully taxable, and they offer no potential growth, not even for inflation. Meanwhile the Australian share market is up more than three-fold, the US market is up more than five-fold since then, and shares have tax benefits, growth prospects, and a relatively good inflation hedge.
The couple realised that their over-caution had resulted in them having a much lower standard of living for the rest of their lives. Their question to me was: ‘How can we get back to where we would have been had we not panicked and sold out?’ The answer of course is that they can’t.
The future is 'uncertain'
Probably the most common word used by media commentators to scare investors is ‘uncertain’.
Of course the future is ‘uncertain’! When scary-sounding events occur, people tend to think that that the future is now suddenly ‘more uncertain’ than normal, but that is ridiculous.
The future is always completely and utterly uncertain and unknowable. It always has been and always will be.
Sudden events like the September 2001 terrorist attacks on New York and Washington, the Covid-19 virus pandemic, the Japanese bombing of Pearl Harbour, Russia’s invasion of Ukraine, etc, came out of the blue. There will never be a day when the future is somehow magically more ‘certain’.
Share markets march on
Throughout this constant stream of ‘crises’, share markets have kept marching right along on their long, upward path, with temporary ups and downs along the way.
Today’s chart shows the broad stock market index of real (ie inflation-adjusted) total returns (ie share price growth plus dividends re-invested) in Australia (green, in Australian dollars) and the US (red, in US dollars) since 1900.
For very long term charts like this, I use a logarithmic (‘log’) scale on the vertical axis to highlights the fact that the compound growth rates delivered by the share markets have been fairly consistent for more than a century (ie. fairly straight lines sloping upward over time), with temporary ups and downs along the way.
These reasonably consistent share market returns have been driven by reasonably consistent compound growth rates in population, economic growth, and aggregate corporate profits, which underpin the long term growth in share prices and dividends.
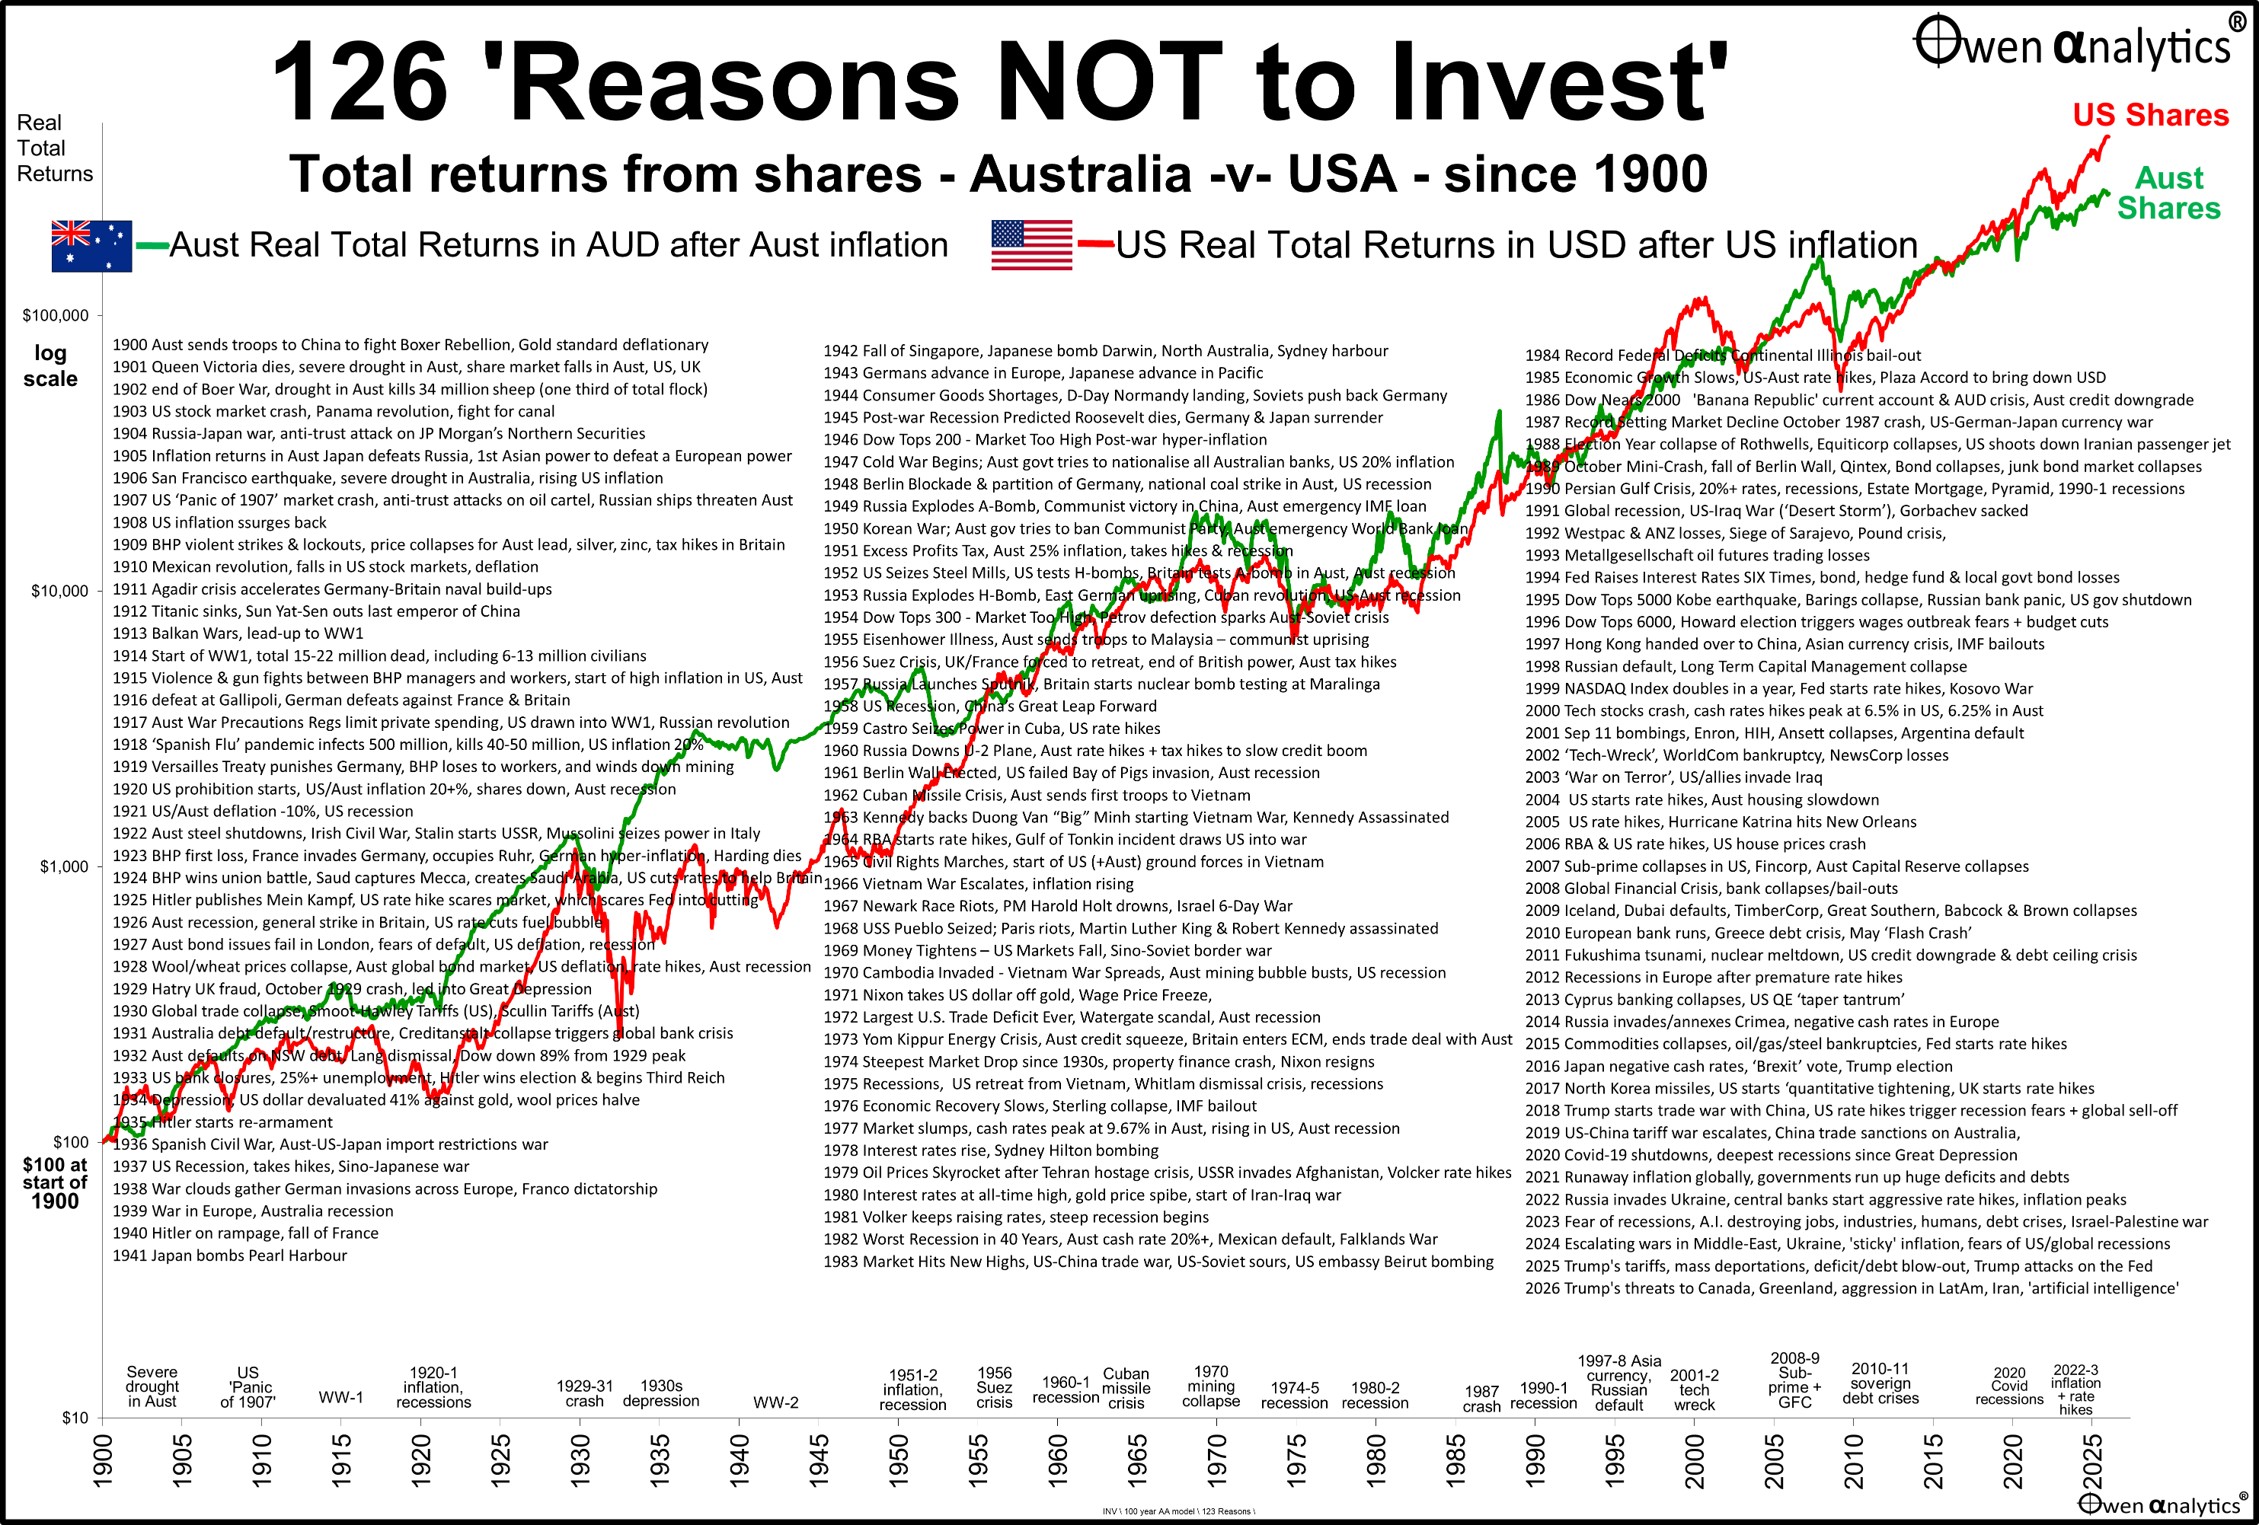
As an aside, both the US and Australian share markets have delivered real (ie inflation adjusted) total returns averaging around 6.5% per year over the entire period. They also follow the same broad boom/bust cycles (or more correctly, Australia follows US cycles), but they have tended to take turns in having the bigger boom/bust cycle. (We can see at the top right section of the chart that the US market is currently ahead, because the US is leading the current tech/ai cycle.). For more on this phenomenon of taking turns with boom/bust cycles see:
On the chart I have listed major events, perceived risks, or ‘crises’ each year that were probably enough to scare off many investors at the time. All of the big scary events are there - including the World Wars, depressions, crashes, inflation spikes, political crises, etc.
Even when the whole world was caught up in catastrophic, destructive, global events like the World Wars, they turned out to be little more than temporary hiccups in the long upward march of share markets.
‘Where’s Wally?’
You can use this chart to play ‘Spot the War’, or ‘Spot the Depression’, or ‘Spot the crash’, etc.
All of the great, traumatic global events are there, but they are hard to spot on the chart without a magnifying glass because their impact on share markets was minor.
For example, Australia’s sharpest and deepest stock market crash was in October 1987, when the market index fell by 50% in just 19 trading days (and didn’t recover until the 1990-1 recession). Can you find it on the chart? It will probably take you longer to find than you might think.
Find these global ‘crises’
Can you find the September 2001 terrorist attacks (in which the financial heart of the US was literally blown up), or the bombing of Pearl Harbour, or the fall of the Berlin Wall, or the 1973 oil shock, or Nixon abandoning the USD/gold standard?
Those sudden events triggered deep, fundamental, and long-lasting changes to the world order, but good luck spotting their impacts on share prices!
Find these Aussie ‘crises’
In the case of Australia, can you find when the Australian government defaulted on its entire stock of domestic debt in a Greek-style default and restructure?
Or the constitutional crisis with the sacking of Prime Minister Whitlam?
Or the Japanese bombing of Australia (including bombing ships in Sydney Harbour).
These were extraordinarily traumatic and disruptive events for economic and political life in Australia, but good luck finding their impacts on the share prices.
I am not intending to make light of massive human tragedies like World Wars that killed tens of millions of people, nor other catastrophic events. My point is that the engine of corporate profitability is remarkably robust through all sorts of major crises, even when whole nations, economic systems, and pollical regimes are destroyed or dramatically re-shaped.
Individual companies come and go of course, but if you own widely diversified portfolios of companies, or even own whole markets by using index funds, then even the most devastating crises and catastrophes have turned out to be little more than temporary set-backs for long term investors, at least for Australian and US share markets so far.
Is this time different?
Let’s look at recent years:
-
-
- In 2020 the big scare was the global pandemic and governments locking entire populations of citizens in their homes and closing businesses, causing the sharpest and deepest economic contractions since the Great Depression.
- In 2021 it was runaway inflation, and governments running up massive wartime-like deficits and debts.
- In 2022 it was Russia’s invasion of Ukraine, soaring commodities and energy prices, and aggressive interest rate hikes everywhere
- In 2023 it was the fear of persistent high inflation, more aggressive rate hikes, fears of US/global recessions (ho-hum – we’ve seen dozens of them before!), and fears of emerging market debt crises caused by the rising US dollar and interest rates.
- In 2024 it was the fear of continued ‘sticky’ inflation, fears of US/global recessions (still! = pessimists never give up!), and fears that ‘ai’ will soon destroy humanity (a prospect promoted by ai inventors themselves!)
- In 2025 it was Trump, with his plans for tariffs on the world, massive un-funded tax cuts, wartime-like deficits and debt, and even plans to seize Canada, Greenland and the Panama Canal, and letting Russia invade Ukraine, and China invade Taiwan. Plus we had Trump’s promised deportation of tens of millions of illegal aliens, intervening in interest rates, and the list goes on.
- None of these fears eventuated (thanks to the ‘TACO’ trade!). But they did make for nice, scary headlines for the scare-mongers and doomsayers. Despite the fears and the negative headlines, share markets powered on regardless.
Fears/Risks for 2026?
What are some of the fears potentially worrying investors for 2026? We have Trump’s ongoing threats against Canada, Greenland, Trump’s troops killing US citizens in US cities, the escalating deficit/debt blowout, Trump’s new Fed chair possibly fuelling inflation with rate cuts, and a bursting of the ‘ai’ bubble, plus we may see Putin stepping up his invasion of Ukraine, and Xi taking Taiwan.
Given the extremely expensive pricing of share markets (US, Australia, and many other global markets), is it NOW time to sell up and wait on the sidelines until things ‘settle down ‘and become ‘certain’?
You decide!
To see the US and Australian share markets split into each boom-bust cycle over the past 100 years –
For my story on how the Australian and US markets take turns to boom and bust -
A note on data sources:
- For Australian shares:
- Since 1980 - All Ords accumulation index
- 1958-1979 - Sydney All Ordinaries
- 1936-1957 - Sydney 34 Ordinaries
- Before 1936 - Sydney Commercial & Industrial Index
- Before 1979, total return series use the Adjusted Lamberton dividends series
- Real returns are based on CPI inflation - ABS.
- For US shares:
- S&P500, S&P Composite, CRSP, Shiller.
- Real returns are based on US CPI data (St Louis FRED, ALFRED)