January 2026 snapshot:
Greetings fellow investors!
First up – I have changed the format for my monthly report.
I started doing this regular monthly report twenty years ago after I had exceeded all of my financial independence goals for myself and family, and I started advising others – including serving on investment committees (initially for fellow investors, family offices, charitable funds, advice firms, and mentoring), and it was also when I started out writing my first book on investing.
My monthly report started out twenty years ago as a simple 2-page report. The front page had my commentary on major market events and themes (usually with one key chart), and the back page had brief summaries of returns from the major asset classes. I then supplemented my monthly reports with other more detailed separate reports in specific areas of interest.
Over the years, I added more and more charts and more detailed commentary to the monthly report, mostly in response to requests from regular readers, and from advisers who used it in their regular client comms. This extended the length to more than a dozen pages.
Now that life has become a little more complex (with this pesky cancer thingy), I have decided to revert to a simpler format for the monthly report from now on. I still intend to cover more detailed aspects in separate reports, as I do now, but I will try to keep the monthly report shorter.
Regular readers will know that I don’t do this for idle curiosity or to get ‘hits’ or ‘likes’. I do my original, fact-based research because it directly informs how I invest my own money, and other firms and entities I advise.
In this new slimmed down monthly report I will start with global themes, plus comments on inflation, interest rates and commodities, as these are the main drivers of investment returns from Aussie investors, followed by some brief comments on the major asset classes.
First - my essential 1-page snapshot chart - covering Australian and US share markets, short and long-term interest rates, inflation, and the AUD/USD exchange rate. As usual, there are two versions – first is the traditional version on a single chart:

Plus the alternate version below, requested by several advisers - showing Australian and US inflation separately in the lower sections:
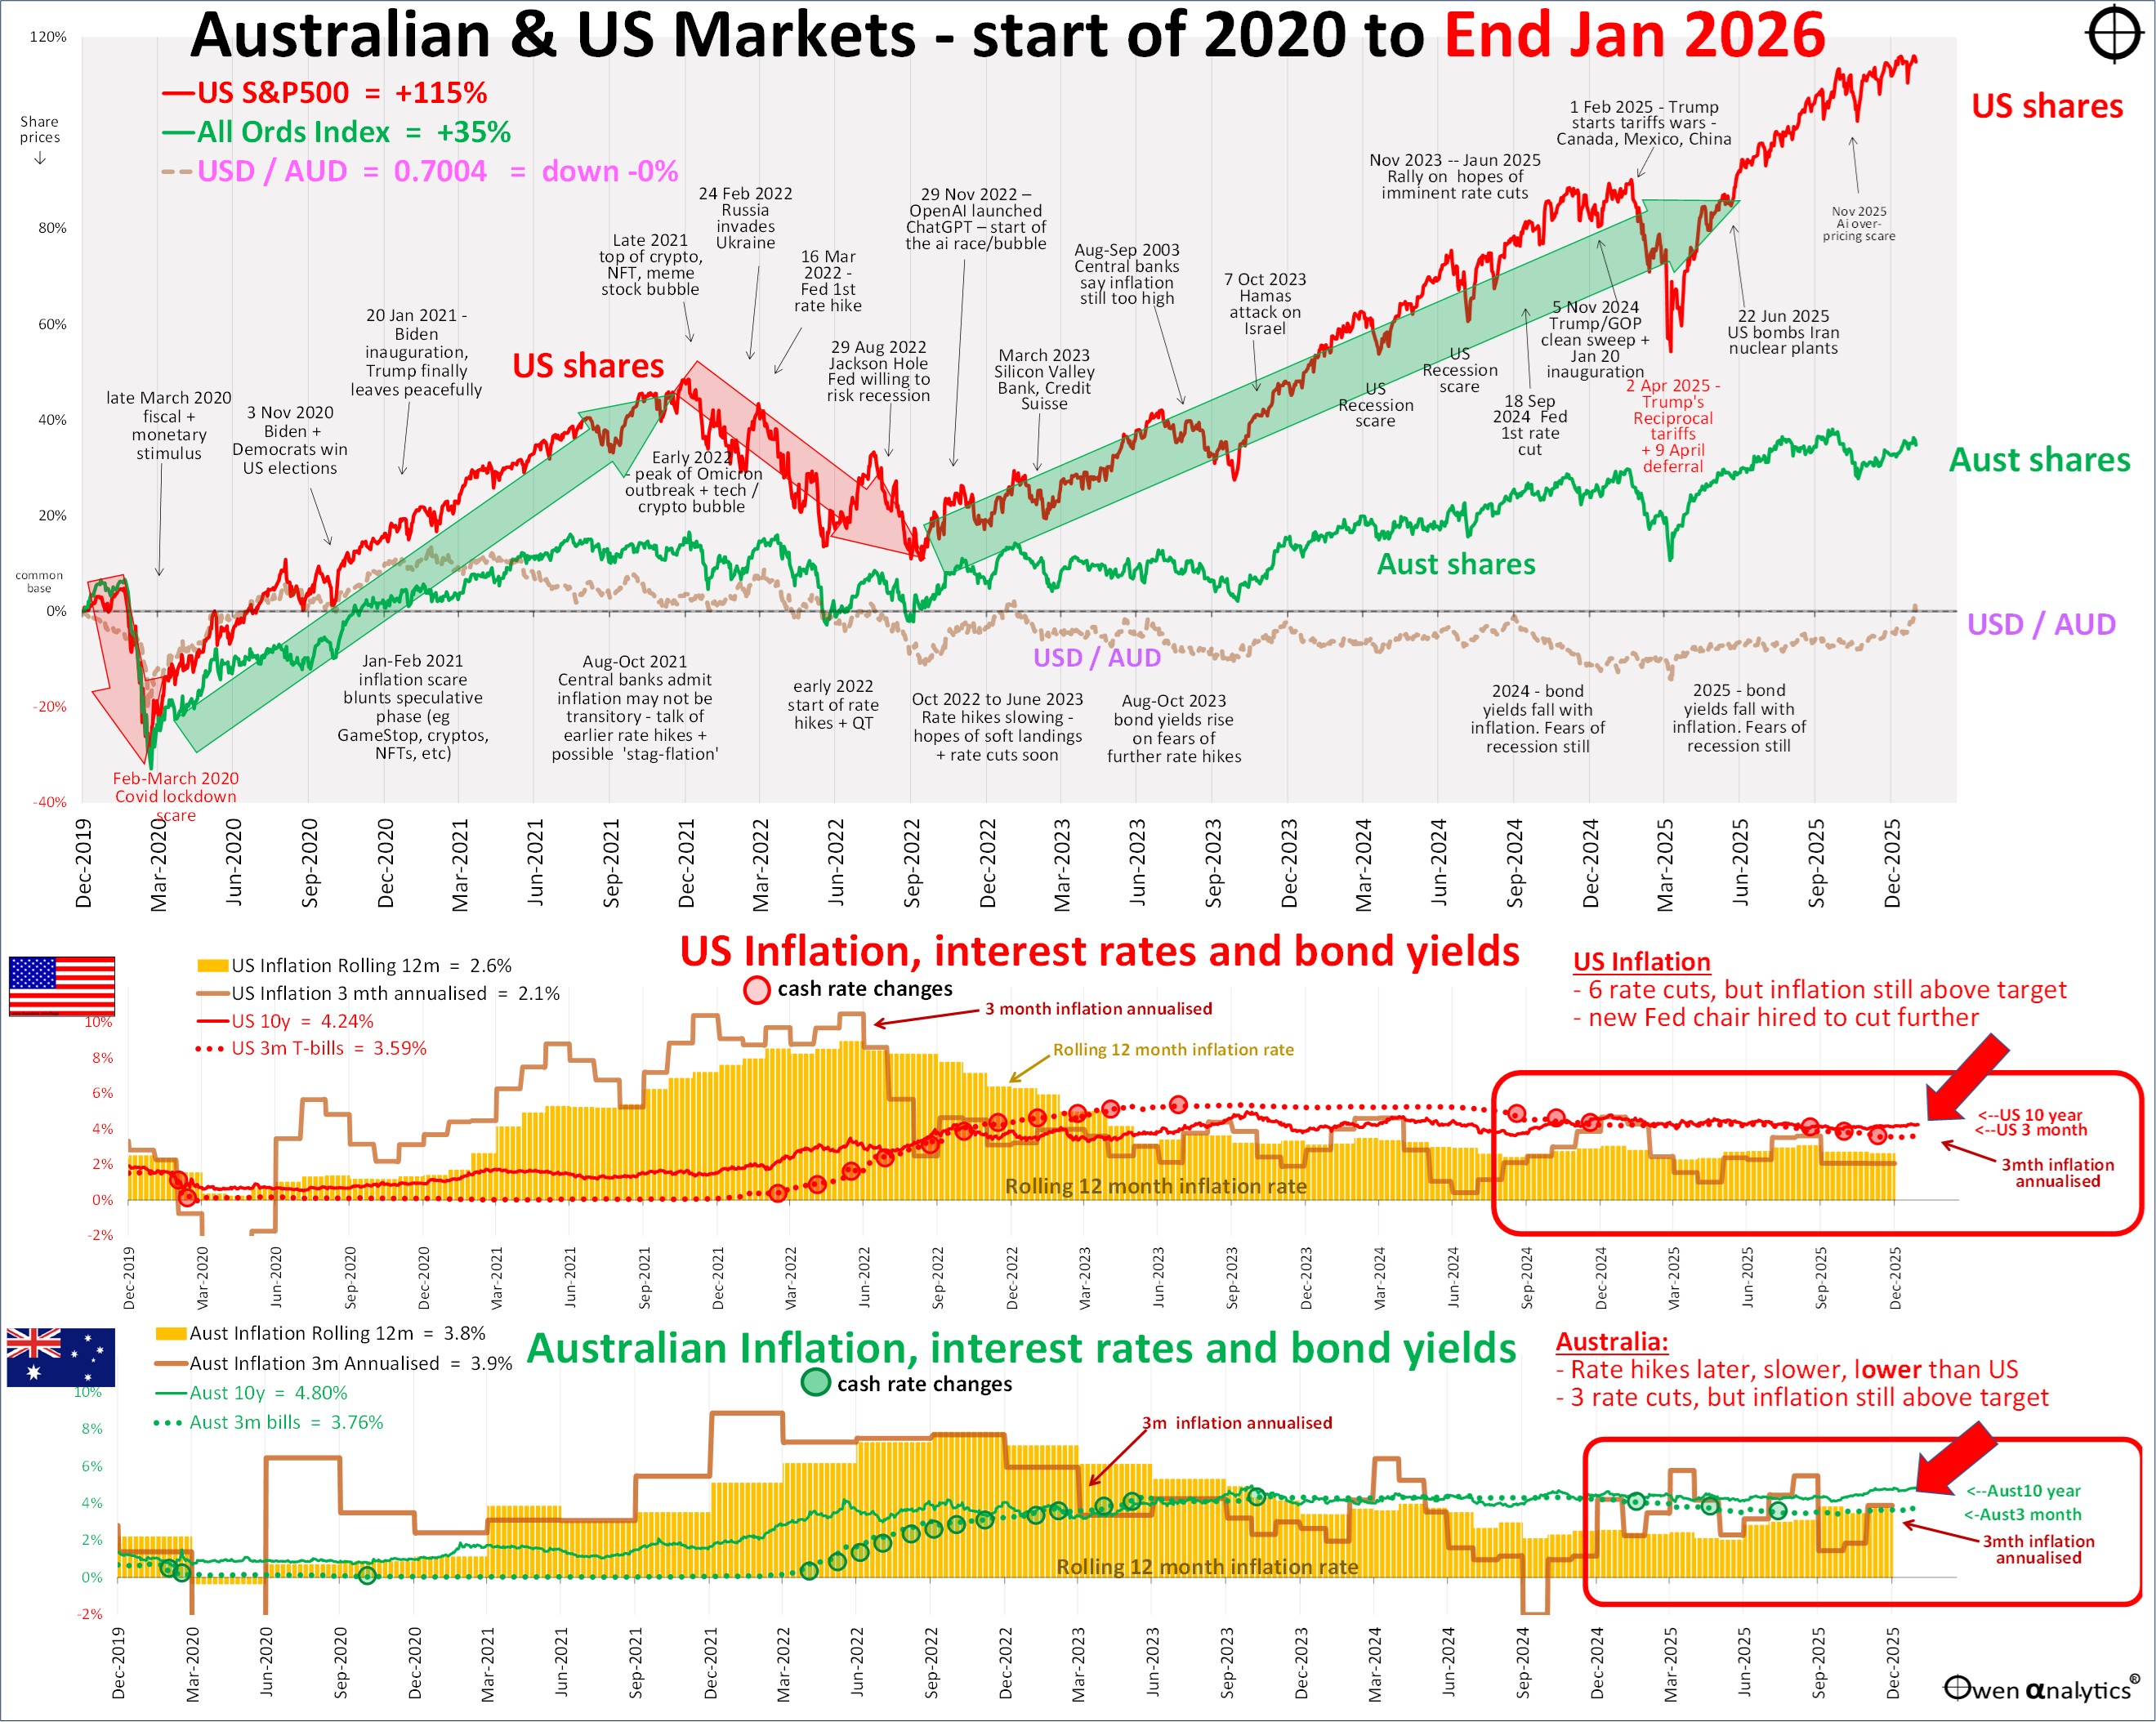
The beauty of these charts is that, even without reading the detail, and even from the back of the room, you can esily see where we are on share markets, currency, inflation, and interest rates. (I plan on dropping the first chart in future editions.)

January is traditionally a good month for US (and global) share markets as it is bonus month for most US middle-class workers, and most politicians and portfolio managers are on leave. Usually not much happens of note to upset financial markets. In Australia the holiday period is longer than elsewhere, and the highlights usually end up being the cricket, tennis, and perhaps the odd bushfire.
But there was plenty to rattle markets this January! Trump escalating his ‘excellent adventure’ in whole new directions – including abducting the President of Venezuela, seizing its oil, and appointing himself President of Venezuela. He also appointed himself head of the body to turn Gaza into a grand casino project, and he threatened to seize Greenland from Denmark. Trump also announced more tariff hikes and backflips, and stepped up his war on the ‘enemy within’ on the streets of US cities, killing more citizens.
Much happened in the rest of the world of course, but nothing affects global markets (including Australia) as much as US events because the US still has the largest, deepest, most liquid capital markets in the world.

Australian inflation continued to rise further above the RBA-s target 2-3% range. 12-month rate rose to 3.8%, and the annualised 3-month ‘running rate’ is even worse at 3.9%. The RBA should reverse course and raise rates. See my full report from a couple of days ago on Australian inflation, interest rates, unemployment –
US inflation also remains above the Fed’s 2% target. The Fed kept rates flat in its January meeting despite mounting political pressure, and also now threats of criminal proceedings against Powell. Trump has just announced Kevin Warsh as the new Fed Chair to replace Jay Powell when his terms ends in a couple of months.
Warsh may turn out to be another Marriner Eccles (obediently followed FDR’s instructions to cut rates and keep them low for a decade to reduce the cost of the US government’s War-time debt load). Alternatively, he might be another William McChesney Martin (appointed in 1951 to specifically continue to the artificial suppression of interest rates to help the government, but he immediately disobeyed orders and hiked interest rates to attack the Korean War inflation spike).
One of the bullish factors supporting share markets is the hope that Warsh will follow Trump’s instructions and cut rates further, or at least not raise rates, plus also reduce long-term rates by re-starting QE bond buying.

Commodities markets are gathering momentum and getting set for another medium-term rally. There are several main themes in play. ‘Sticky’ inflation is causing the paper money prices for ‘real’ assets (real estate, commodities) to rise. Actually, it’s not really commodities prices rising relative to paper money – it is the debasement of paper money relative to real assets. But it looks like commodities prices are rising.
We also have the ‘debasement’ trade (rising government deficits and spending, more central bank money printing) – and rising political turmoil inside the US and around the world, lifting precious metals. Gold was up another 15% for the month (in US dollar terms), on top of +65% last year. But gold was out-done by its poor cousin, Silver – up +20% for the month (it was up 65% for the month before falling back at the end), after a +150% gain in 2025.
Readers would know that I have studied gold in quite a bit of detail over the past several decades, and I hold gold in several forms – including in my own published ETF portfolio (and advised portfolios). However I know very little about silver and consider the current rally to be mainly FOMO-driven.
Industrial commodities demand is also being boosted by the global military build-up, the race to ‘renewables’, and the extraordinary ai/data centre boom, which is also creating unprecedented demand for industrial metals, energy and water.
Bitcoin? – Global strife should be good for bitcoin, which was supposed to be ‘digital gold’ and a solution for the decaying US dollar. However, bitcoin fell another -4% in January, and is now down by one third since its peak in October 2025. So much for ‘digital gold’! I hold no bitcoin, or other cryptos or NFTs or meme coins.
Oil prices were also up +14% in January with renewed Trump’s incursions in Venezuela, and rising tensions in Iran. Rising energy prices flowed through to fossil fuel share prices globally.

The local share market rose +1.6% in January after a rather pedestrian +7 gain in calendar 2025, when it lagged most global markets.
The main winners were miners thanks to mostly higher global commodities prices. Eg Gold miners (Northern Star +8%, Newmont/Newcrest +11%, Evolution +16%). Copper also lifted BHP by +22%, back above $50 for the first time in two years, and South32 +30%. Lithium and rare earths miners also benefited from higher prices. Fossil fuel producers also gained from higher oil prices. Likewise for uranium stocks.
Healthcare stocks were up a little virtually across the board after a very poor 2025. Most other sectors were down for the month: banks (continued rotation out of the still vastly over-priced CommBank into the other slightly less overpriced majors), discretionaries (mainly JB, Aristocrat), A-REITs (all down), Telcos, industrials, and most tech stocks.

It was a good start to the year as most global markets were up virtually across the board. All global industry sectors posted gains for the first time since October 2024.
Best of the major markets included Japan (exporters like Toyota benefiting from lower yen), China (led by Alibaba, Baidu), Taiwan (TSMC), South Korea (Samsung Elec).
The US market was up a more modest 1.4% (but the S&P500 still managed to post four new all-time record highs for the month). Gainers were mainly fossil fuels, staples, health care, industrials, materials, but most financials were down. The overall US market was dragged down by a mixed tech sector (which is spread across three sectors tech, comms, and discretionaries). Gainers included Meta/Facebook, Alphabet/Google, Amazon, Intel, Nvidia, but there were falls in Apple, Microsoft, Broadcom, Adobe, Oracle, Tesla, and Netflix.
US profit reporting season for Q4 2025 has been mostly good so far. The US market may be over-priced based on underlying profits, but the share price gains of +16% in calendar 2025 were actually underpinned by matching +16% growth in corporate earnings per share for the year. The market is expensive, but no more so than it was a year ago. I have covered this extensively in detailed reports - see below.

Bond markets posted small gains in January after another poor year in 2025.
Treasury yields rose in Australia across all maturities as markets priced in rate hikes and sticky inflation. Elsewhere, yields rose in Japan (back up to levels not seen since last century thanks to new PM Sanae Takaishi threatening even more fiscal blow-outs and more debt), and yields were also up a little in the US and UK. However, yields fell back in other markets on slower growth outlooks.
Regular readers will know that I have been out of fixed rate bonds since 2021 in my own (and advised) portfolios, with fears of sticky inflation coming to fruition.

The Aussie dollar had a strong month in January, rising above 70 US cents for the first time in two years, thanks to rising commodities prices, which lifted the dollar against not only the weaker US dollar, but also against all other major currencies.
But the currency story is really about Trump’s ongoing attempts to bring down the US dollar to make US exports cheaper for foreign buyers, and also make imports more expensive for US importers and consumers. Although most of the market chatter was about the US trying to halt the competitive decline of the Yen, the US dollar actually fell more against the weaker British Pound, and similar amounts against the Euro.
Trump has certainly succeeded in trashing the US dollar -which is a much more sensible strategy than unilateral tariffs, but the dollar is still relatively strong and is only back down to where it was ten years ago.
For more on the myth of the decline/death of the US dollar, see -

I see several themes driving markets in the medium term:
-
- Continued shift from rules-based order and win-win multilateral trade, to power-based order and win-lose trade deals. This shift started in the 2010s with US/Europe letting Putin take Crimea, and US/Japan letting China militarise the South-China Sea, but accelerated under Trump. Lower cross-border trade & investment, projects delayed, more reliance on subsidies, inflationary on-shoring of uneconomic industries.
- Sticky inflation - political pressure on central banks to keep rates low – populist pressure on governments to keep deficit spending. Tariffs + onshoring adding to costs/prices. Bond yields to drift up, risk of bond yield spike, or sudden need for rate hikes, unsettling/breaking share markets.
- Share markets continue tech/ai rally, supported by good profit growth for now. Shares everywhere are expensive but buoyed by loose monetary & fiscal policies, plus a near certainty that governments will throw money at any problem.
- Commodities rally gathering pace – rising demand soaking up over-supply, ai / data centre boom (industrial metals, energy, water, land), global re-armament – especially Europe, Japan, Canada. This should support ASX market, as long as banks avoid a local recession.
- De-dollarisation fears probably over-done, but is driving up gold, silver, but not bitcoin. US treasury yields not at risk for now.
- The current boom will end one day of course. All markets everywhere, including and especially Australia, are over-priced on fundamentals, not just US-big tech. However, each boom is different and the triggers for the inevitable bust are different each time. See my recent 6-part series on share market over-pricing and where we are now -
-
- World share market pricing - Part 3: Forward P/E ratios and earnings growth assumptions – The US market is actually better placed than most! (20 Aug 2025)
‘Till next time – safe investing and stay healthy!
For asset class returns in 2025 –
For 2025 year-end wrap-up -