Greetings fellow investors!
The Fed’s next rate setting meeting is on 28 Oct. Here is the US version of my Australian RBA cash rate barometer that I have used in portfolios for 20 years.
It is NOT an OPINION on whether rate hikes/cuts are justified, or will work, or timing. It’s a FACT-based measure of what the WEIGHT OF MONEY is saying. I put more faith in the weight of money than opinions.
Here’s my recent report on the Australian model, which also points to further RBA cash rate hike/s -
https://www.owenanalytics.com.au/2026oct16-cash-barom
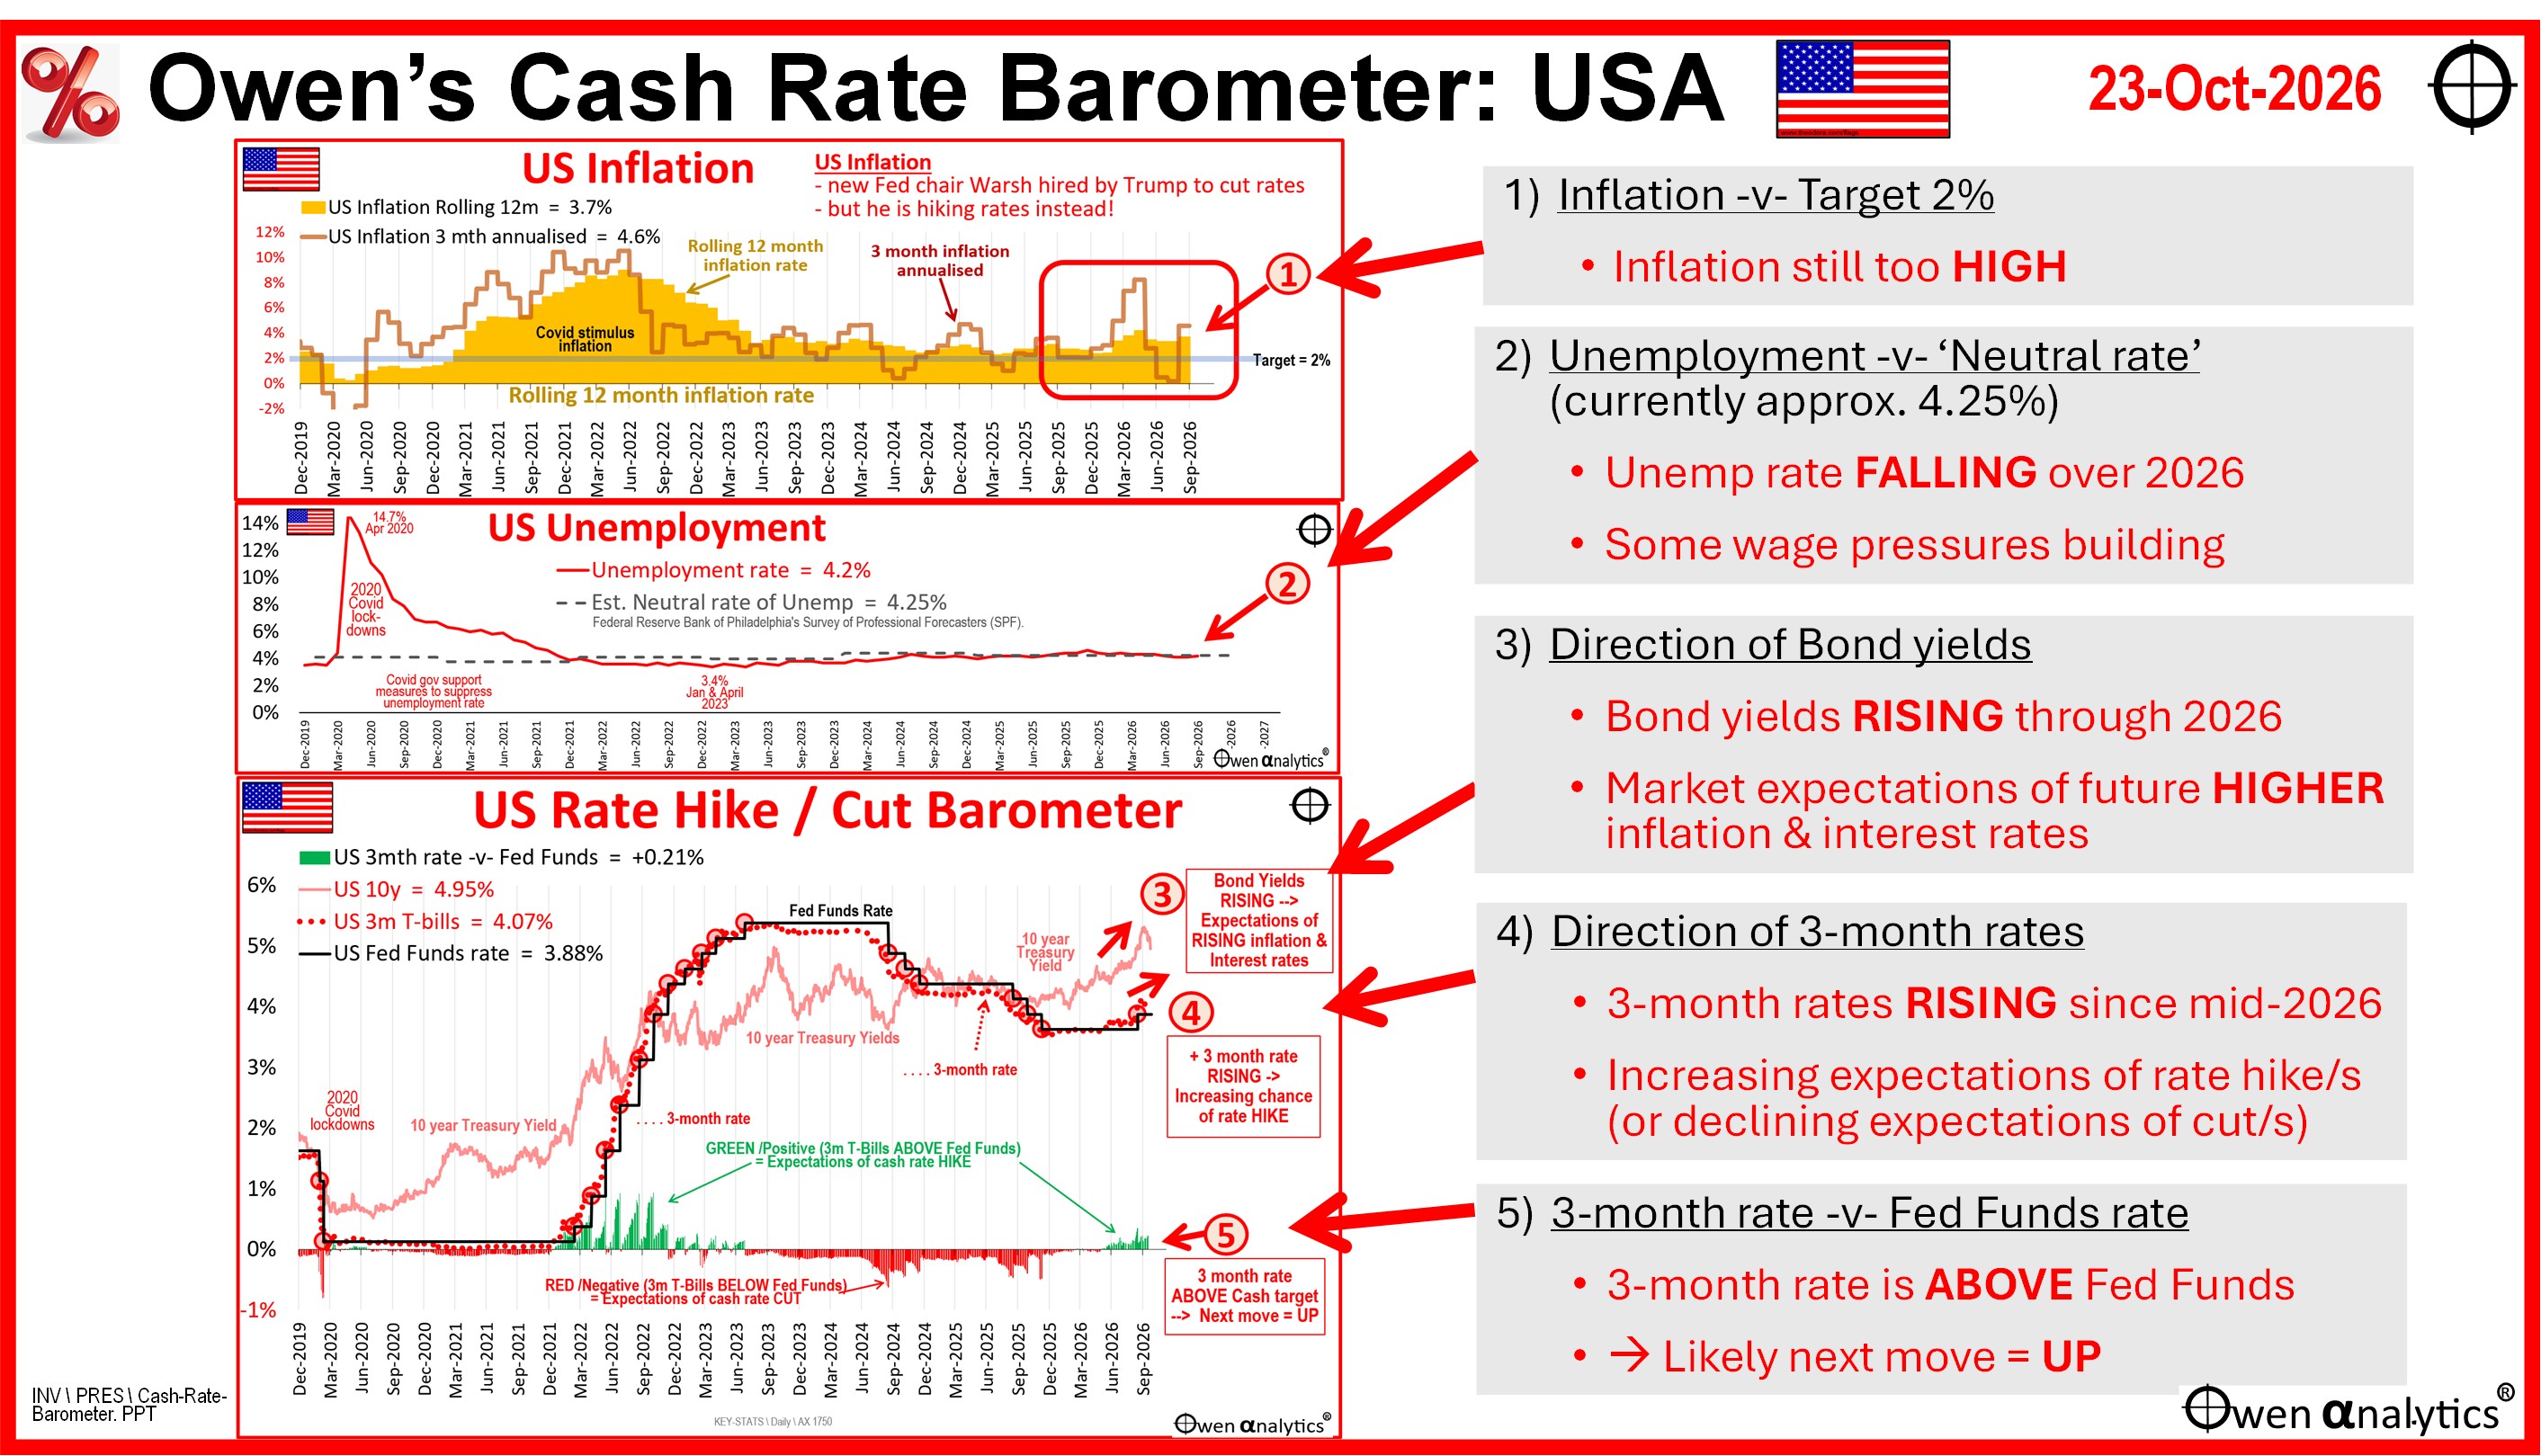
Here’s what the 5-step barometer is pointing to now for the US market.
US model
The first 2 steps (inflation & unemployment) are obvious starting points but their implications for interest rates rely on judgement and opinion and have problems with assumptions, data, lags. The power is in steps 3, 4 & 5, which are factual indicators of the WEIGHT OF MONEY - ie where institutions are putting their money.
STEP 1) INFLATION relative to the Fed’s 2% target -> likely rate HIKES
US inflation is still running above target on numerous measures. US monetary and fiscal policies were too loose for too long during and after Covid, plus high fuel prices this year with the War on Iran.
Trump installed new Fed Chair Warsh to cut rates but instead he hiked rates in September, the first hike following 6 cuts in 2024-5. Inflation is still too high and spending remains robust (household, corporate, government).
STEP 2) UNEMPLOYMENT relative to ‘Neutral rate’ -> pressure mounting for HIKES
I use the Philadelphia Fed's Survey of Professional Forecasters, which estimates the current Neutral unemployment rate at approx. 4.25% (Q3 2026). https://www.philadelphiafed.org/surveys-and-data/real-time-data-research/spf-q3-2026
The US civilian unemployment rate has been drifting down this year from 4.6% last November to 4.2%, pointing to potential increasing wage pressures.
STEP 3) DIRECTION of 10-year Treasury yields -> likely HIKES
US treasury yields have risen strongly this year from below 4% to above 5%, indicating the weight of money fears higher inflation and interest rates ahead. Bond markets are having trouble absorbing not only increasing supply of debt due to the government’s unabated deficit spending, but also mammoth volumes of ai / data centre debt issuance.
STEP 4) DIRECTION of 3-month rates -> likely HIKES
3-month T-bill yields have also been rising this year, even after the Fed’s September hike. The weight of money is pointing to rising expectations of higher cash rates (or declining expectations of a rate cut).
STEP 5) LEVEL of 3-month rate versus Fed Funds rate -> likely next move UP
The green/red bars in the lower section of the bottom chart show that 3-month rates have been ABOVE Fed Funds since the middle of this year, even after the Fed’s September hike. The weight of money is still pointing to another HIKE.
This tool has worked almost like clockwork for the past 20 years running portfolios. It is not always perfect, as it does not anticipate sudden events like Covid, but I like it because it is fact-based and reflects what the weight of money is saying, rather than opinions of economists and market ‘experts’.
For more on US interest rates and inflation –
· US 10-year yields ‘soar’ above 5%. Shock Horror! But actually they’re still rather LOW relative to history, logic, fundamentals, and inflation. Get used to it! (27-Sep-2026)
· Inflation BIG Picture: Boomers got rich by lucky timing. Next Gen to get higher inflation & rates (25-May-2026)
· Iran war hands politicians another free ticket to blame oil prices for inflation & rate hikes (14-Mar-2026_
‘Till next time – safe investing and stay healthy!