Greetings fellow investors!
US 10-year Treasury yields ‘soaring’ above 5% this week triggered countless shrill headlines and dire predictions of doom and gloom. Short-term market moves make for great ‘shock-horror!’ headlines but they are just ‘noise’ for serious investors.
First: Perspective. The average investor will save for 30-40 years then spend for another 30-40 years, so their ‘investment timeframe’ is 70-ish years (plus even longer if we want to leave something for family or charity and not ‘die with zero’). Investment timeframes are measured in decades, not days or weeks or months or even years.
Second: Why focus on 10-year treasury yields? They are important in finance because they are the central foundation that underpins valuation models, corporate finance, discounted cash-flow analyses. They are the starting point from which all other assets are measured and valued. According to academic textbooks anyway. Why? Because academic finance theory is based on two very flawed assumptions: (a) that US Treasuries are ‘Risk-Free’, and (b) that 10 years is ‘long term’. Serious investors know better.
The fact is that even after the recent ‘surge’ in yields on 10-year US Treasuries, they are actually still LOW relative to history, logic, fundamentals, and inflation. Here’s why:
1: History
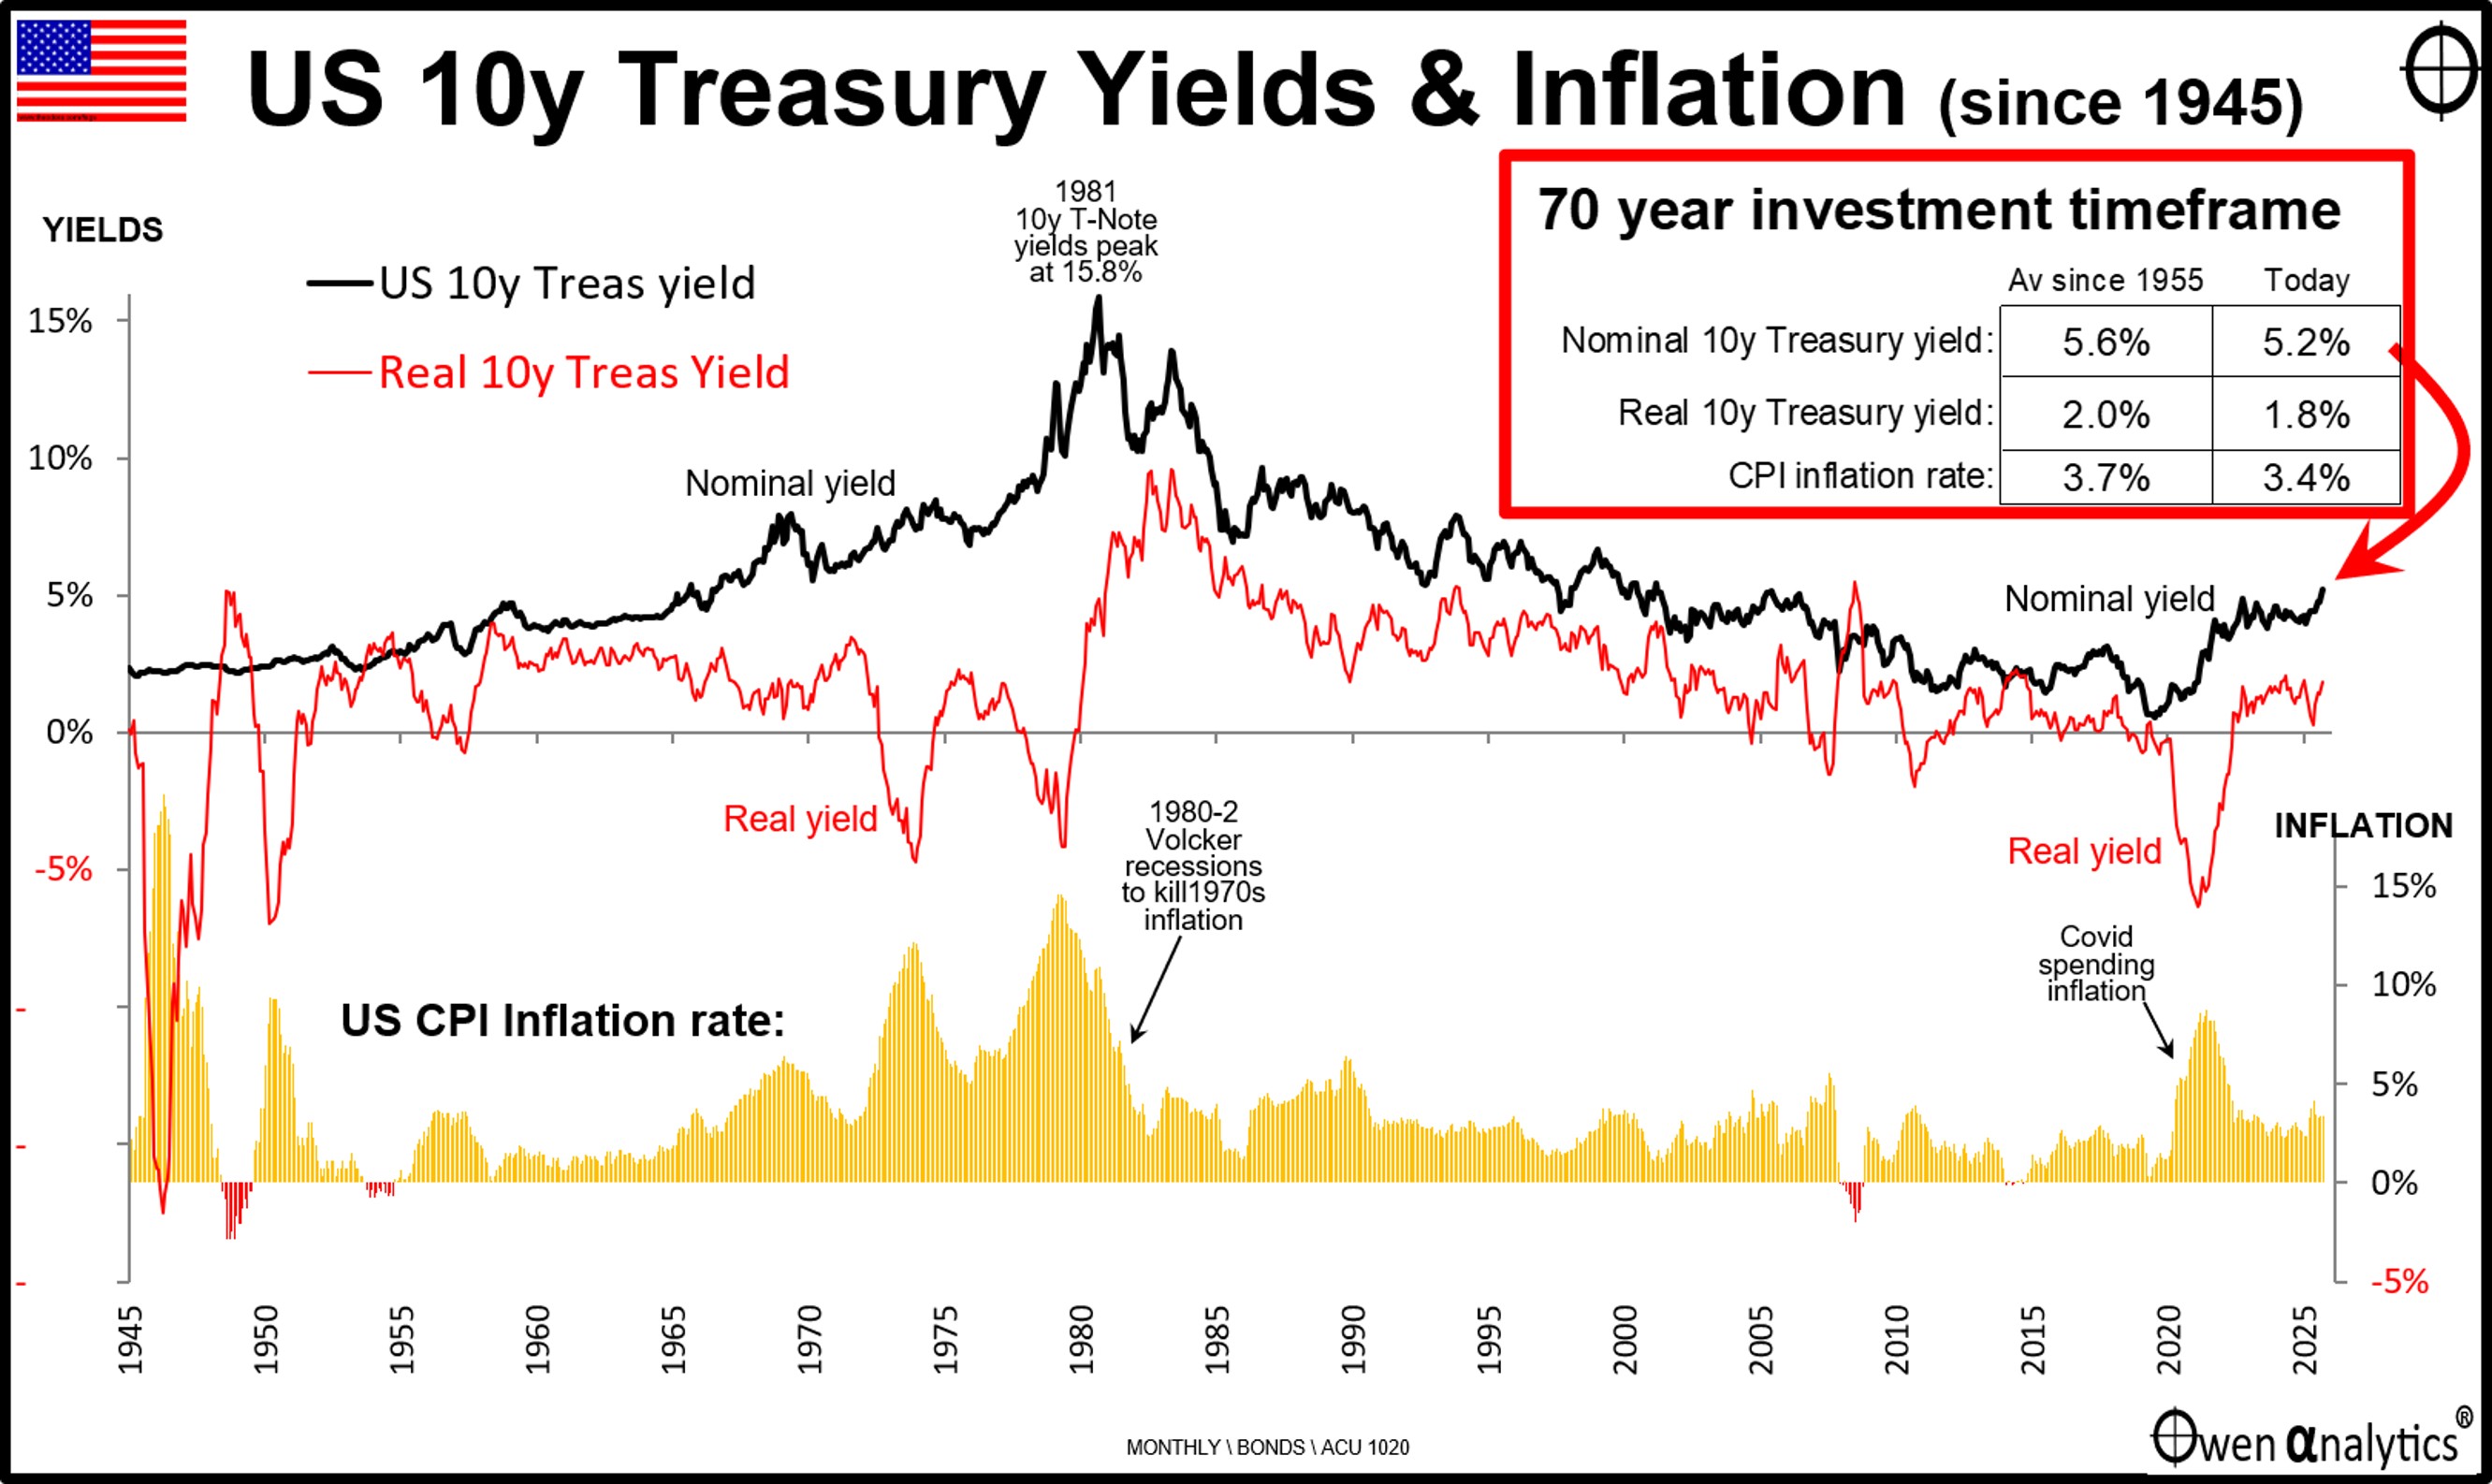
With an average investment timeframe of 70 years or so, today’s yield of 5.2% is still LOWER than the 5.6% average over the past 70 years (or 5.8% 50-year average, or 5.3% 60 year average, etc)
2: Logic
10-year Treasuries should trade at around a 1% ‘term premium’ above the expected average CASH rate (the ‘term premium’ is the annual return above cash to compensate for having to wait 10 years to get your money back).
Logically, the expected average US cash rate should be around 4% to 5% (requiring an average 10-year yield of around 5% to 6%). Why?
The expected average cash rate (price of money) in an economy should be around the same as the expected average rate of nominal growth in the overall economy in order to reduce the risk of an inflation spiral (or deflation spiral).
Expected average nominal rate of economic growth of around 4% to 5% pa: made up of: around 1% to 1.5% av POPULATION growth, plus around 1% av PRODUCTIVITY growth, plus say 2% av INFLATION.
Then add the 1% term premium to arrive at an expected av return of around 5% to 6% on a 10-year treasury.
(That is actually a rather pessimistic outlook for the US economy. Personally I would expect more than that so I would demand more than 6% on a 10-year Treasury).
3: Fundamentals
FUNDAMENTALS – the chart highlights the great era of declining inflation, interest rates and yields since the 1980-2 Volcker recessions that killed off the 1970s stagflation. The problem is that the fundamental factors that drove those wonderful decades of declining inflation, interest rates and yields have not only ended, they have now REVERSED:
· Multi-lateral free trade has turned into protectionism, combative ‘deals’, tariffs, trade wars
· Outsourcing to low-wage countries has turned into on-shoring
· ‘Comparative advantage’ has turned into ‘self-sufficiency’
· ‘Just-in-Time’ supply chains have turned into ‘Just-in-Case’
· Cheap oil from a stable middle-east has turned into expensive oil and instability
· Small, hands-off government has turned into big, interventionist government
· De-regulation has turned into re-regulation
· The demographic dividend from baby boomers in the workforce has turned into aging populations
· Abundant labour from free movement of people has turned into xenophobic backlashes and immigration restrictions
· Free movement of ideas has turned into geopolitical restrictions and bans
· Central bank independence has turned into increased government pressure for looser money
· Fiscal discipline has turned into uncontrolled deficits and debts
· Lower military spending from the ‘peace dividend’ with the end of the Cold War has turned to military build-ups everywhere
These reversals of fundamental drivers means we are now into the next era of higher inflation, interest rates and treasury yields.
See -
· Inflation BIG Picture: Boomers got rich by lucky timing. Next Gen to get higher inflation & rates (25-May-2026)
4: Relative to Inflation
Today's yield on US 10-year treasuries (5.2%) is 1.8% above US inflation (3.4%). This margin is below the 70 year average margin of 2.0% above inflation. However, that historical average margin of 2% was artificially depressed by the US government’s ‘financial repression’ in the 1940s and 1950s to artificially lower the cost of servicing its huge war-time debts.
The US government is once again running up huge war-time-like debt levels and once again attempting ‘financial repression’ to artificially lower the interest burden. Artificial government intervention rarely lasts long. The market always wins. Not only will inflation be higher than in recent decades, the yield margin above inflation demanded by market investors will also probably rise.
Inflation – BIG picture
Although shrill headlines about short-term moves are just market ‘noise’, the fact that the last three decades of great returns from declining inflation, interest rates and yields is over, and we are into the next (probably multi-decade) era of higher inflation, interest rates and yields IS of critical importance for long term investors.
See -
· Inflation BIG Picture: Boomers got rich by lucky timing. Next Gen to get higher inflation & rates (25-May-2026)
· The Low Inflation era of great returns is over. Investing just got a whole lot harder! (16 Apr 2024)
· Iran war hands politicians another free ticket to blame oil prices for inflation & rate hikes (14-Mar-2026_
· 1973-4 Oil Crisis – Fact check. Impacts on inflation, interest rates, shares, FX, gold. What’s same/different now? (6-Apr-2026)
· My latest podcast with Michael Yardney: Why Boomers got lucky, and why future returns will be very different for today’s investors (14-Sep-2026)
A quick note on terminology. ‘Treasuries’ not ‘Bonds'
The term ‘treasures’ generally refers to all government debt securities, including ‘bills’ (maturities of up to one year), ‘notes’ (maturities from 1 to 10 years), and ‘bonds’ (maturities of more than 10 years). The majority of US debt securities (‘treasuries’) are ‘T-Notes’ (maturities up to 10 years).
In the Australian market the usual custom is to use the term ‘bond’ to refer to treasuries of all maturities longer than a year. Standard 10 year government securities are called ‘bonds’ in Australia, but in America and elsewhere they are called 10 year Notes or T-Notes).
‘Till next time – happy investing and stay healthy!