Greetings and Happy New Year fellow investors! Here’s my global markets wrap-up of 2025 for Aussie investors, covering Aussie & global share markets, interest rates, inflation, bonds, currencies, commodities, crypto, and more.
Key points:
- Contrary to popular media nonsense, the current boom is not just confined to just a few US tech giants. It has been a widespread boom across industry sectors, countries, and stocks.
- Share markets are vastly over-priced of course (which I have written about extensively), but the big share price gains in 2025 did NOT stretch pricing further because they were underpinned by strong growth in corporate profits.
- For bond markets it was a fourth straight year of poor nominal and real returns. I have been out of bonds in portfolios since 2021 due to (realised) fears of sticky inflation, and the unwillingness of governments and central banks to reign it in.
- Plus inflation, interest rates, currencies, commodities, crypto, and much more.
- Look out for my next story on asset classes & diversified portfolio returns, and also my story on outlooks, risks and opportunities for 2026.
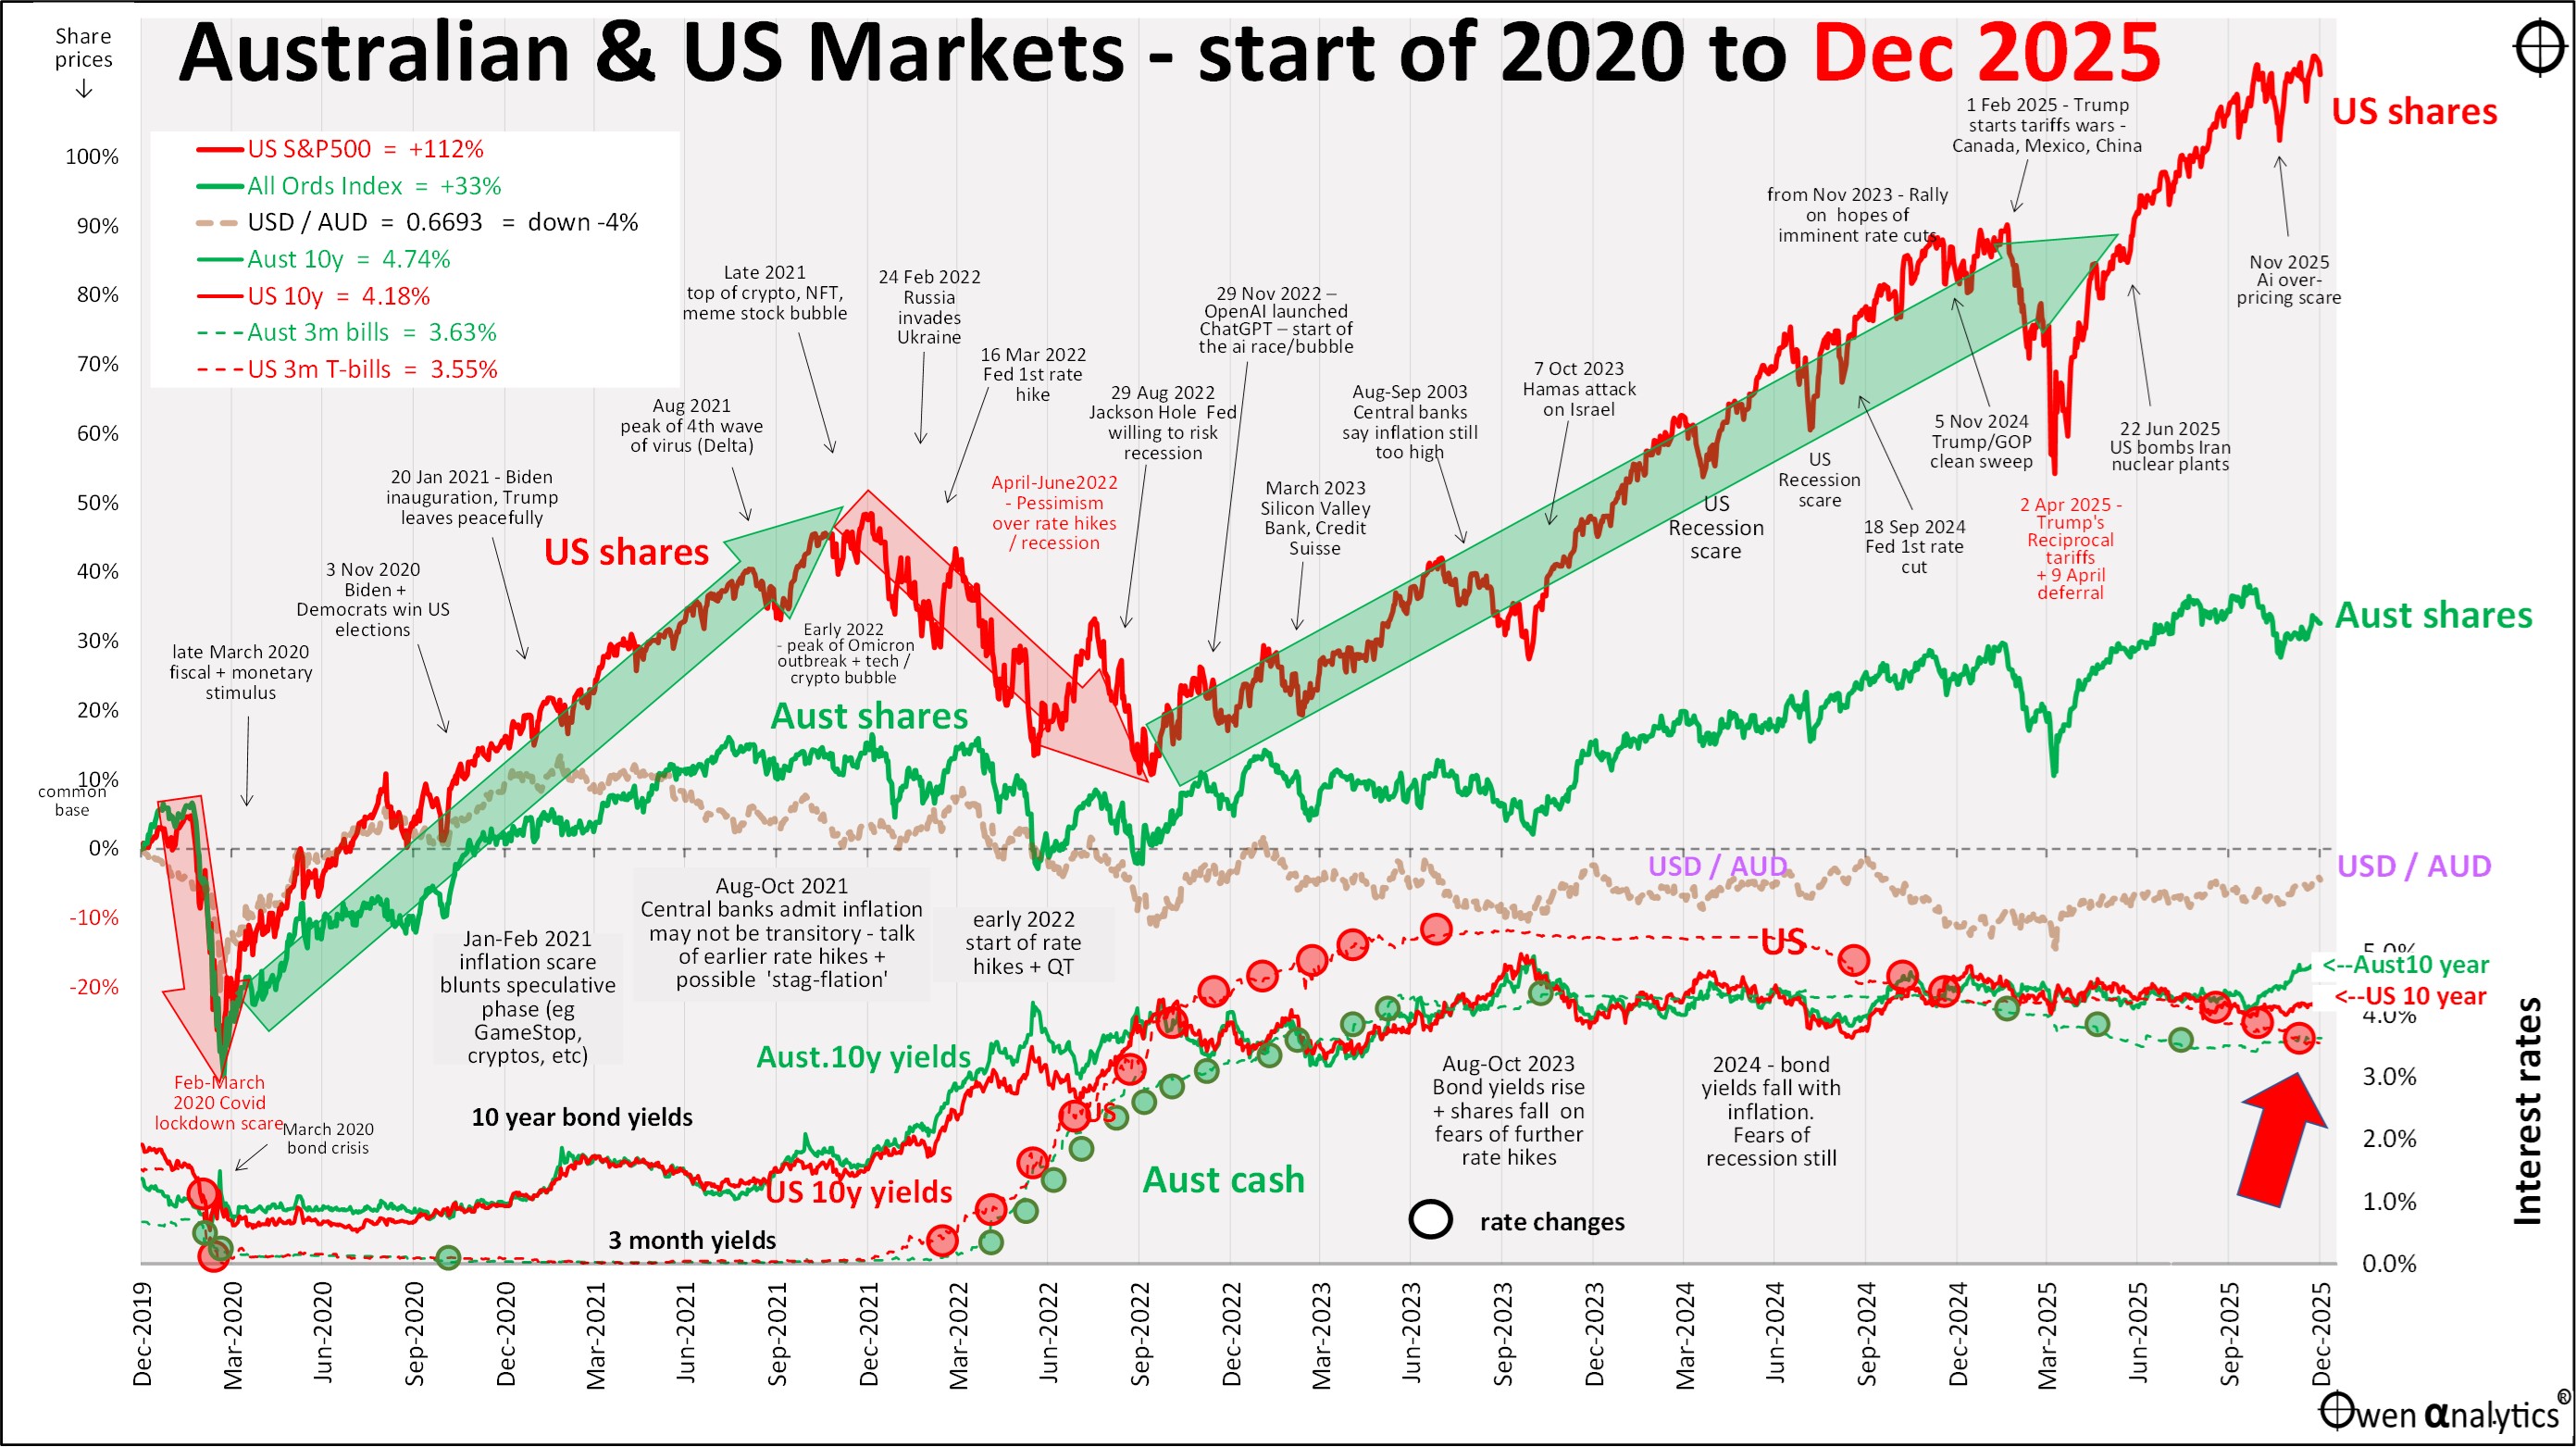
First - my essential 1-page snapshot chart - covering Australian and US share markets, short and long-term interest rates, inflation, and the AUD/USD exchange rate. As usual, there are two versions – first is the traditional version on a single chart:
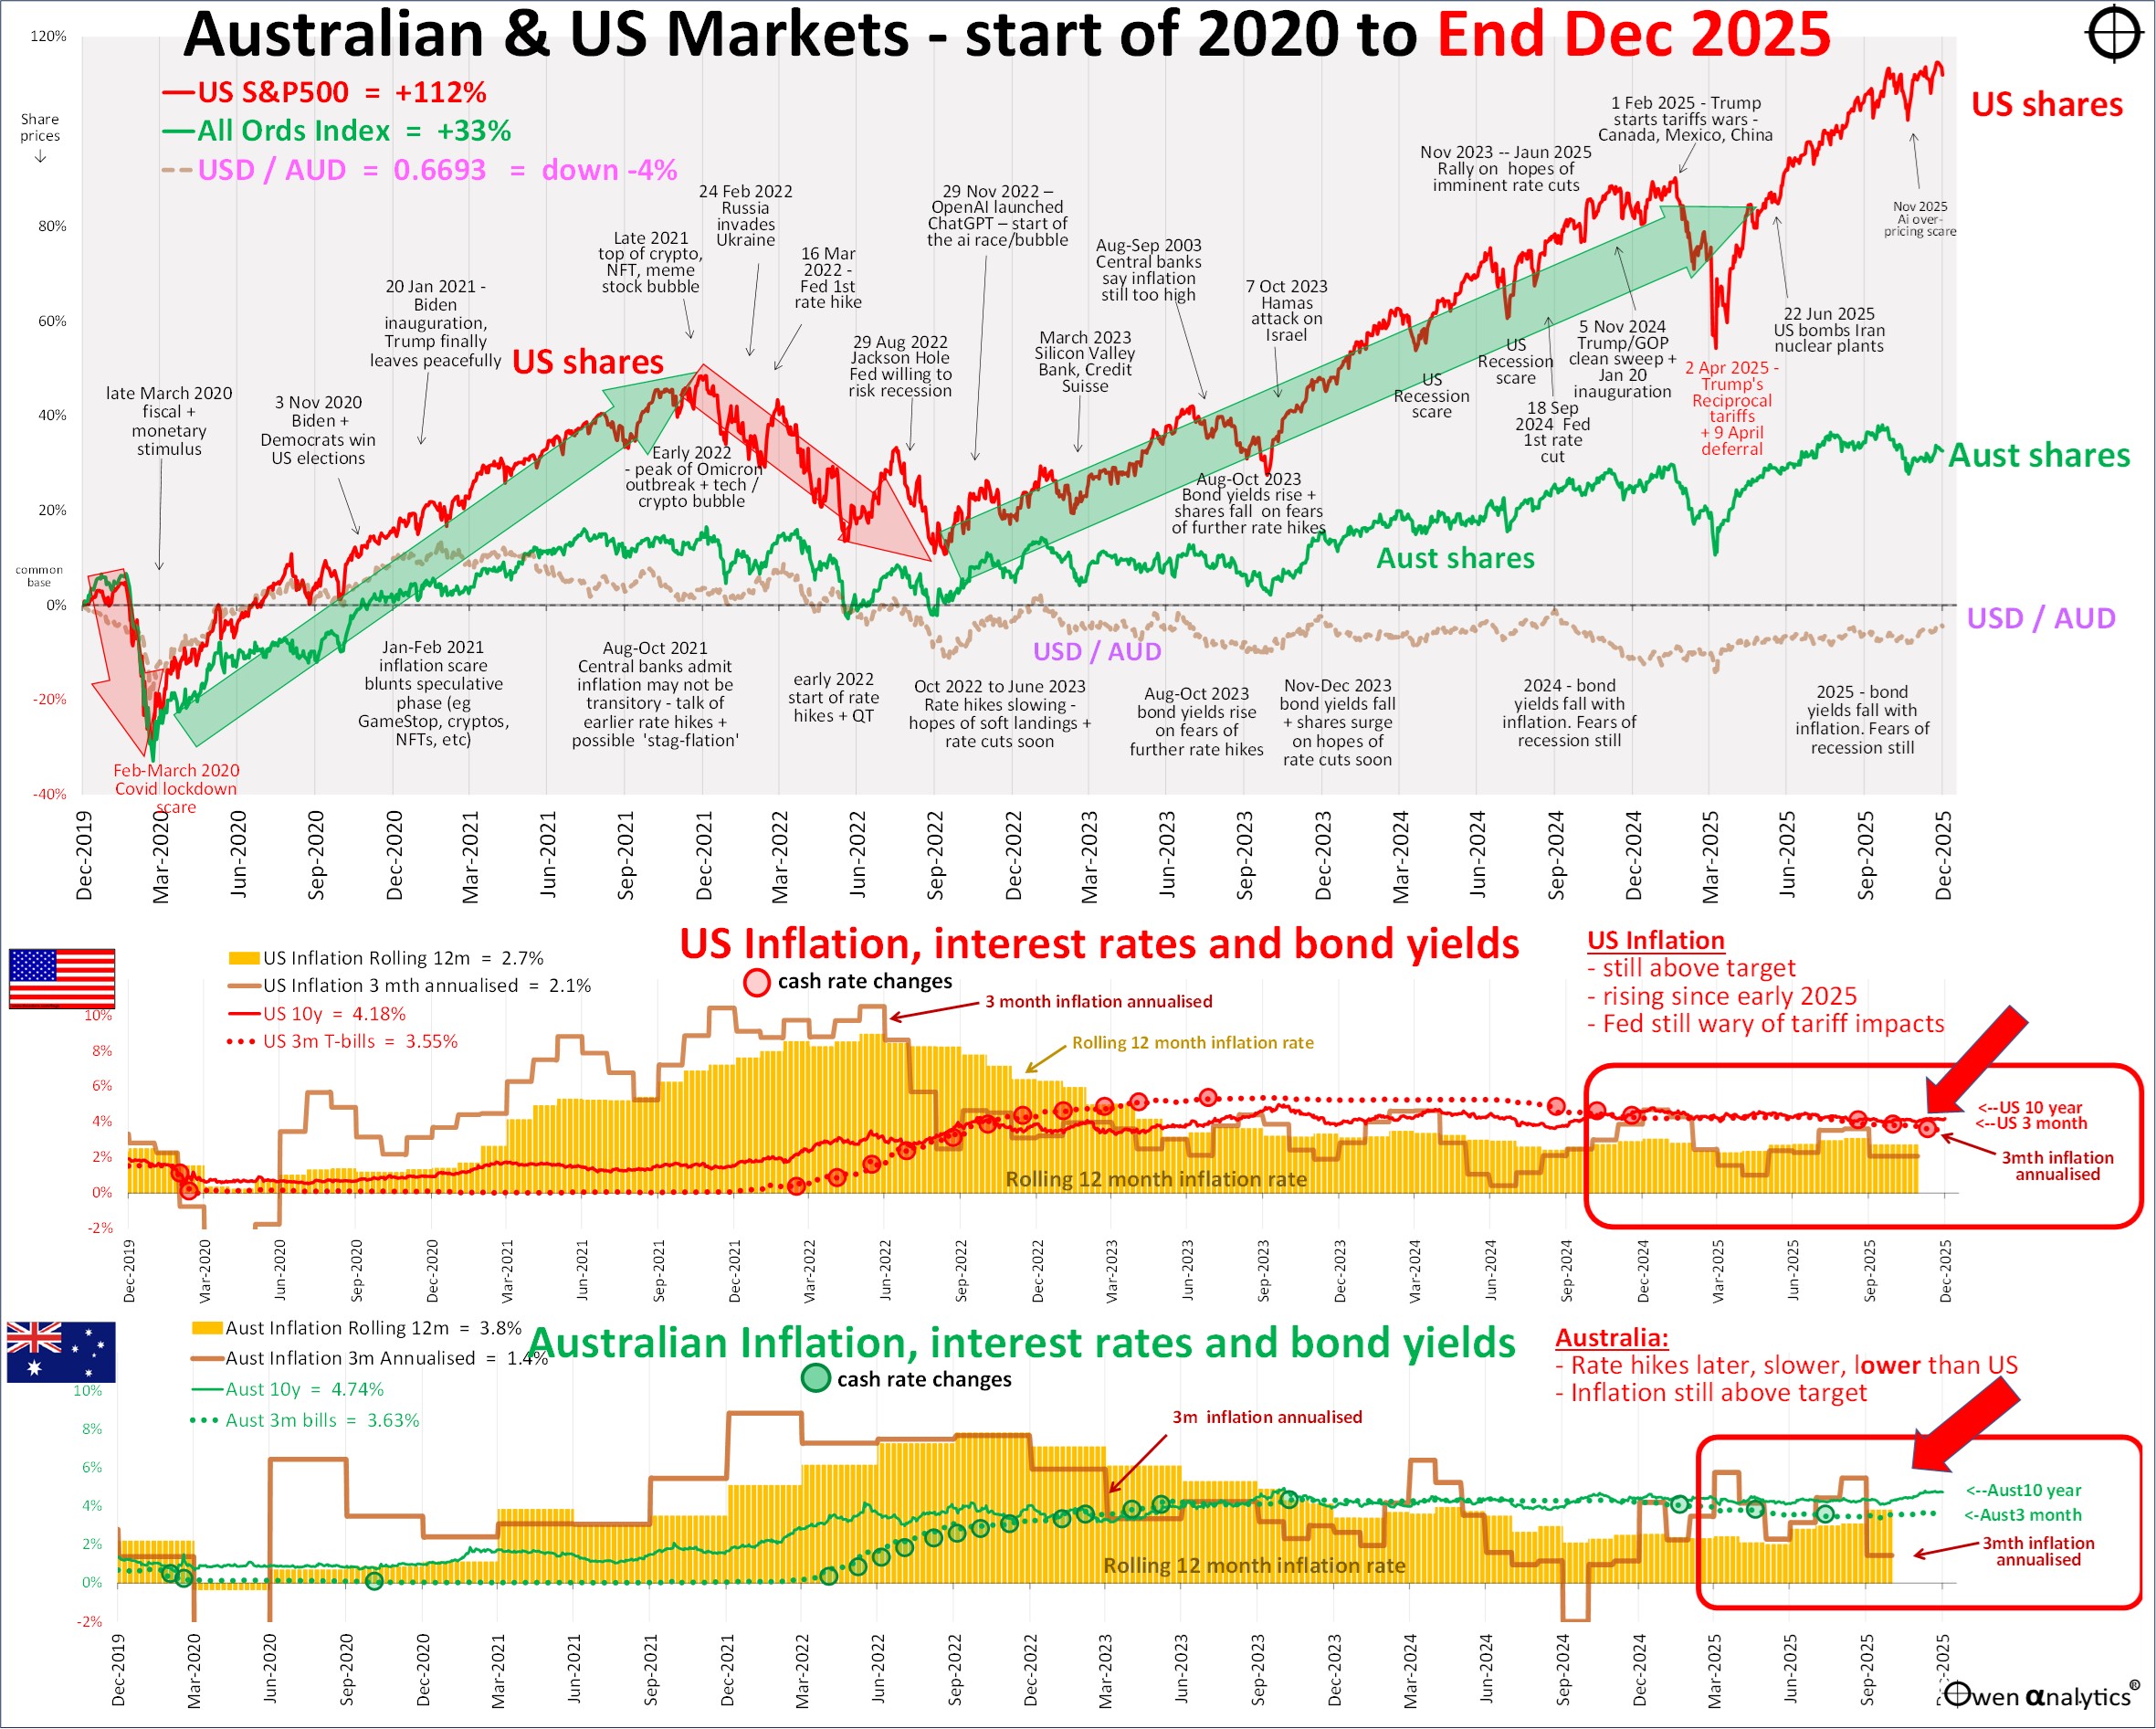
Plus the alternate version below, requested by several advisers - showing Australian and US inflation separately in the lower sections:
Share markets
Global share markets rose in December to cap off a third consecutive year of above average returns since the big rate hike sell-off in 2022.
Global Industry Sectors
The next charts show total returns from global sectors in the past three years:
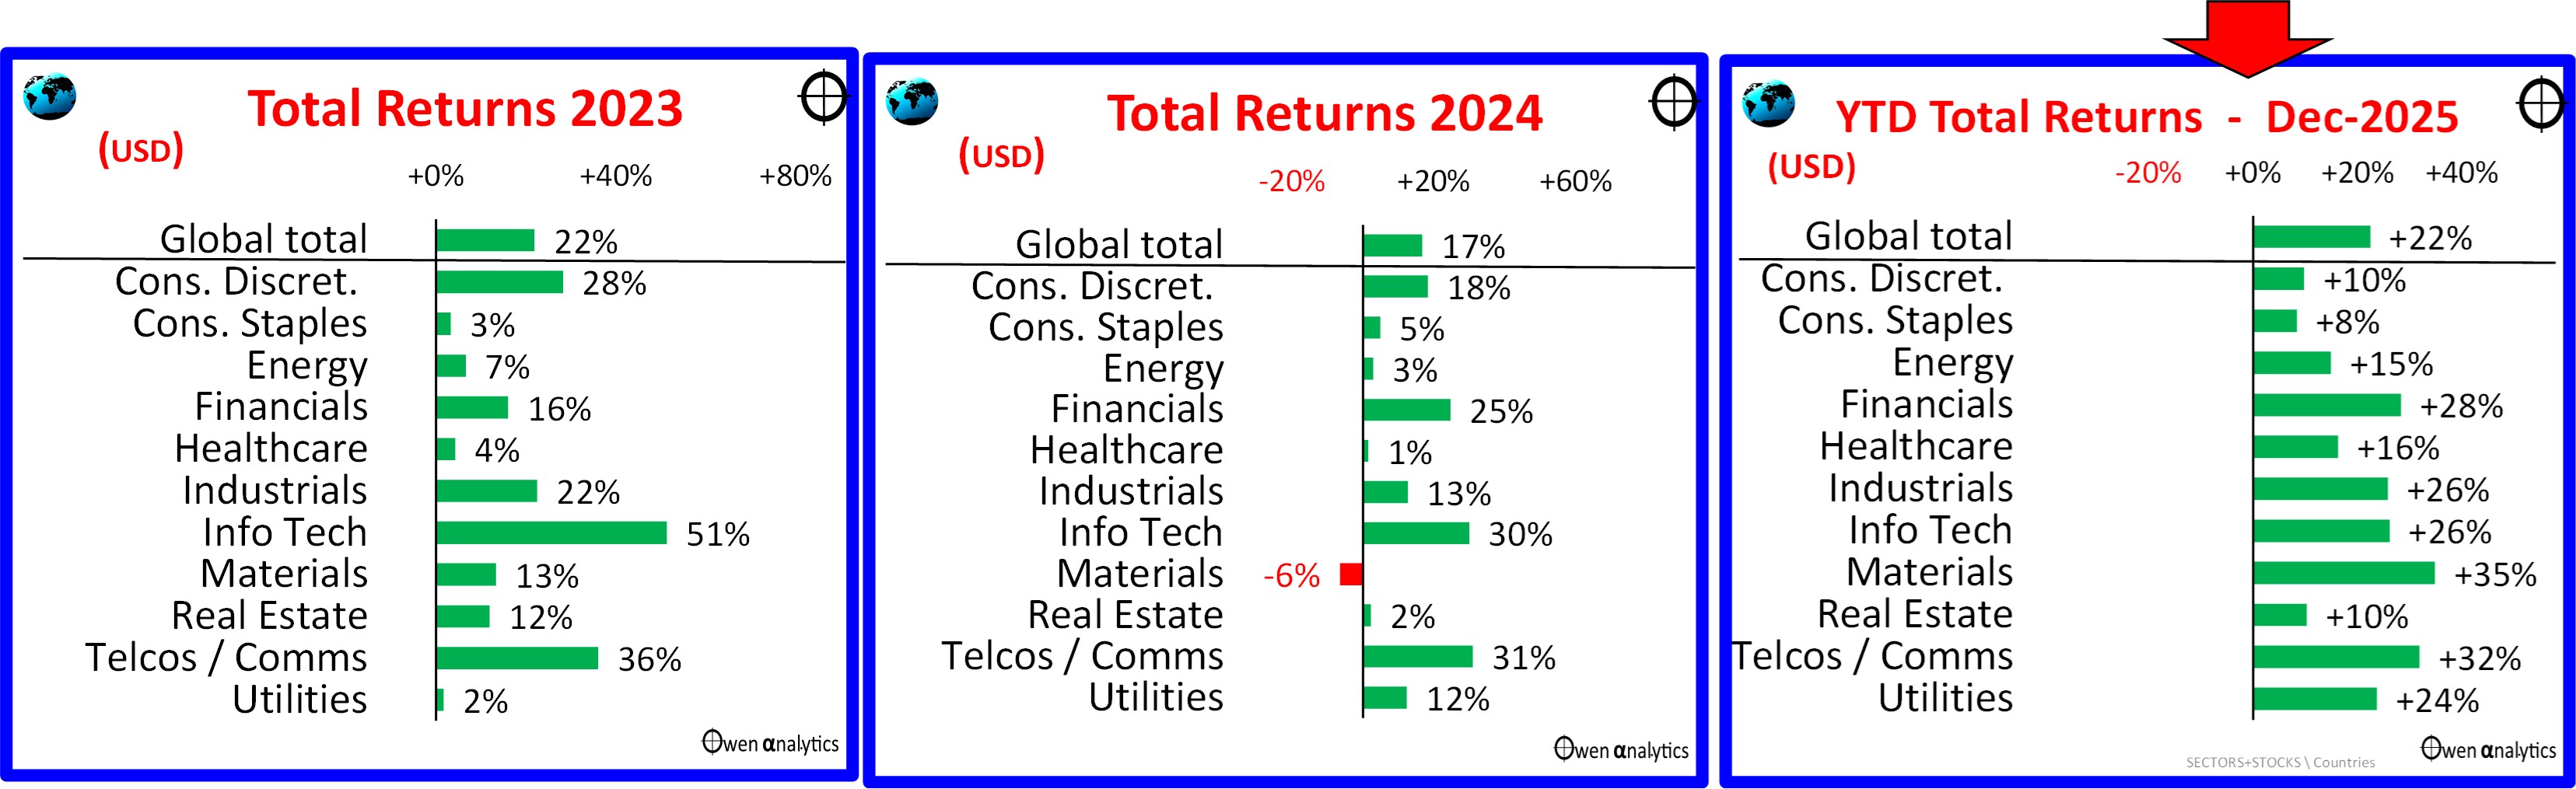
All global industry sectors had a good year in 2025 (right chart). Even better than 2024 (middle chart), and more evenly spread across industry sectors than 2023 (left).
Contrary to popular media nonsense, it is not a narrow boom of just a few US tech giants, it has been across the board, across the vast majority of sectors, countries, and stocks.
Major global stocks
Here is the picture for the largest global stocks (all of which are US based) for 2025 and the last 2 years:
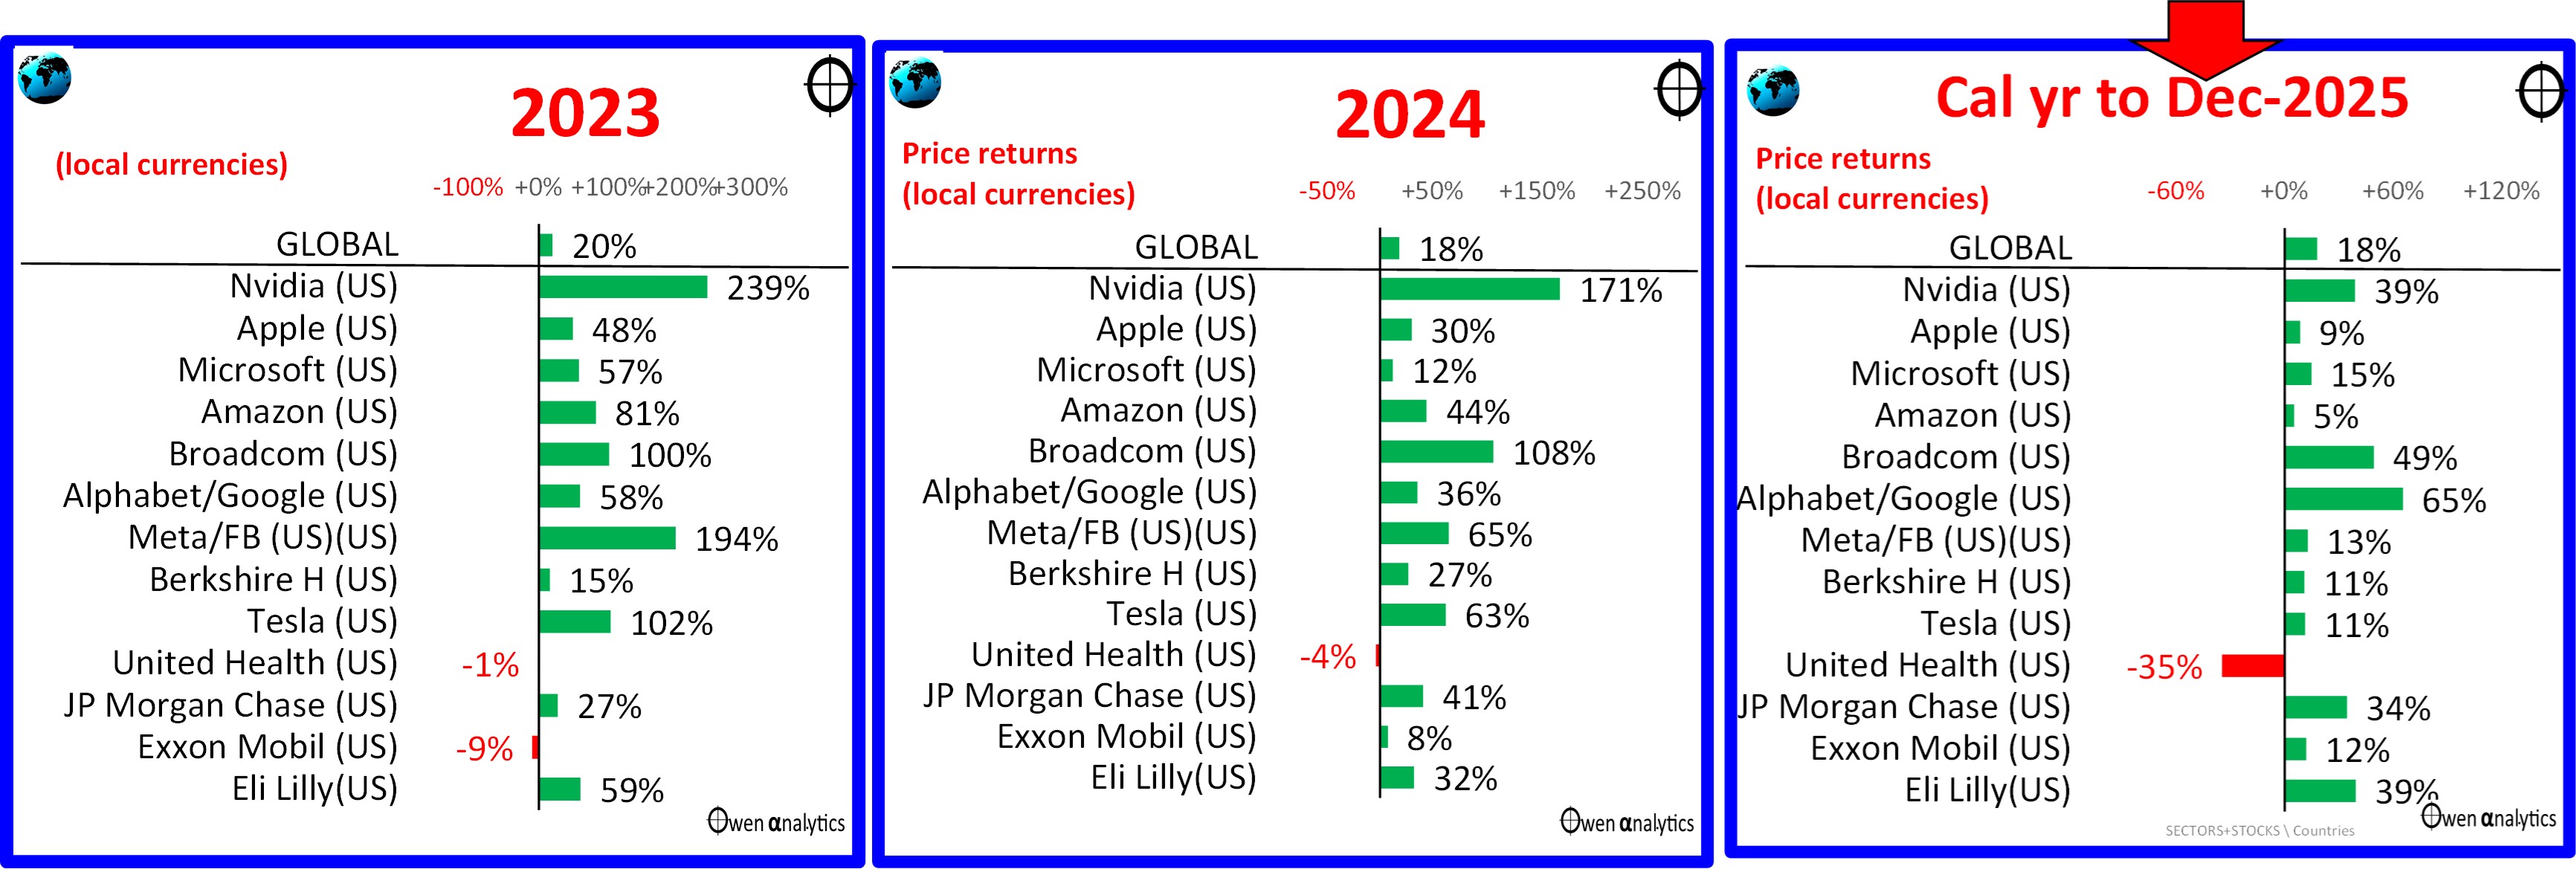
It was a sea of green once again for all of the major global stocks except United Health (a host of internal problems there). Probably the stand-out feature was chip-maker Nvidia soaring above $200 to become the first company in history to hit a US$5 trillion market value. It eased back a little by year-end, but still posted a 39% gain for the year.
Leading the pack are the (current) perceived winners from ‘ai’: Nvidia, Broadcom (ex-Hewlett Packard), Alphabet/Google, and Microsoft. Also up strongly again was Eli Lilly (US maker of copycat GLP-1 drugs), at the expense of Denmark’s industry pioneer Novo Nordisk (Ozempic, Wegovy).
Mag-7 update
For context, next are share price charts for the so-called ‘Magnificent Seven’ stocks over the past decade (plus I have added China’s Alibaba and Tencent):
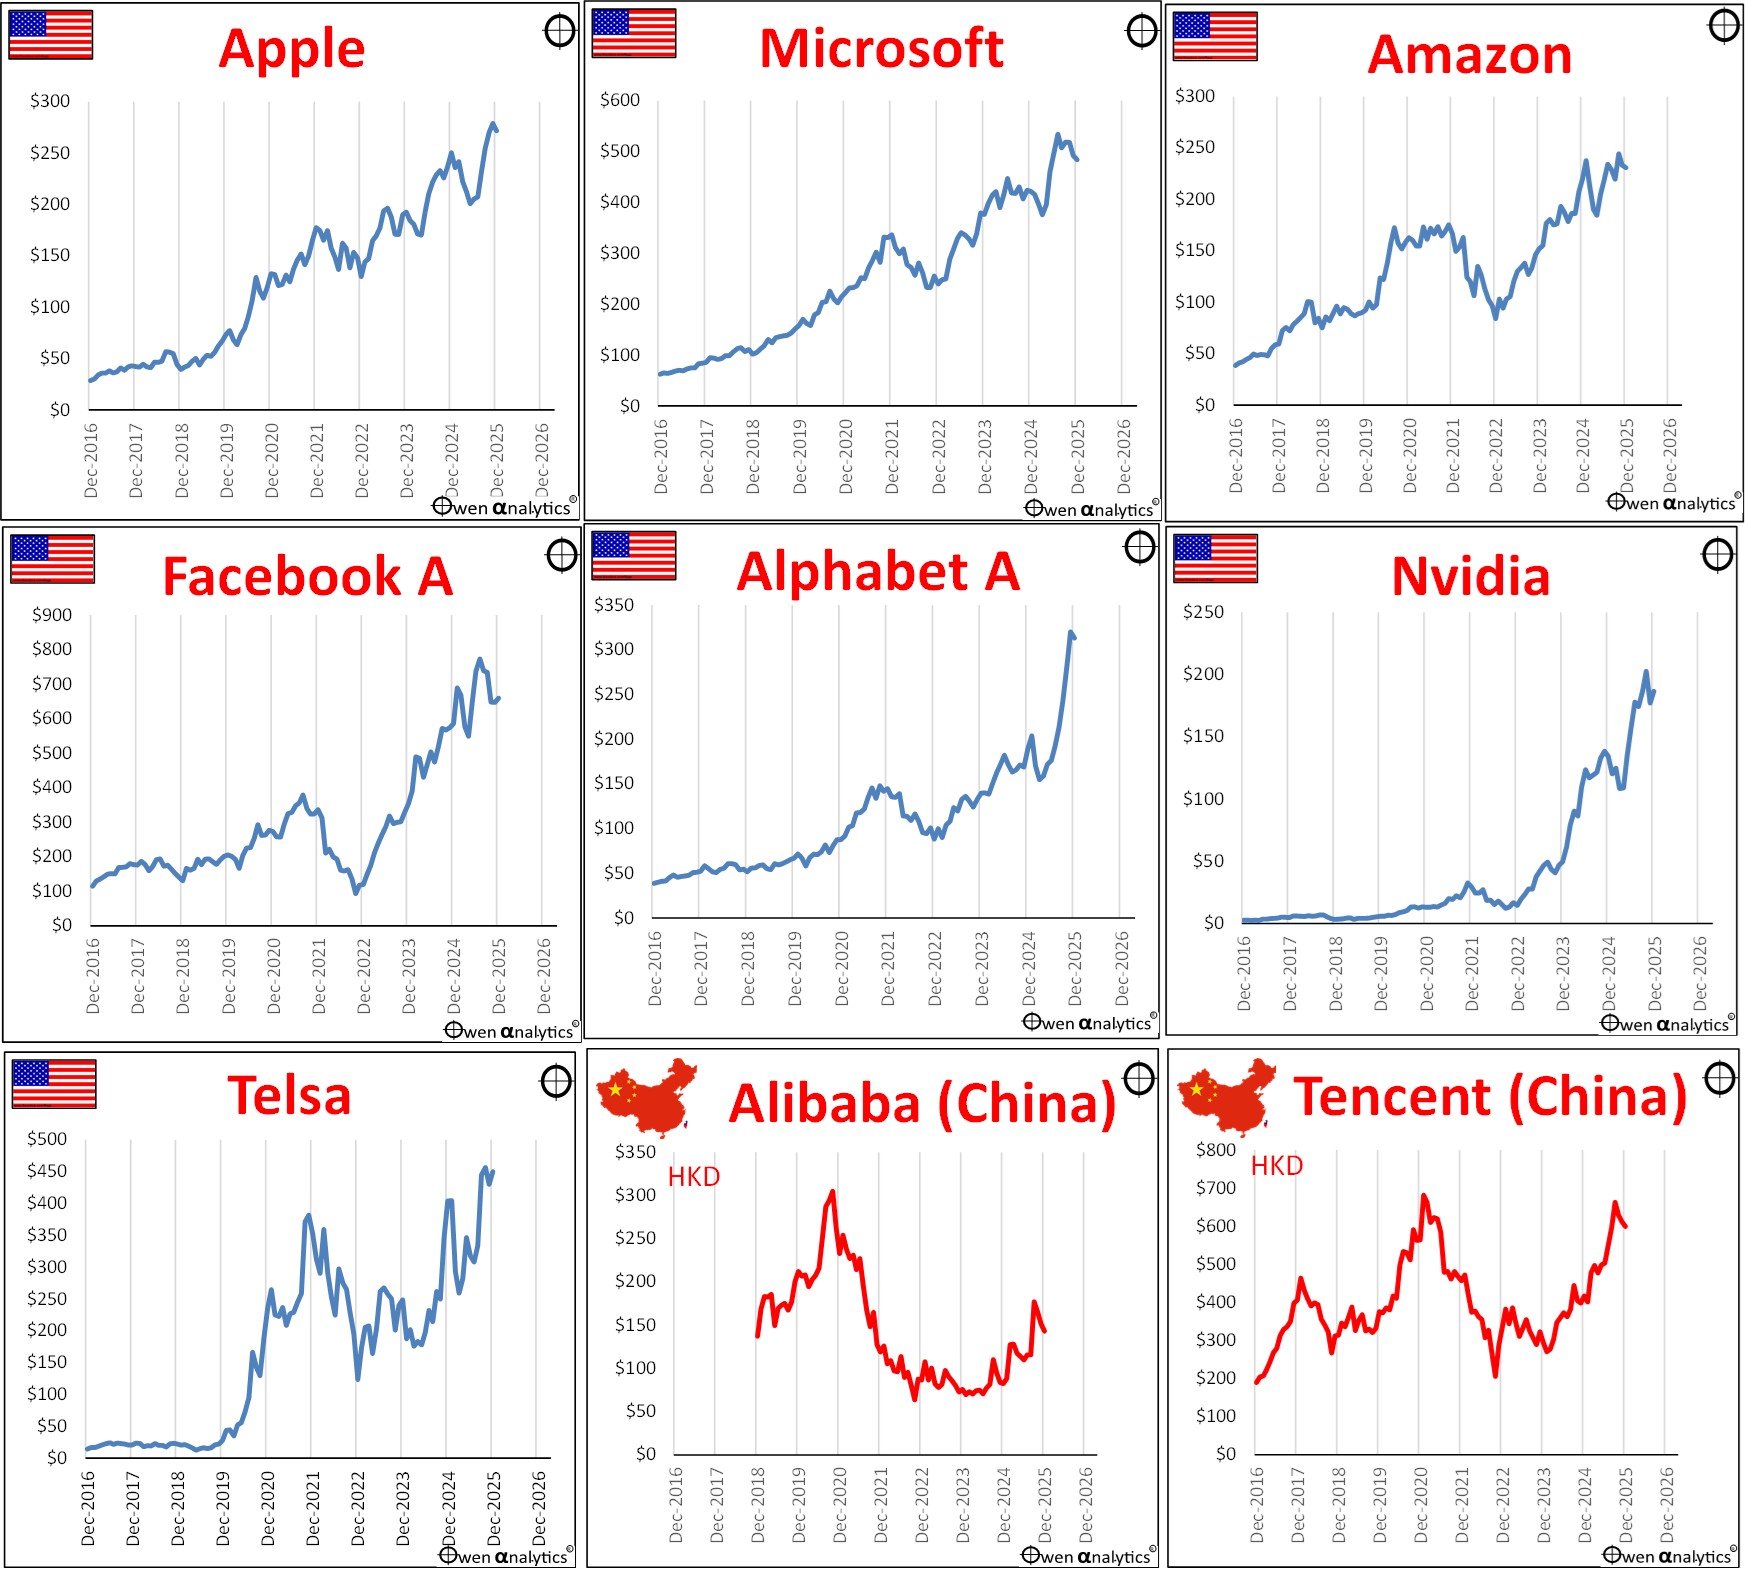
(For the benefit of new readers, I have not used any y-axis scale trickery here – the vertical y-axes all start at zero, and have regular, nominal scales, which highlights the explosive share price growth of the US giants from very low levels in the past decade.)
China’s Alibaba and Tencent are up in the Chinese rally this year, but both are still below their 2021 peaks. By comparison, all of the US majors are well above their previous peaks in the 2021 Covid stimulus boom, even struggling low-margin car-maker Tesla, finally.
The US tech giants are still very expensive on a range of metrics. See my recent report on how they stack up individually on revenues, profits, dividends, and pricing -
Profits and Pricing
The good gains in global share prices in 2025 were mostly underpinned by good growth in global corporate profits, so it was NOT a case of bubble-like pricing running well ahead of underlying profits, which would be one of the main warning flags for a bubble.
In US dollar terms, global share prices (S&P Global Benchmark index of 15,000 companies across 48 countries) rose +20%, but aggregate earnings per share from these companies rose +16%. Total $ profits from global listed companies rose from US$3.82 trillion in 2024 to an estimated $4.41 trillion in 2025.
Global share markets were certainly very expensive at the start of the 2025 year (eg trailing price/earnings ratio of 24.8) but there was only a minor increase in over-pricing to 25.7 by the end of the year, because earnings per share rose by nearly as much as share prices. This is a good sign.
Bottom line – we may be in a bubble, but the bubble did not inflate even further in 2025 because price growth was underpinned by profit growth.
Strong US profits underpin US share price growth
As the engine of global profits, US share prices rose by +16% in 2025, but it was underpinned almost entirely by a +15% increase in aggregate earnings per share. The trailing p/e ratio started the year at 29, which is extremely expensive, but it ended at the same p/e ratio because share prices rose at the same rate as profits over the year. This still leaves the market extremely expensive, but at least the level of over-pricing has not stretched further.
Whether profits can be maintained and keep growing at the same pace in future is another question of course, and I cover this from a number of angles in my six-part series on share market pricing and valuations – see below.
Profit outlooks
Consensus forecasts for the next couple of years for the US market are pencilling in a further +18% EPS growth again for calendar 2026. This would appear to be very ambitious to say the least as Trump’s tariffs have not really had a chance to eat into US consumer spending nor US company profits yet.
The problem is that S&P500 pricing is at a very bullish 29 times trailing (past 12 months) earnings, and 26 times next year’s ambitious earnings forecasts. These are very optimistic multiples on very optimistic earnings outlooks – a double layer of over-confidence, and highly vulnerable to any negative shocks from left field.
But so far, investors have shrugged off Trump’s tariff tantrums, Moody’s US credit downgrade, the US debt ceiling / government shut-down crisis, and ongoing wars in the Middle East and Ukraine. Are US company earnings and investor optimism invincible? Thus far, the TACO trade is holding up, especially with the prospect of further rate cuts under out-going Fed Chair Powells replacement in February 2026.
I recently published a six-part series on pricing of global share markets to better understand their implications -
For more on US profits and pricing – see:
Major country share markets
The US was actually relatively subdued in 2025, and many other markets did even better. Overall, it was a third straight year of good gains in all major markets:
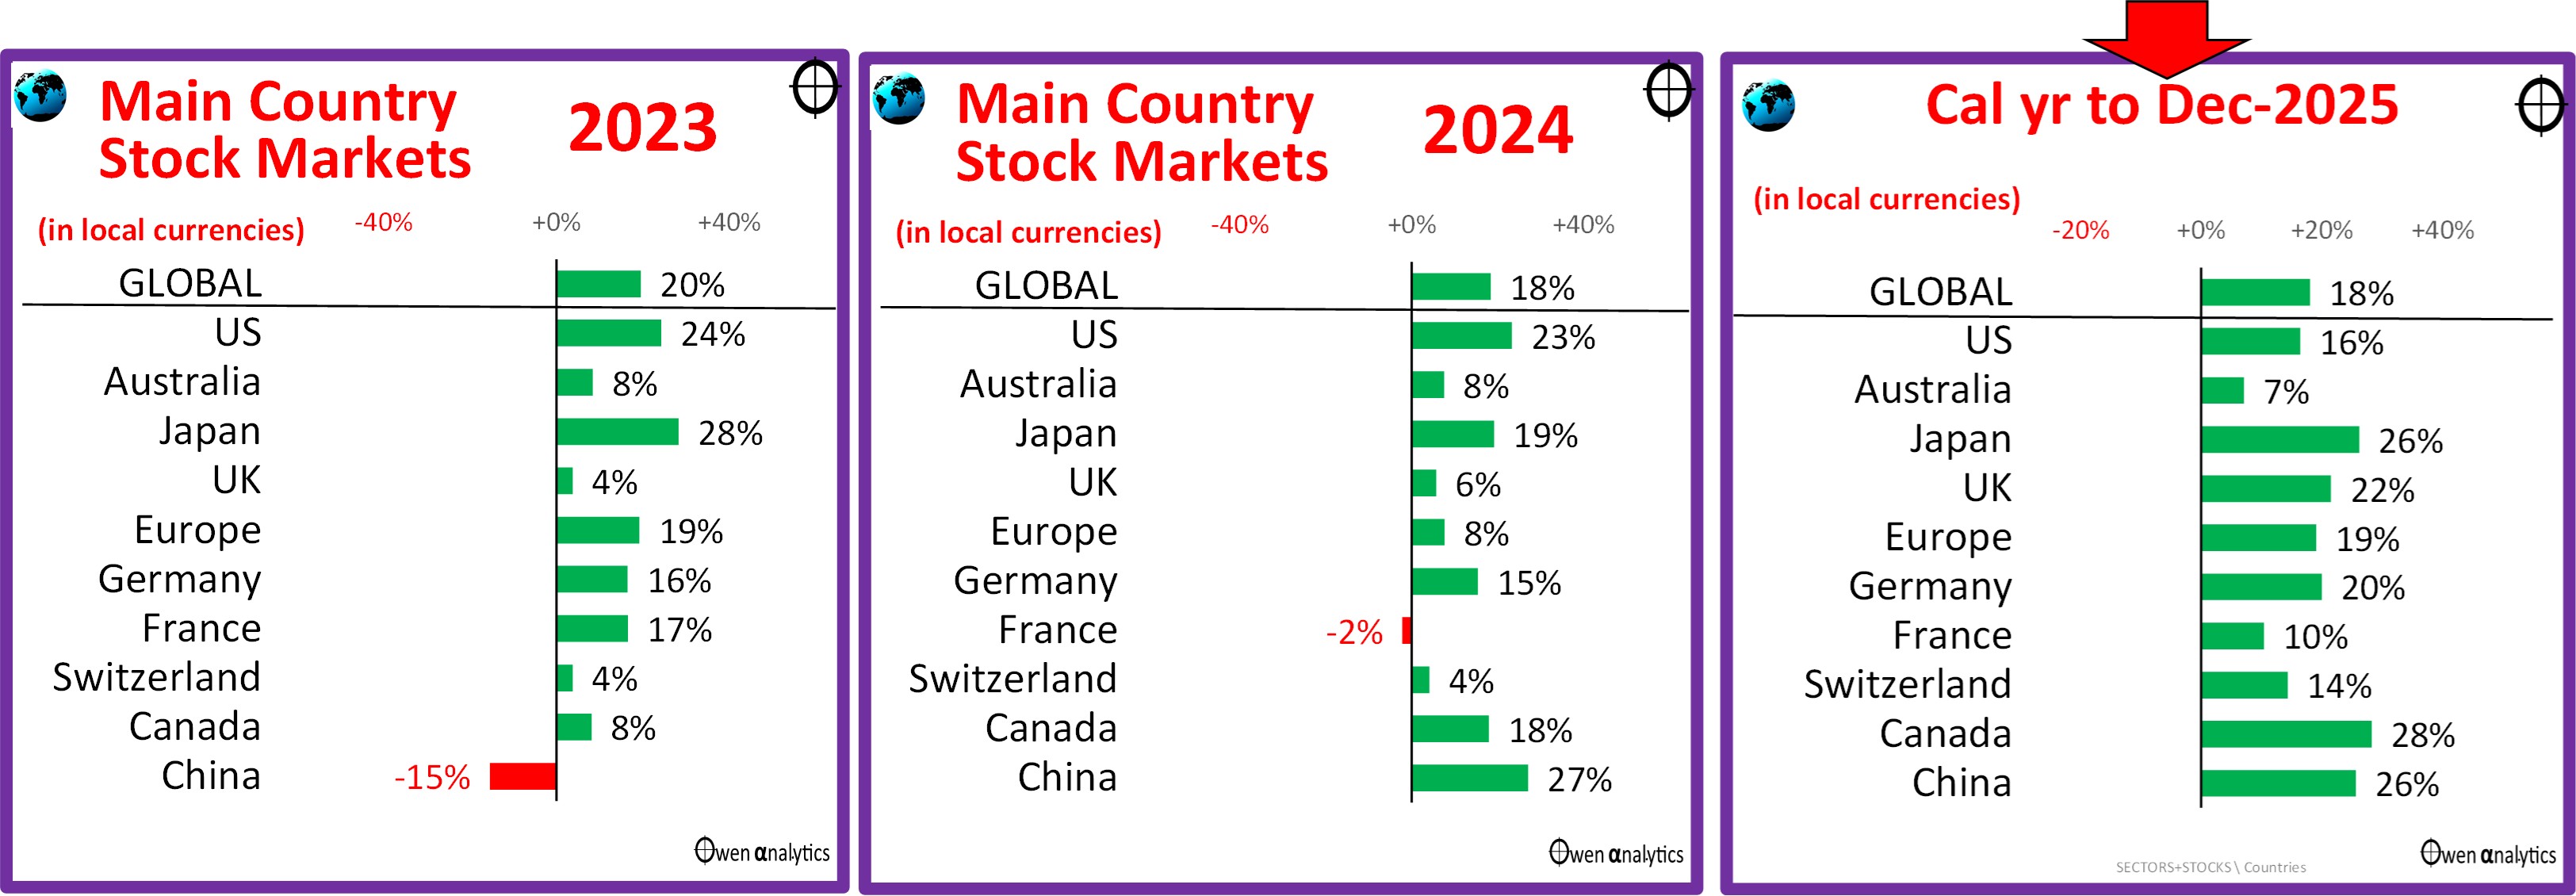
The notable exception here is Australia (see below), and also France (exporters hit by Trump’s tariffs and slowing sales of French luxury goods into China). At the other end of the scale, the best major markets were Japan (weaker yen), Canada (gold miners), and China (diversifying exports away from US).
Australian shares
The most obvious feature of the first two charts at the top of this report is the fact that the US market (red line in upper section of both charts) has more than doubled since the start of 2020 (pre-Covid), while the Australian share market (green line) is up by only one third over the same period. This reflects the relatively much poorer underlying fundamentals in Australia versus the US (profits, dividends, and returns on equity). I cover this aspect in some detail in my stories on share market pricing and valuations - refer to the links to the 6-part series above.
Here are the main ASX stocks in calendar 2025 (right chart) compared to the prior two years:
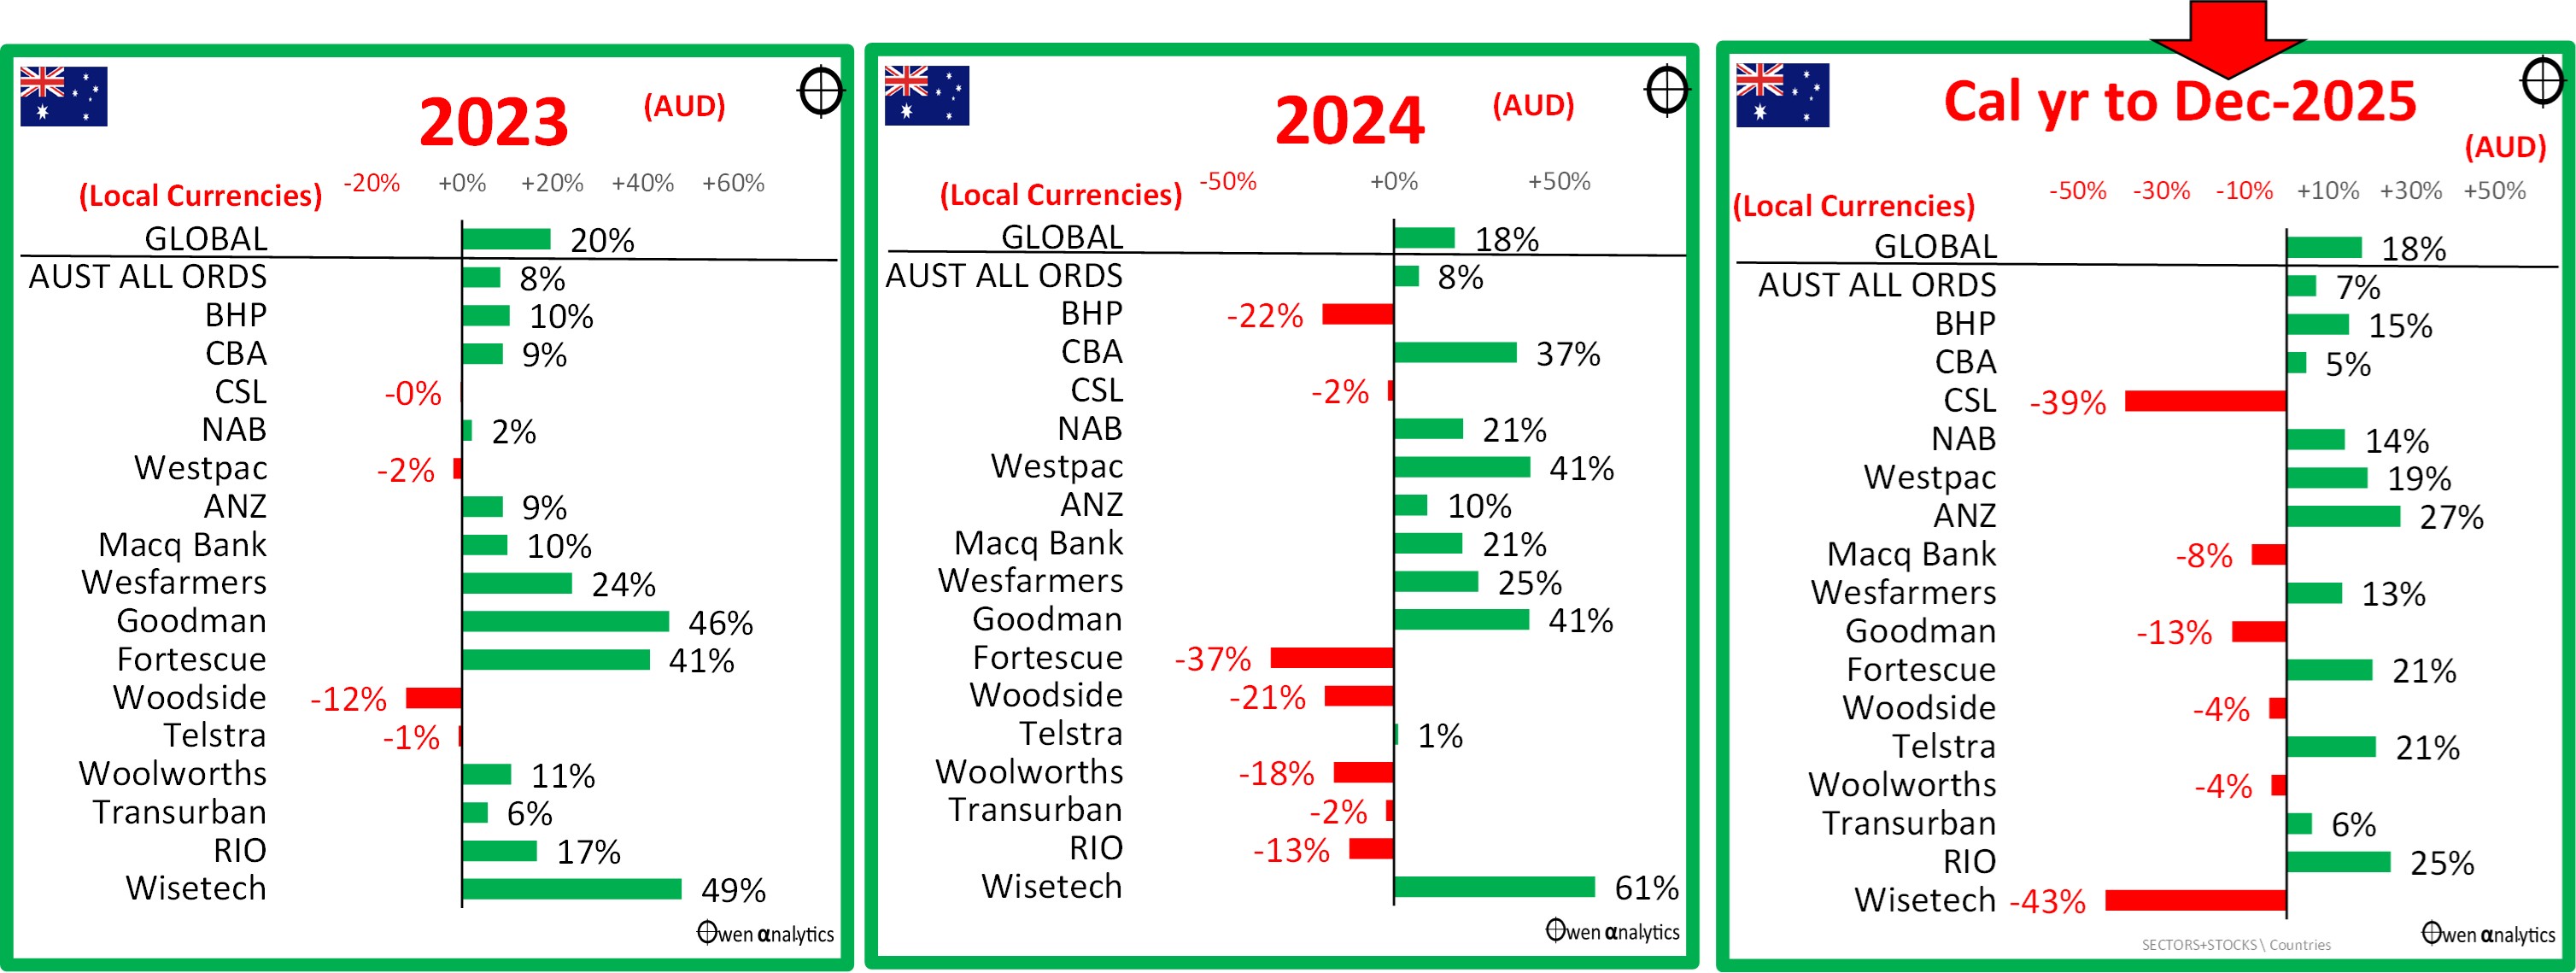
The first thing to highlight is the fact that the local ASX market has lagged the rest of the world in each of the past three years.
In 2025 the local market was lifted by the big iron ore miners (BHP, RIO, Fortescue), with iron ore prices rising 6% for the year despite flat-lined steel production in China and growing stockpiles.
Among the big banks, CBA managed to edge ahead into even more over-priced territory in 2025, but it lagged the rest of the big-4. Big bank profits and dividends have gone nowhere since the 2015 banking peak (and have fallen significantly in real terms after inflation), so there is no fundamental reason for their share price surges in recent years.
The best of the banks in 2025 was ANZ with new CEO Matos’s grand plan to revive the smallest and weakest of the big-4. As a decent-sized shareholder of ANZ (legacy shares from the early-mid-1990s), my assessment of the probably of success for Matos is approximately zero, but no harm in giving it a go.
Aside from the iron ore majors, most of the other miners were up virtually across the board, with rising commodities prices. Other winners were Tabcorp, A2Milk, Challenger, Charter Hall Retail.
The main drags on the local market were CSL, which sank to seven-year lows (with yet more problems adding to its pile of woes), and Wisetech (continuing battles between CEO/owners versus board/governance).
At the other end of the scale, almost all tech and healthcare stocks were down for the year, plus also Treasury Wines, Domino’s, Reece, Hardie. Most of these were either own-goals, overseas woes, or overseas own-goals.
Inflation & interest rates
First, to the US market because the US drives all global markets including the ASX. The Fed has cut rates six times since the post-Covid recession surge – three cuts in late 2024, and three more in late 2025. Here is the US picture:
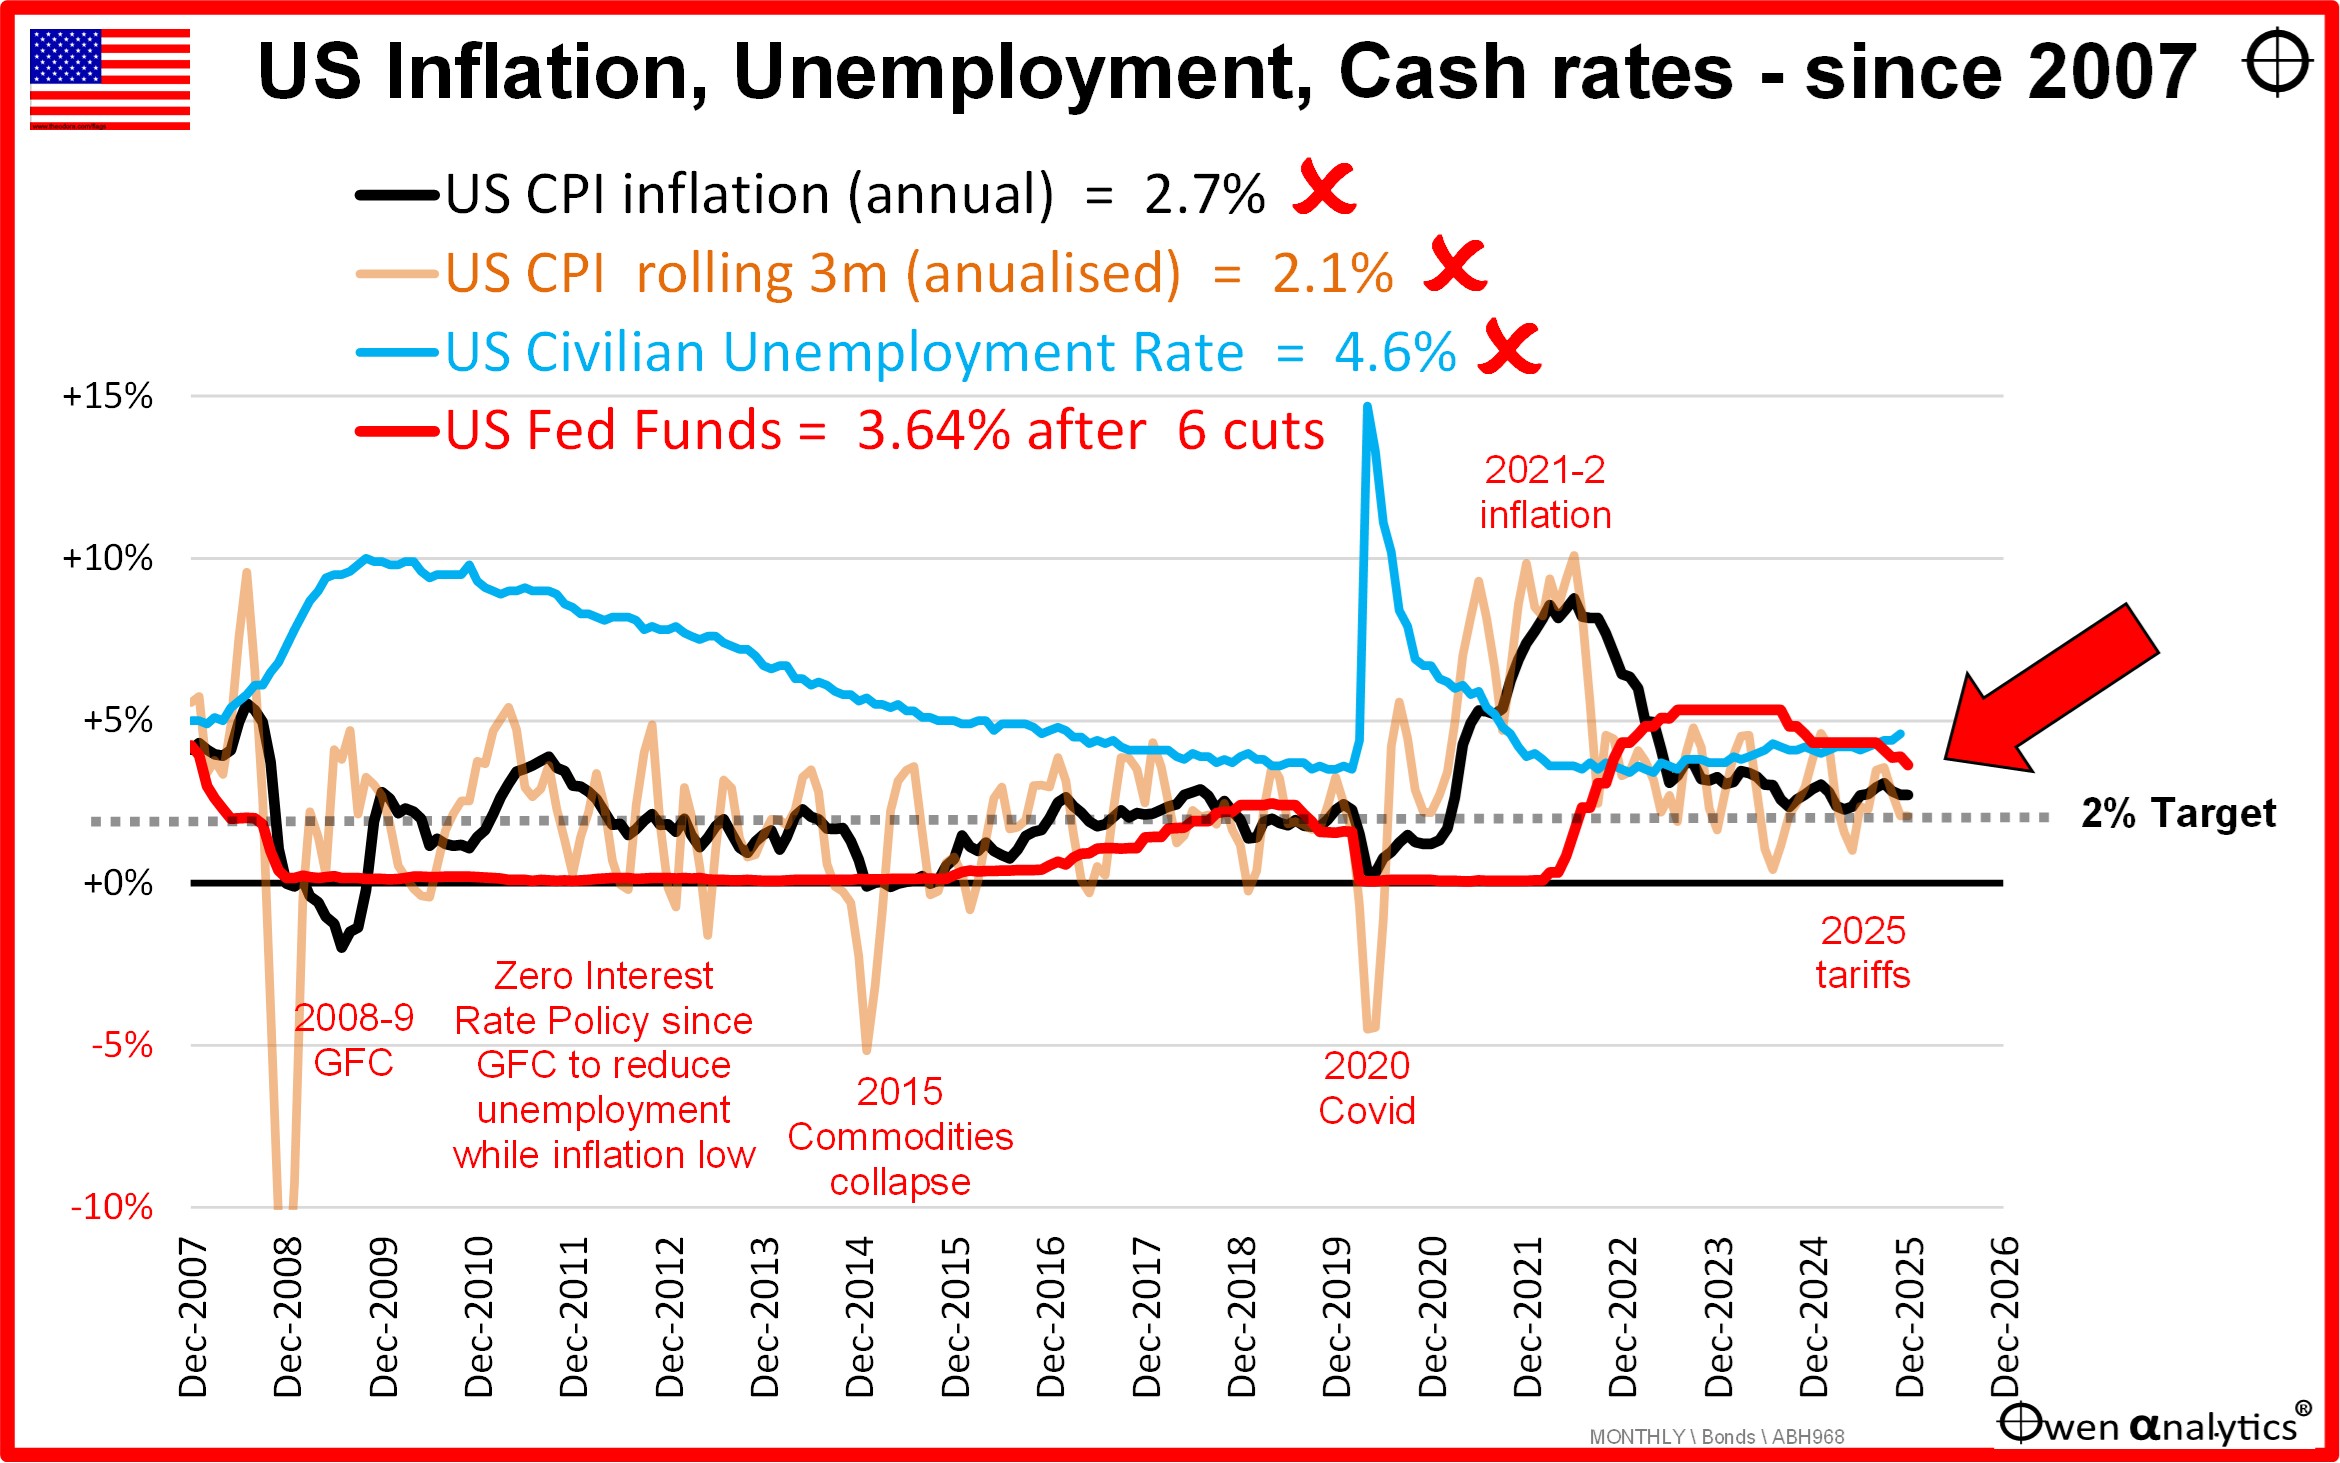
I give the Fed 3 crosses out of 3 for inflation control.
The 12-month inflation rate (black line) is still a rather high 2.7%, including some elements of tariff impacts. The annualised 3-month rate (orange line) is running at 2.1%. The Fed’s preferred measure of inflation, Personal Consumption Expenditure (PCE) is also too high at 2.7%.
The US jobs market remains surprisingly strong. The unemployment rate has risen to 4.6% (up from a low of 3.4% in early 2023), but it is still relatively tight. Thus far we have seen little impact of Trump’s tariffs and mass deportations on trade, prices, inflation, or jobs. But it is still early days yet.
Despite inflation still running above target, unemployment still at inflationary levels, and a never-ending deficit spending spree by the US government, the Fed still kept cutting cash rates! No fundamental reason to cut rates as they did, just enormous political pressure.
When Powell’s term expires in February 2026, he will be replaced by a Trump stooge with clear instructions (or expectations) to cut rates at the short end, and also ramp up ‘QE’ bond-buying to depress rates at the long end. The prospect of lower short and long term interest rates is probably the main factor holding up confidence in the current tech/ai boom.
Australian inflation, interest rates, unemployment
The RBA gets 2 crosses out of 3 for inflation control. Inflation is still above target, the jobs market is still strong (inflationary), and governments (State and Federal) are addicted to mad deficit-spending sprees.
Inflation in Australias also remains problematic, but for different reasons than the US. The RBA has only three rate cuts in this cycle (Feb, May, August 2025), while most other countries have made several more cuts as inflation has edged down. (For example, there have been 8 rate cuts in Europe, 9 in Canada, 9 in NZ, 6 in UK, 6 in the US).
The problem was that the RBA raised cash rates later, slower, and lower than the rest of the world, leaving inflation stickier here. Plus we have our unique centralised wage fixing system, and cozy monopoly/oligopoly structures in most domestic industries, which means they can just pass on price increases, with little competitive pressure on margins and profits.
Here is the Australian picture:
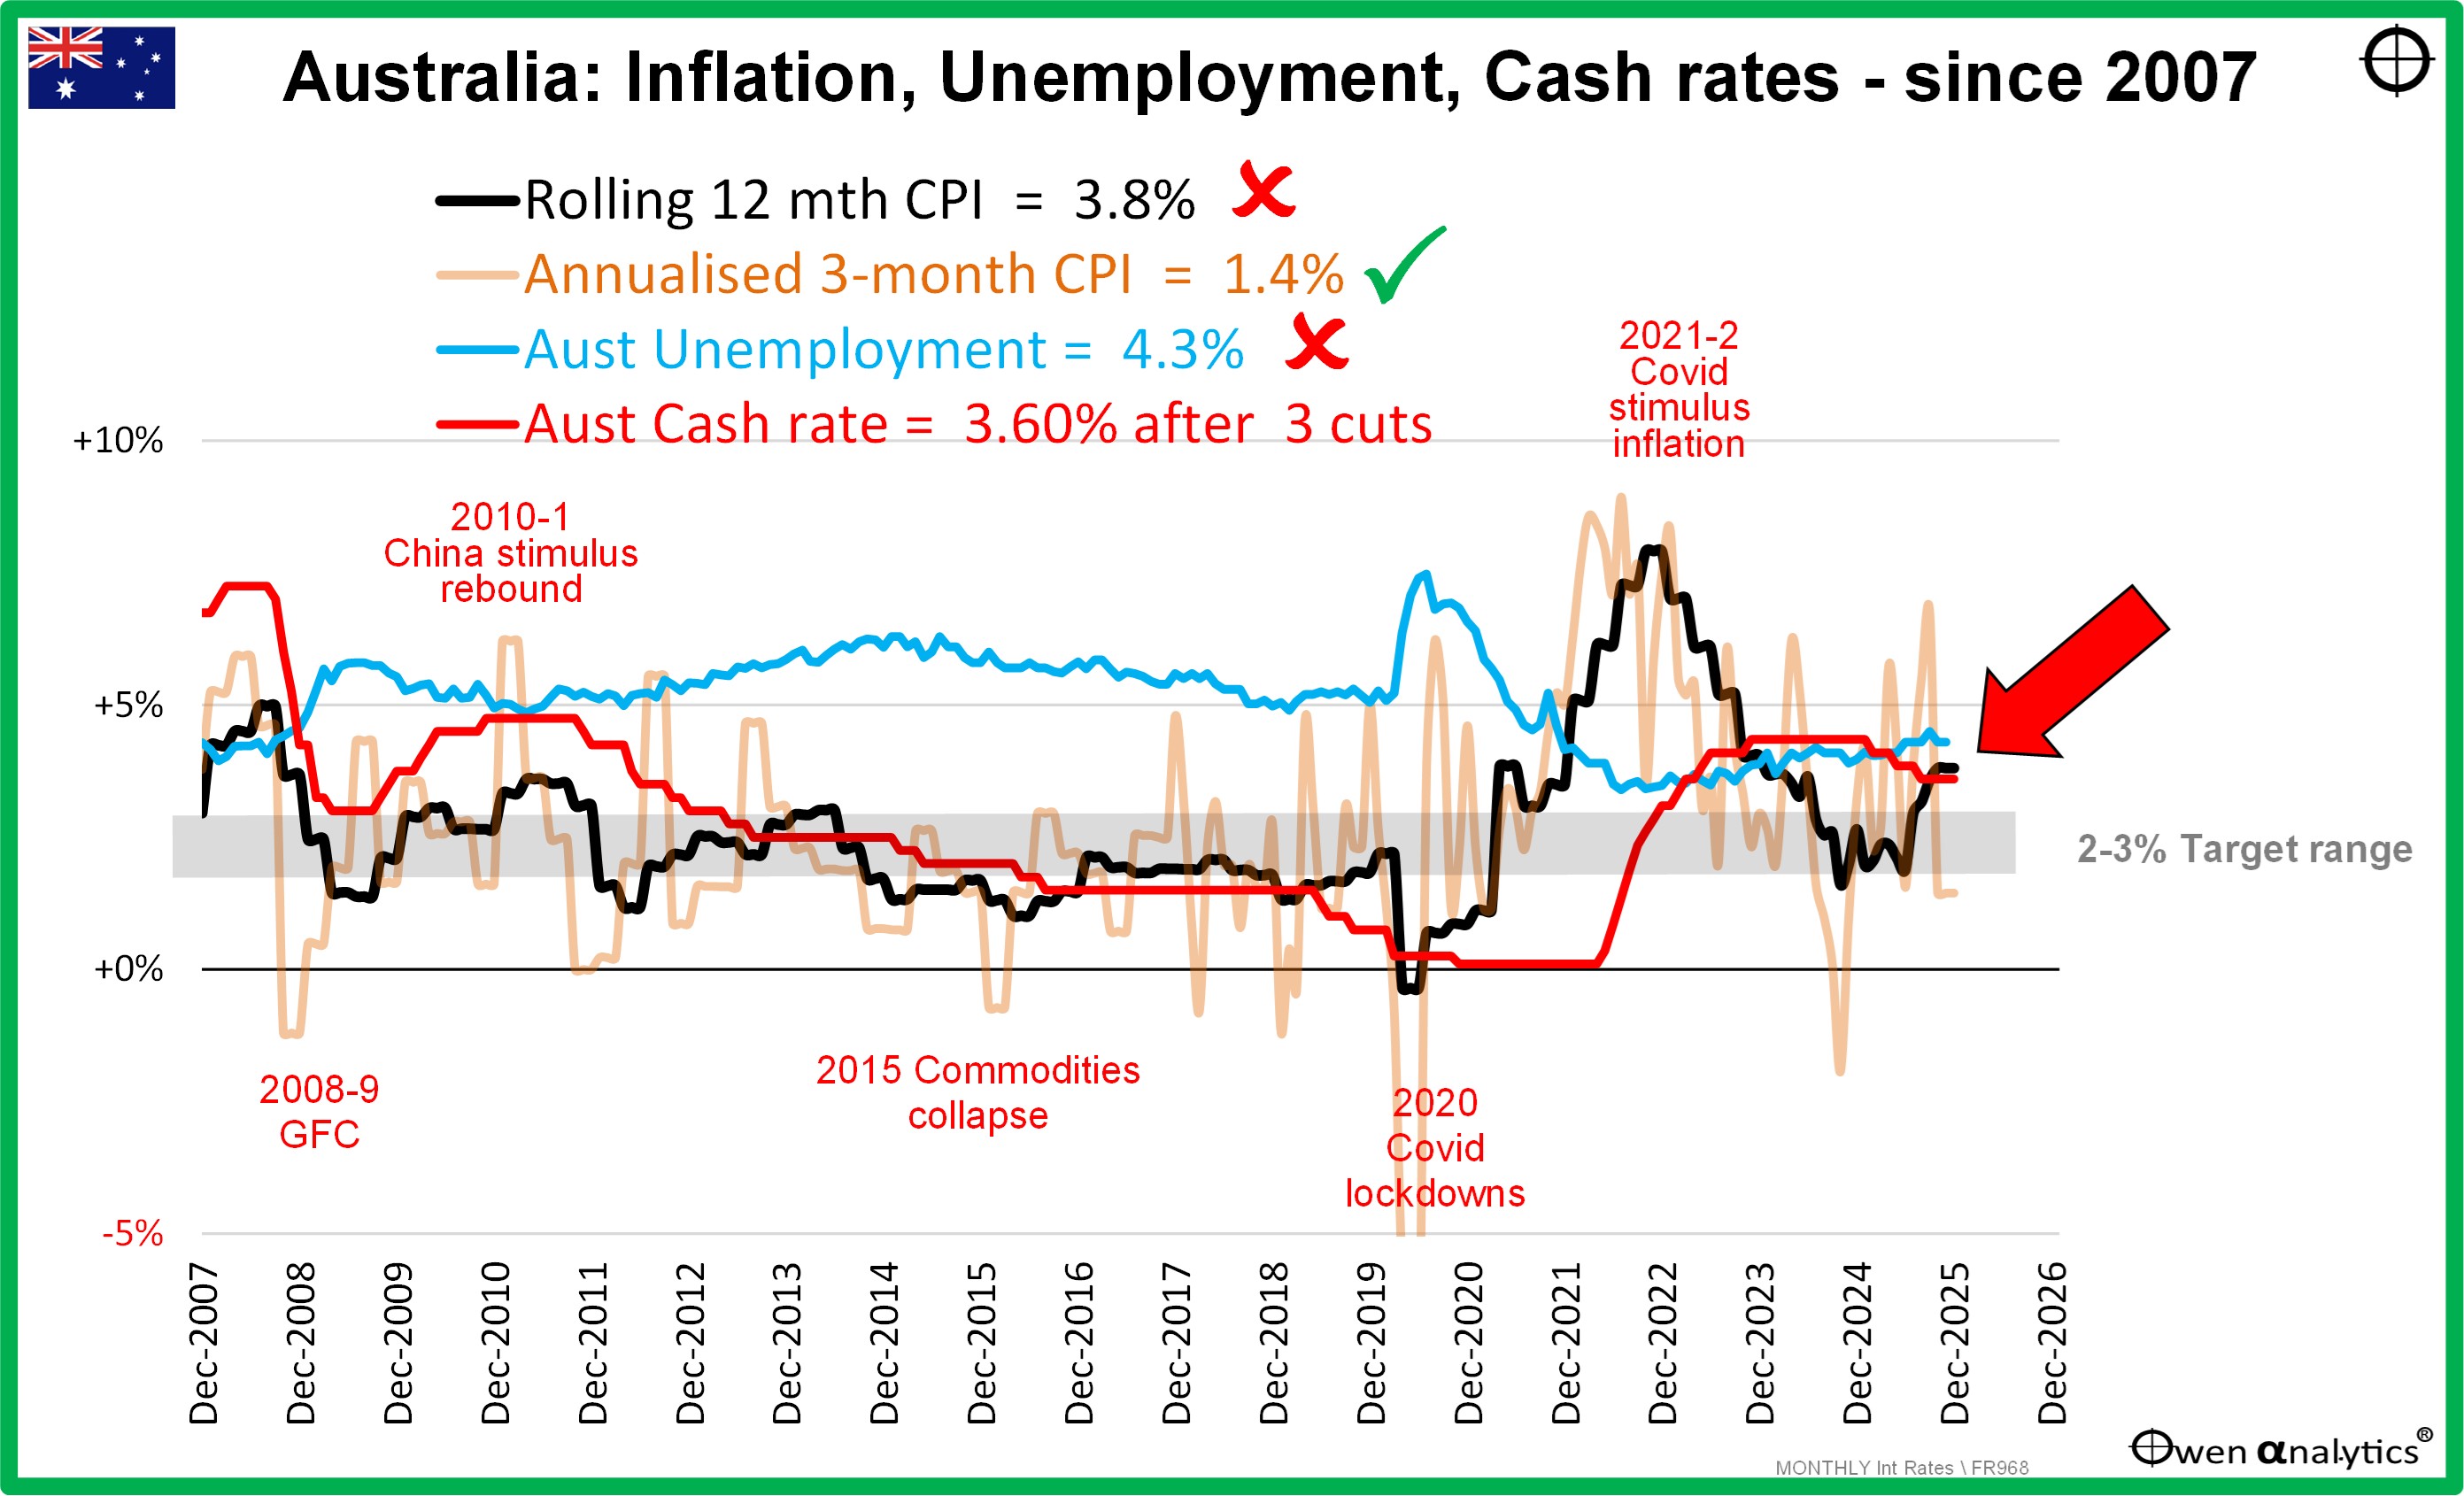
The 12-month CPI inflation rate is still rather high at 3.8% and heading in the wrong direction. The annualised 3-month rate is back down to 1.4% due mainly to the timing of energy subsidies. The main problem areas are housing rents, electricity, gas, healthcare, tobacco, and education costs. The RBA’s preferred ‘trimmed mean’ measure is back up to 3.0%.
As in the case of the US, the most obvious motivation for a further series of rate cuts would be a local recession, which would lift unemployment and probably soften inflation pressures, allowing (or necessitating) rate cuts.
Unemployment in Australia has been rising slowly but steadily over the past year, from a low of 3.4% in late 2022, and is now 4.3%. This is still below the level RBA regards as a neutral rate – ie no longer inflationary (RBA’s non-accelerating inflation rate of unemployment (‘NAIRU’) of around 4.5%)
‘Participation rates’ (the number of people in the workforce as a percentage of working age population) are still near record highs, due almost entirely due to expansionary government-related hiring. The government sector has been expanding, but the real economy is doing it tough, with rate hikes eating into top-line revenues and raising financing costs.
Bottom line = no fundamental pressure or reason to cut rates – with inflation still high and unemployment still relatively low, and governments still running inflationary deficits.
For my assessment of the impact of wages on inflation -
Bond yields and bond markets
The picture on inflation and interest rates leads us directly to bond markets. Bond yields rose in all markets in 2025 except the US where they fell (and UK were flat).
The main chart below show yields on 10-year treasuries in major global markets since 2025:
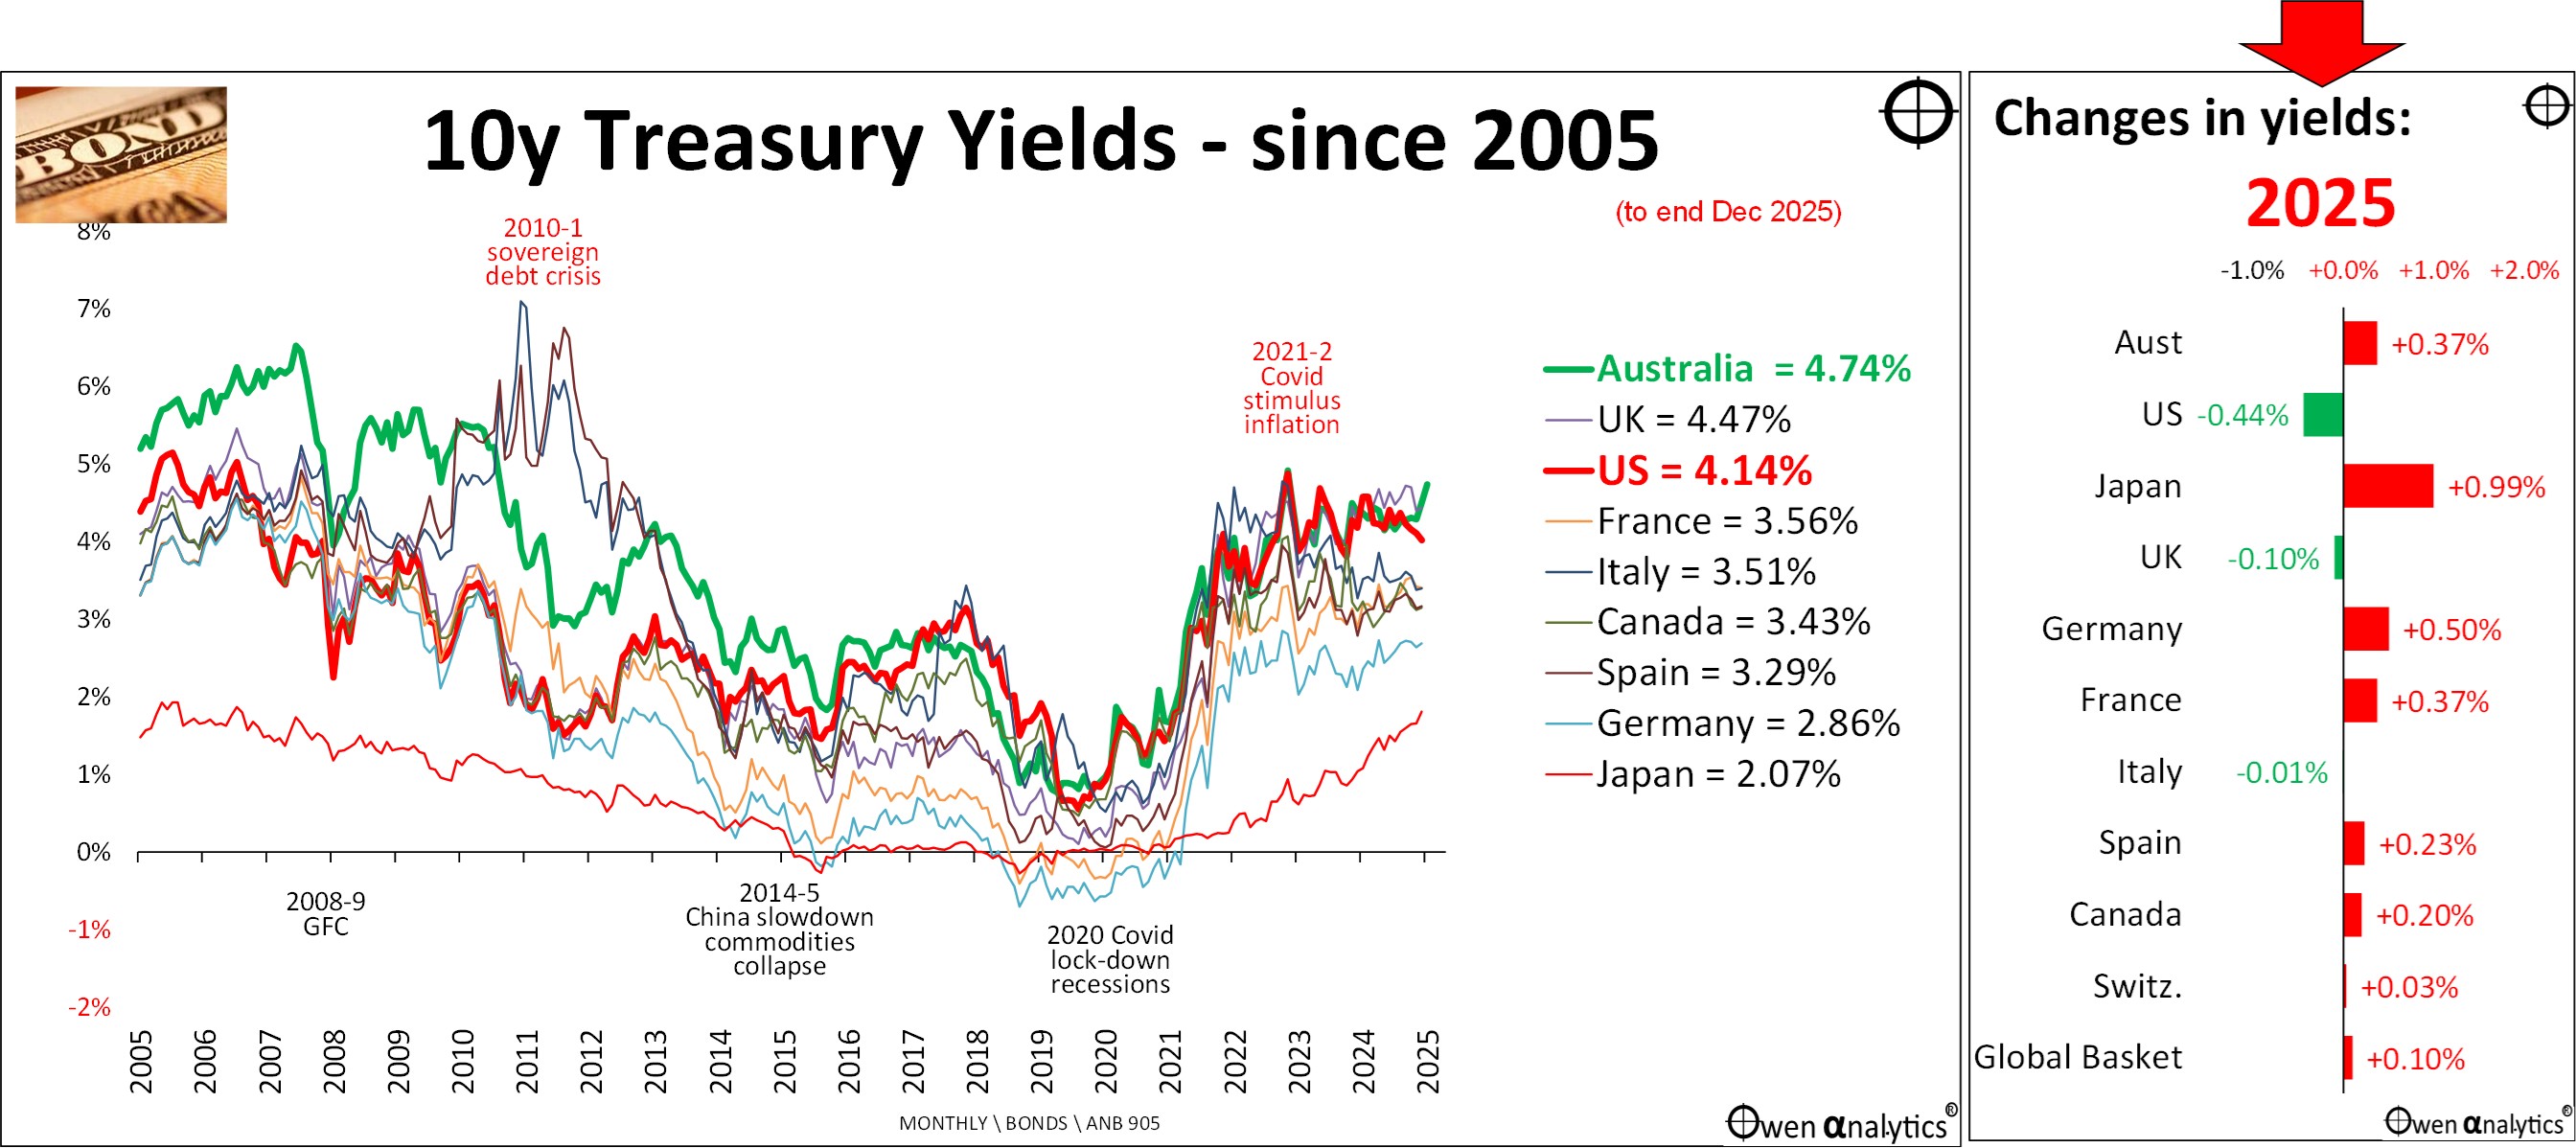
This chart highlights the great decline in yields after the GFC and into the Covid lockdown recession, and then the rapid rise in yields with the return of inflation in the mad Covid stimulus regime of ultra-loose monetary policy (zero/negative cash rate rates, and bond-buying to artificially depress yields at the long end), plus ultra-loose fiscal policies (governments running up massive deficits and debts, throwing ‘free’ money at anything and everything).
To the right of the main chart are changes in treasury yields in calendar 2025.
(In my charts of changes in bond yields, I show rising yields in red as they mean lower bond prices & returns; and I show falling yields in green as they mean rising bond prices & returns.)
Bond market returns
Thanks to rising yields in Australia and most global markets, 2025 turned out to be the fourth straight year of poor nominal and real returns from bonds. Investment grade Australian Composite bonds returned 3.2% for the year, Government returned 2.5%, Corporate 4.3%, inflation-linked bonds just 2.1%.
Global bonds did a little better. AUD Hedged global bonds returned 3.2% for Government bonds, 4.9% for Global Aggregate bonds, and nearly 6% for corporate/semi-gov.
Despite below average returns on bonds in 2025, at least it was a better year for bonds than 2024 when yields rose by significantly more. Not nearly as bad as 2022, which was the worst year for US bonds in more than a century, and the worst year for Australian bonds since the 1931 Commonwealth debt default/restructure.
Fortunately I have been out of fixed rate bonds in portfolios (advised and my own) since 2021, due to fears that yields will remain elevated for at least the next few years, due to persistent inflation, with loose fiscal policy (governments running deficits and debts), and also loose monetary policy (central banks under enormous political pressure to keep rates too low).
Also we have other inflationary pressures – including rising military spending everywhere, on-shoring of manufacturing, wage pressures from labour shortages resulting from reduced immigration, transitions to renewable energy sources, and increased supplies of bonds from profligate, populist, big spending governments.
Exchange Rates
In 2025 the Aussie dollar rose +7.7% against the US dollar and also against most other currencies (except the stronger Euro). It is the usual pattern for the AUD to rise in general global booms as it is seen by global investors as a ‘risk’ asset and a proxy for global growth and commodities prices, which were positive in 2025.
Conversely, the US dollar fell back in 2025 (especially against the strong Euro). Just as it is the usual pattern for the Aussie dollar to rise in global booms and fall in global sell-offs, it is the usual pattern for the US dollar to decline general booms as bullish US investors sell US dollars to buy non-US assets in booms. It was not just Trump talking down the dollar (which is a much smarter strategy than raising tariffs), it was just the usual boom/bust pattern for the US dollar. However the US dollar still rose against the weaker Yen in 2025 (inflation concerns with the new Japanese government).
For the big picture on the strong US dollar and why Trump is trying to talk it down – see:
Commodities
Commodities were a mixed bag in calendar 2025. The main chart below shows commodities prices from a common base of 100 at the start of 2020. (The main purpose of this chart is to illustrate the massive bubbles and busts in several commodities, caused by supply & demand shocks).
The lower section shows US inflation as commodities prices are major inputs into inflation numbers.
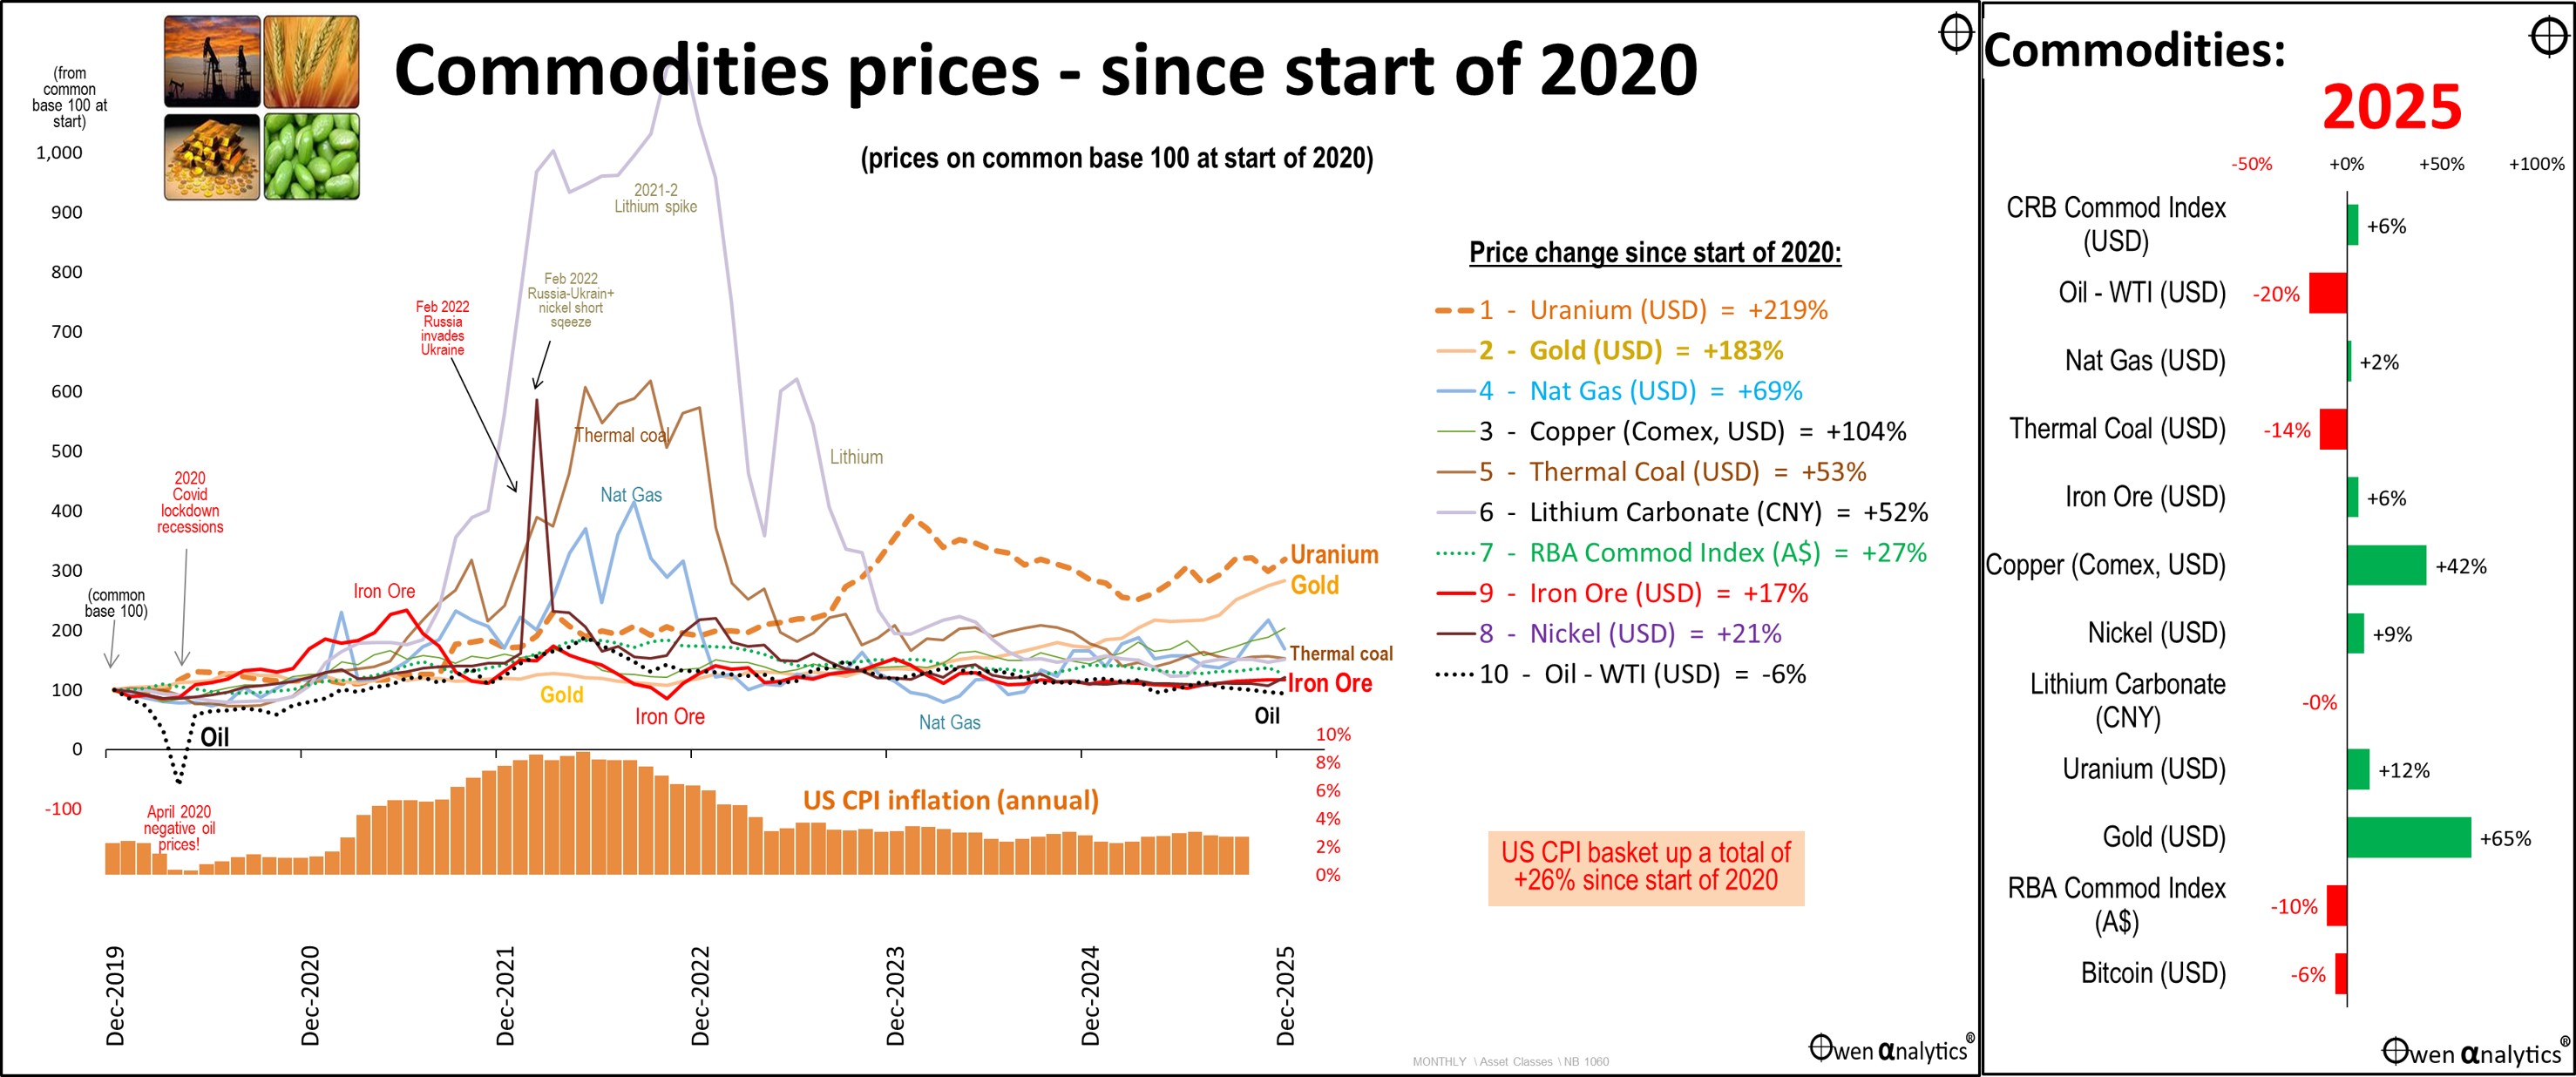
To the right are the changes in prices in calendar 2025.
The winners for the year were gold, silver, copper, uranium, nickel. By far the most important factor for overall ASX share market returns (and Commonwealth/WA government tax revenues) is iron ore, which managed a small gain despite slow steel production in China, growing stockpiles, and new supplies from RIO’s giant new Simandou mine in Guinea.
The stand-out on the chart is gold, up a further +65% in 2025 (in US dollar terms). The recent surge in interest and buying of gold has been driven by fist-full of festering fears – including inflation, political unrest, military tensions, and general distrust in traditional financial institutions. (Gold has been the best performer in my own long-term ’10-4 All-weather ETF portfolio’).
Bitcoin down
I would have thought that Bitcoin should also benefit from those same fears driving up the gold price, and it also should have benefited from the global tech/ai rally, but it fell back -6% in 2025.
While I have always liked the underlying principles behind Bitcoin (a utopian world completely beyond the reach of governments, taxes, banks, intermediaries, regulators, pryinig eyes, creditors, etc), it is still too volatile and speculative for serious long-term investment portfolios. However, blockchain and stable-coins probably do have some useful potential roles in the financial system architecture.
That’s about it for my quick summary of markets in 2025. For my recent webinar wrap-up of the winners and losers for 2025, see –
Look out for my next story on returns from asset classes & diversified portfolios, and also my story on outlooks, risks, and opportunities for 2026.
##### Apologies in advance if I am a little slow in the next few months. I am going in for cancer surgery next week, and then possibly chemo, depending on what they cut out and what they miss. If recovery is successful, I plan on making some changes to the direction and focus of my research and publications.
‘Till next time – safe investing and have a safe and prosperous New Year!