The US share market hit new record highs at the end of March 2024, but has suffered a mini-mini-‘correction’ in April with a fall of -5%.
- · Is this ‘correction’ enough?
- · Is the market still expensive?
- · Is this the start of the next big correction?
The answers are ‘No’, ‘Yes’, and ‘Probably not yet’.
A ‘fall’ of 5% is nothing. It’s not even a hiccup. Only a fall of around -50% (like the 2001-2 ‘tech wreck’, or the 2008-9 ‘GFC’) would bring the US share market back to ‘fair value’ on this measure.
Today’s chart is an update on the ‘Cyclically Adjusted Price/Earnings ratio’ (‘CAPE’). For many decades, this has probably been the most widely used measure of fundamental pricing/valuation of share markets, and the most reliable predictor of future long-term returns.
In my last update on this measure on 6 October 2023, I reported that the CAPE ratio for the US share market was ‘flashing orange’ at a rather high level of 29.4.
See: US market - ‘Shiller/CAPE’ ratio update: It’s flashing orange. . . but what action should we take? (6 Oct 2023)
(That report also includes a brief background on the CAPE ratio and how it is constructed and used.)
My conclusion in October last year was that, although this measure is a very reliable predictor of long-term future returns (next 10 years), it provides no guidance on the short-term outlook, and that the market may well have some more upside in the short term. The US market did indeed keep rallying to new highs for the next six months.
Where are we now?
The rally to the end of March this year took the US CAPE ratio an even higher level of 35. This is now in extreme territory – nearly twice the historical average CAPE ratio of 16 for the US market.
Even with the 5% fall in the first three weeks of April, this only brings the CAPE down by -5% to a still extreme 33.
The current CAPE ratio is forecasting very low average total returns (barely above zero) over the next 10 years from the current level.
Here are my updated charts as at the end of March 2024:
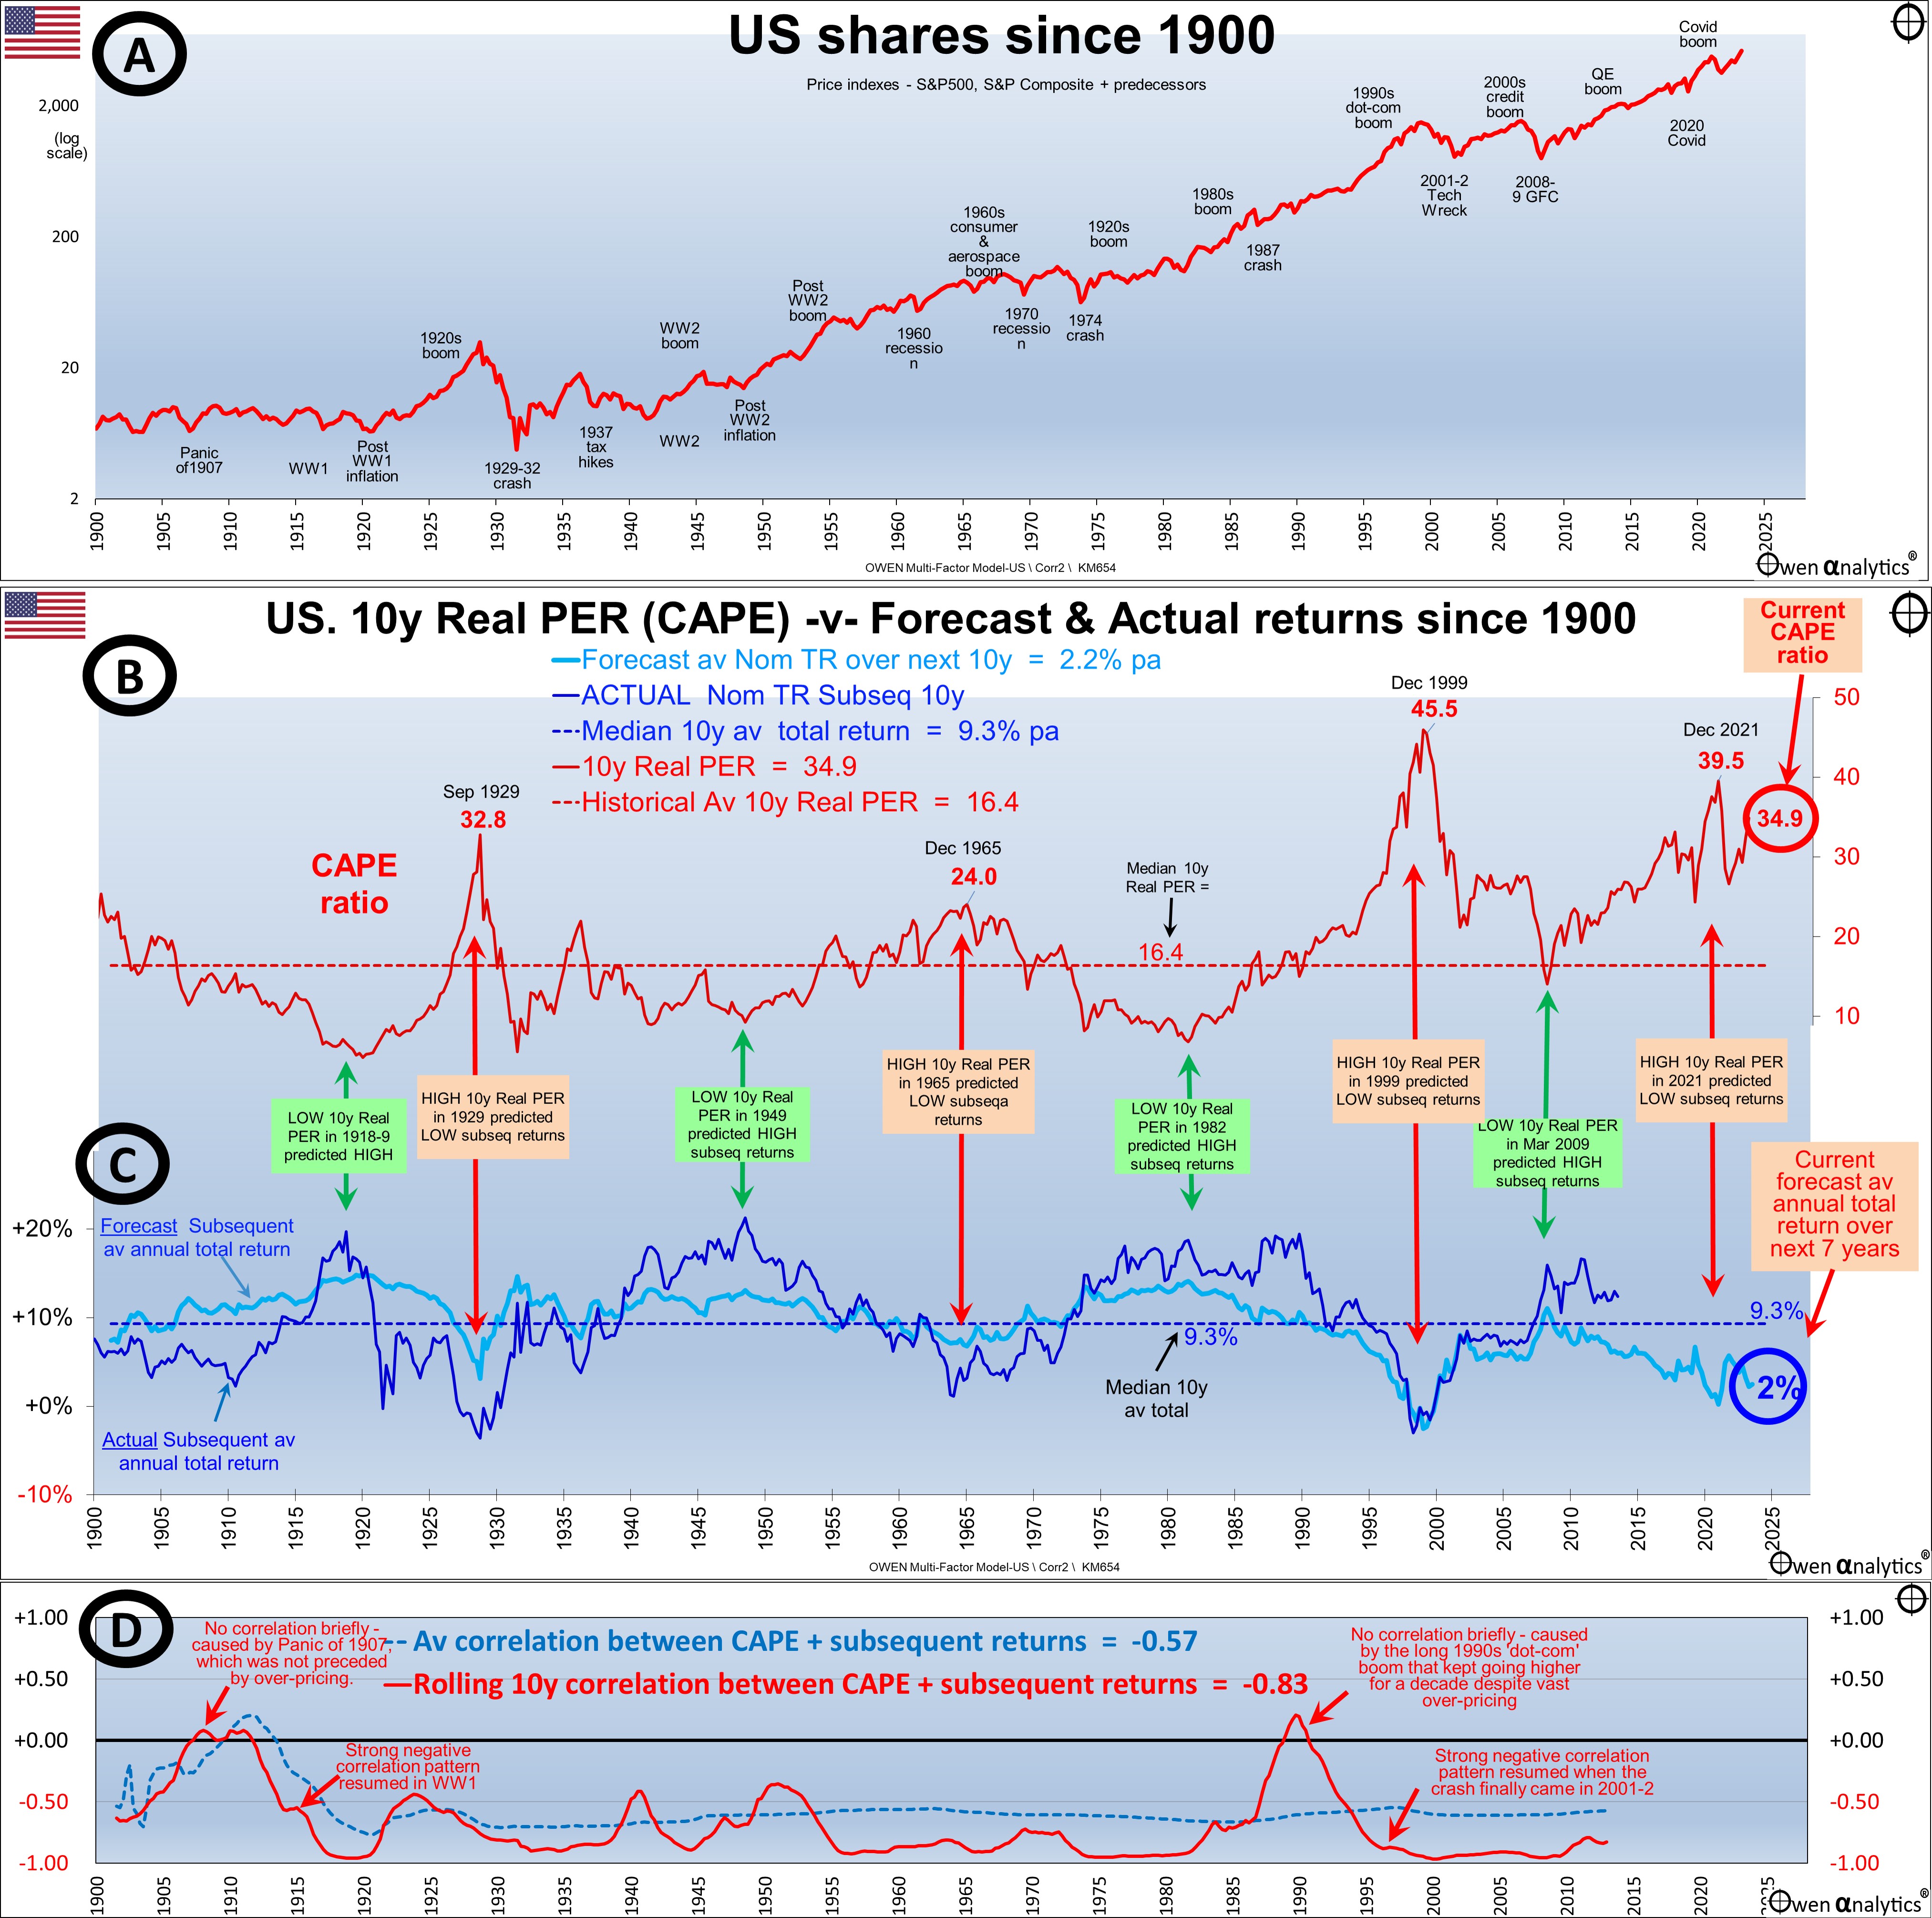
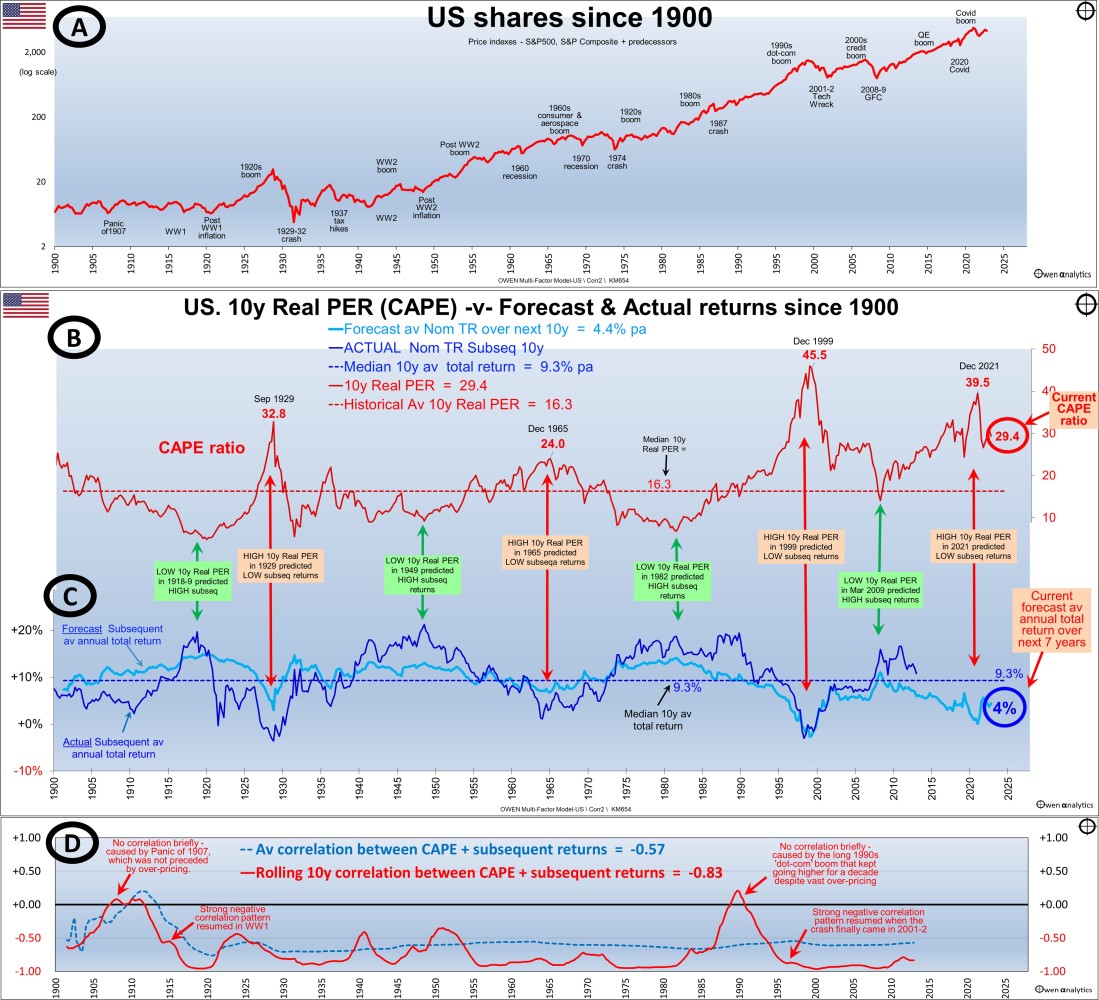
Section A shows the broad US share market price index since 1900 (based on S&P and Cowles).
Section B shows my version of the CAPE ratio from the end of each calendar quarter – showing the peaks at the tops of booms prior to the busts. The current ratio for the US market is 35. This is nearly twice the long-term historical average of 16 for the US.
Section C shows the forecast 10-year average annualised return from each point in time (black line), and the actual subsequent 10-year average annualised return from each point (light blue line). These two lines track each other quite closely. They are both either above the line together (ie above average forecast returns and above average actual subsequent returns) or they are both below the line together (below average forecast returns and below average actual subsequent return).
To the very right of section C - the current forecast average annualised returns from using the CAPE model is just 2% pa, which is very poor, due to current very high CAPE ratio.
Note that all statistical regression models run the risk of creating a false sense of accuracy. All that we can really say is that it is highly likely that the subsequent returns from this point are going to be well below average.
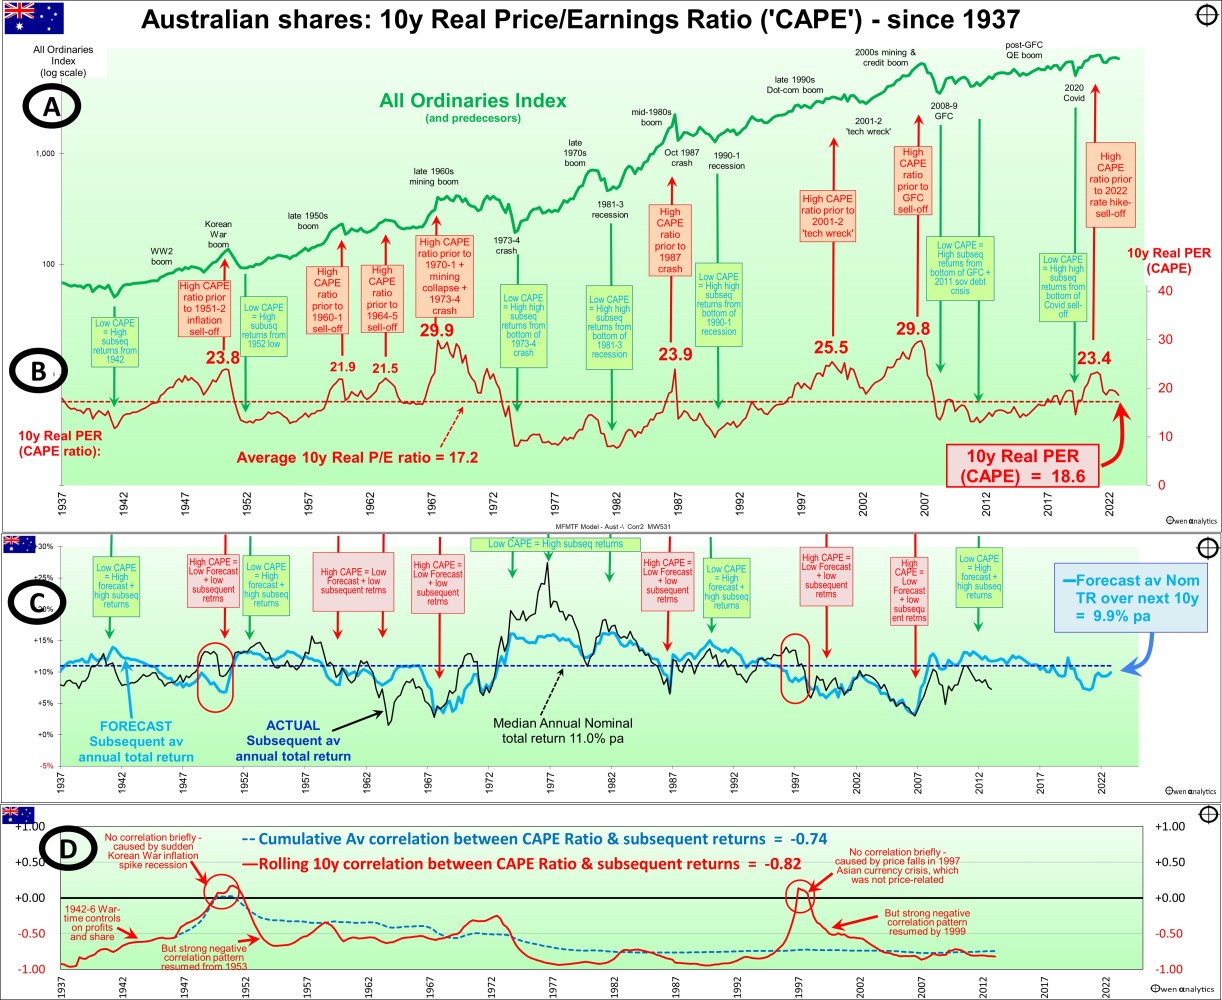
(In contrast the Australian CAPE is not nearly as bearish) – see:
Section D on our main chart shows the rolling 10-year correlation between the CAPE ratio and subsequent returns (red) and the cumulative average correlation (blue dots). The correlations are strongly negative almost all of the time – ie low ratios are followed by above average returns, high ratios are followed by below average returns.
There are only two exceptional periods when the strong negative correlation were not present – in the ‘Panic of 1907’, and at the start of the 1990s boom. Both of these were errors of timing only, and in both cases the usual strong negative correlation returned just one year later.
Here is a plot diagram showing the close correlation between the CAPE ratio at the end of each quarter (horizontal axis) and subsequent 10-year average annualised returns from the US share market from each point:
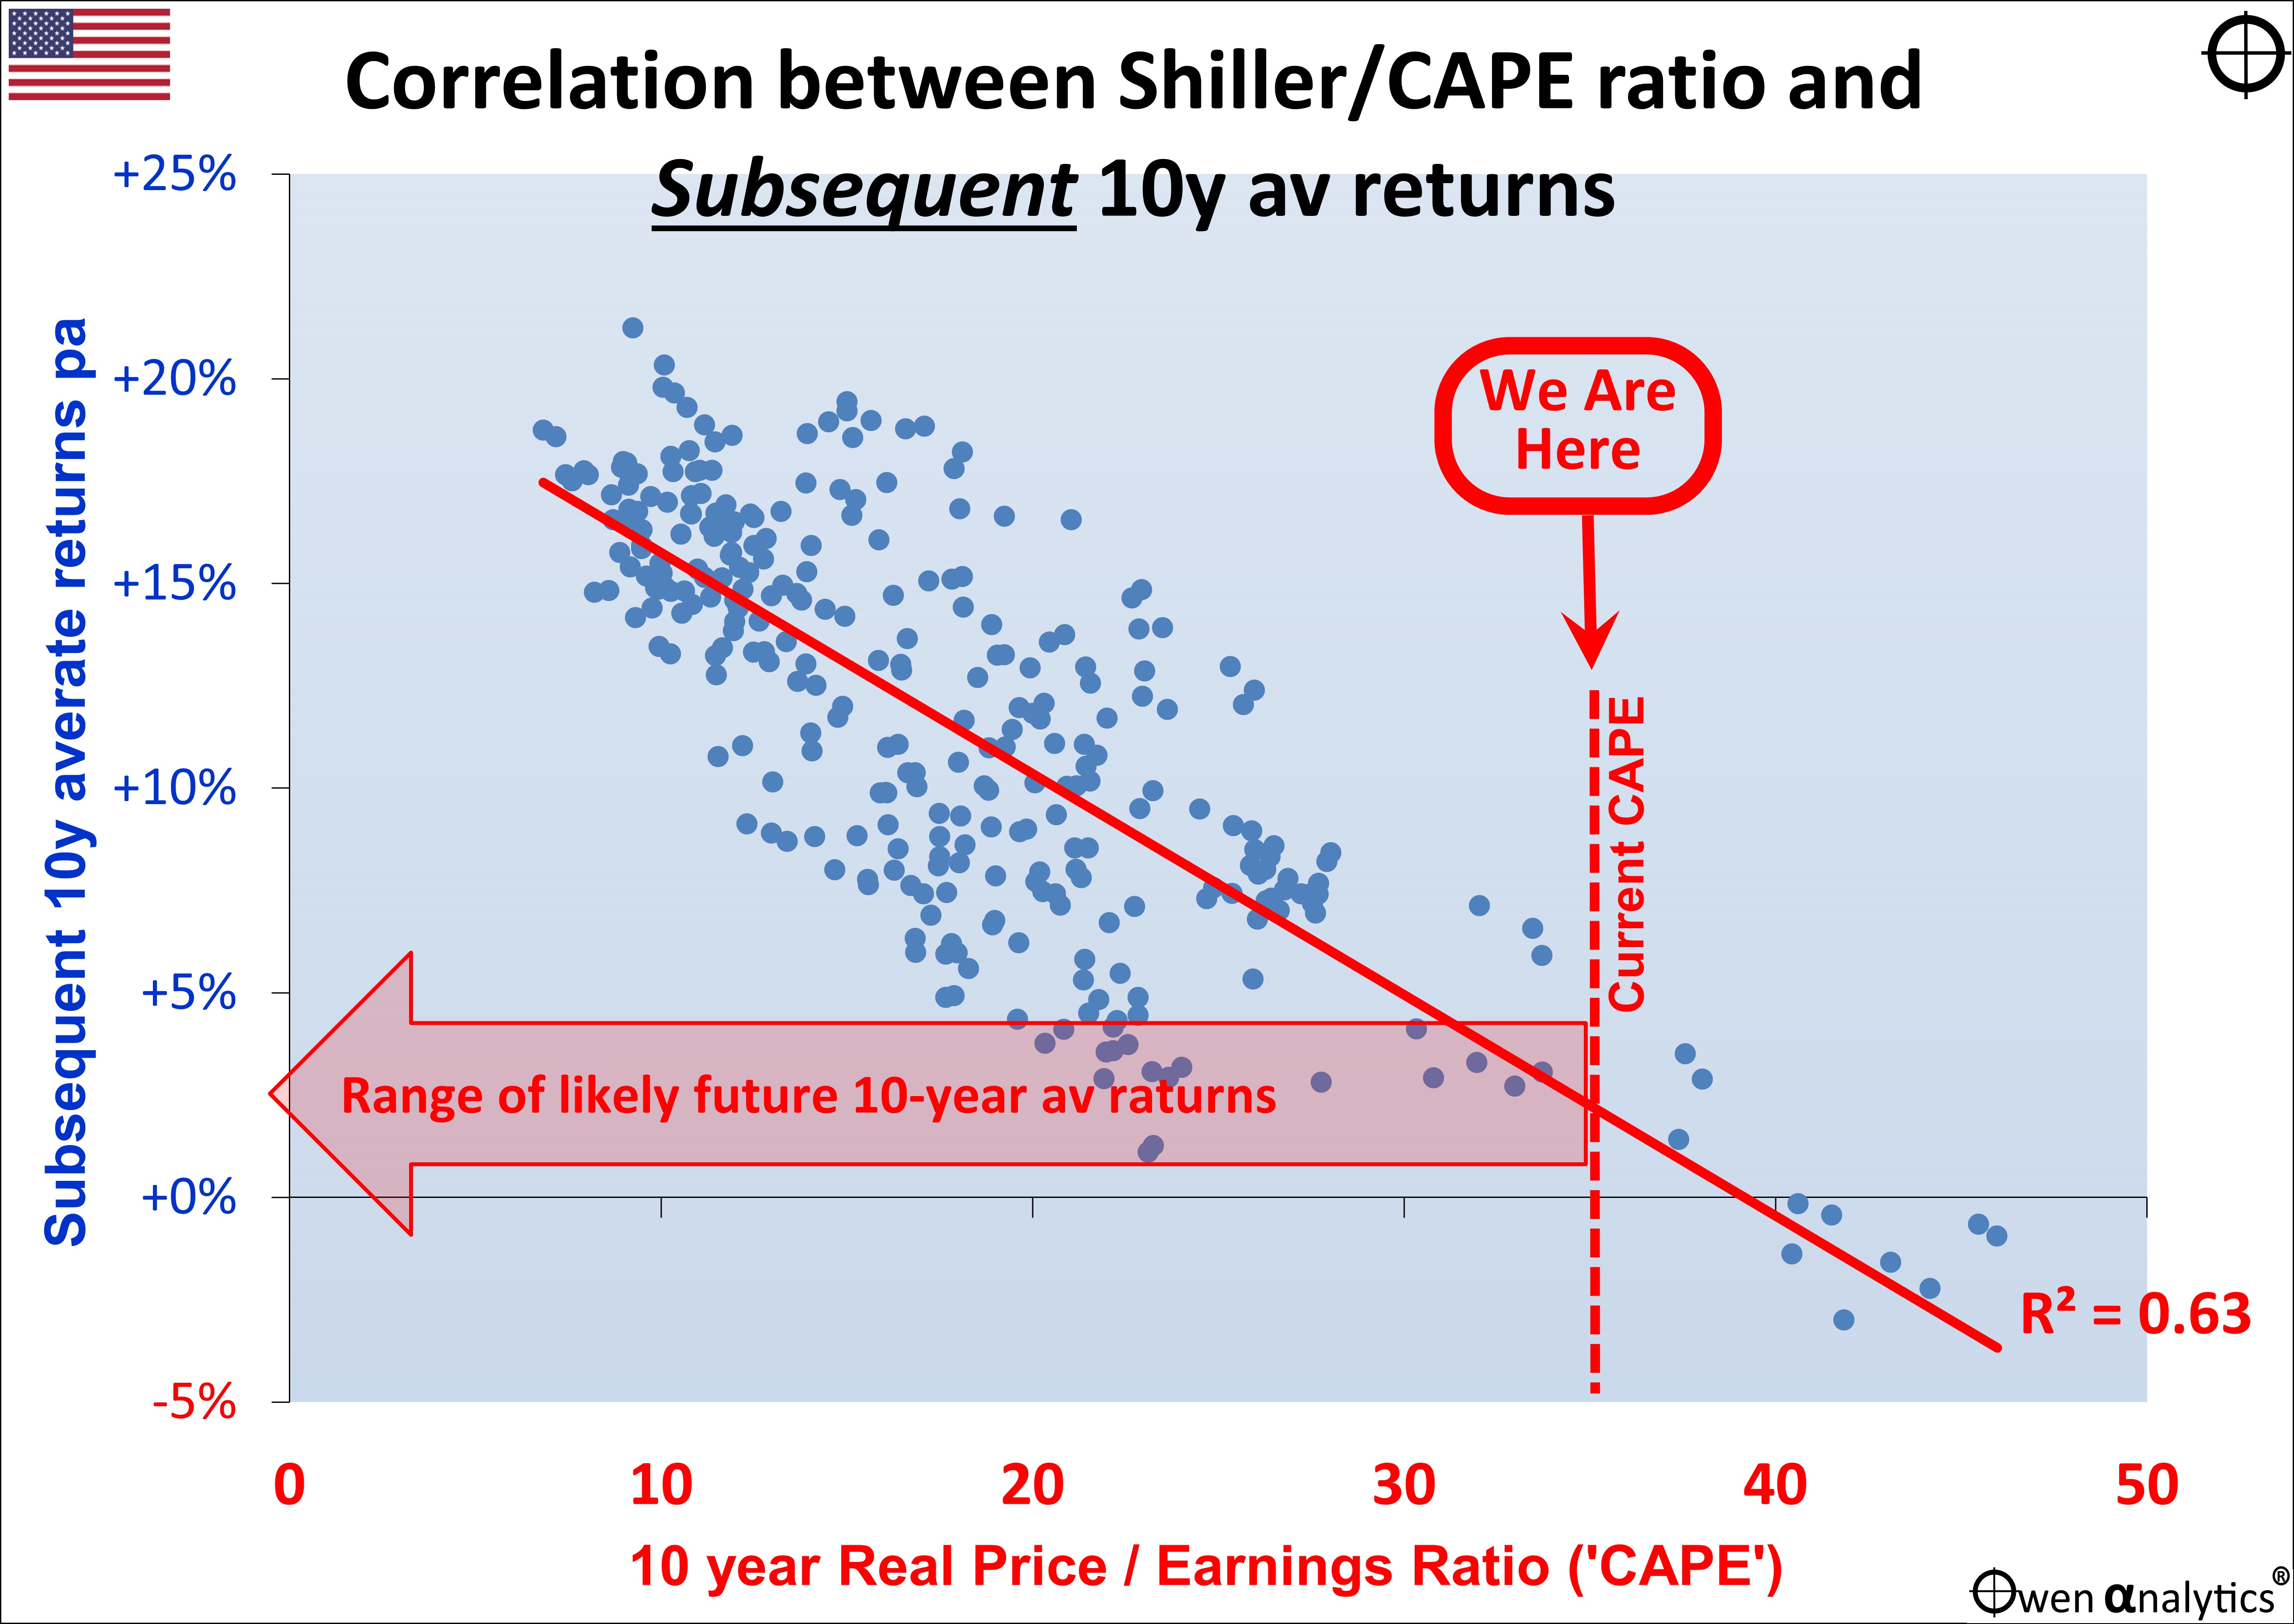
The cluster of dots in the upper left segment represent the 10-year periods of HIGH returns (above say 15% pa), and these were almost all achieved following LOW CAPE ratios (below around 15 along the horizontal axis).
Conversely, the cluster of dots in the lower right segment represent the 10-year periods of LOW returns (below 5% pa), and these were all achieved following HIGH CAPE ratios (above say 35 on the horizontal axis). In the far lower-right are the negative subsequent 10-year returns following the quarters when the CAPE ratios were above 40 at the top of the late 1990s ‘dot-com’ boom. That was the only time CAPE went above 40.
We are not at those extreme levels yet, but getting dangerously close if the share market keeps rallying to new highs.
The current CAPE ratio (vertical red dotted line) is pointing to very low average returns over the next 10 years (large horizontal arrow, which is broad to indicate a range of returns, rather than a specific number).
Long-term -v- short-term outlooks
Although the current CAPE ratio for the US market is now very bearish for long term returns from current levels, a high CAPE ratio, even if extremely high, is NOT a warning of an imminent correction.
This is a long-term model, so it provides NO guidance at all on short-term or medium-term returns along the path to the 10-year forecast return. It just says that average returns over next ten years are probably (with a high degree of confidence) going to be well below average from the current starting point.
As a sanity check for this forecast for very low returns from US shares for the next decade from current levels, it is entirely consistent with my report last week on the average returns from different sset classes in Low, Moderate and High inflation environments:
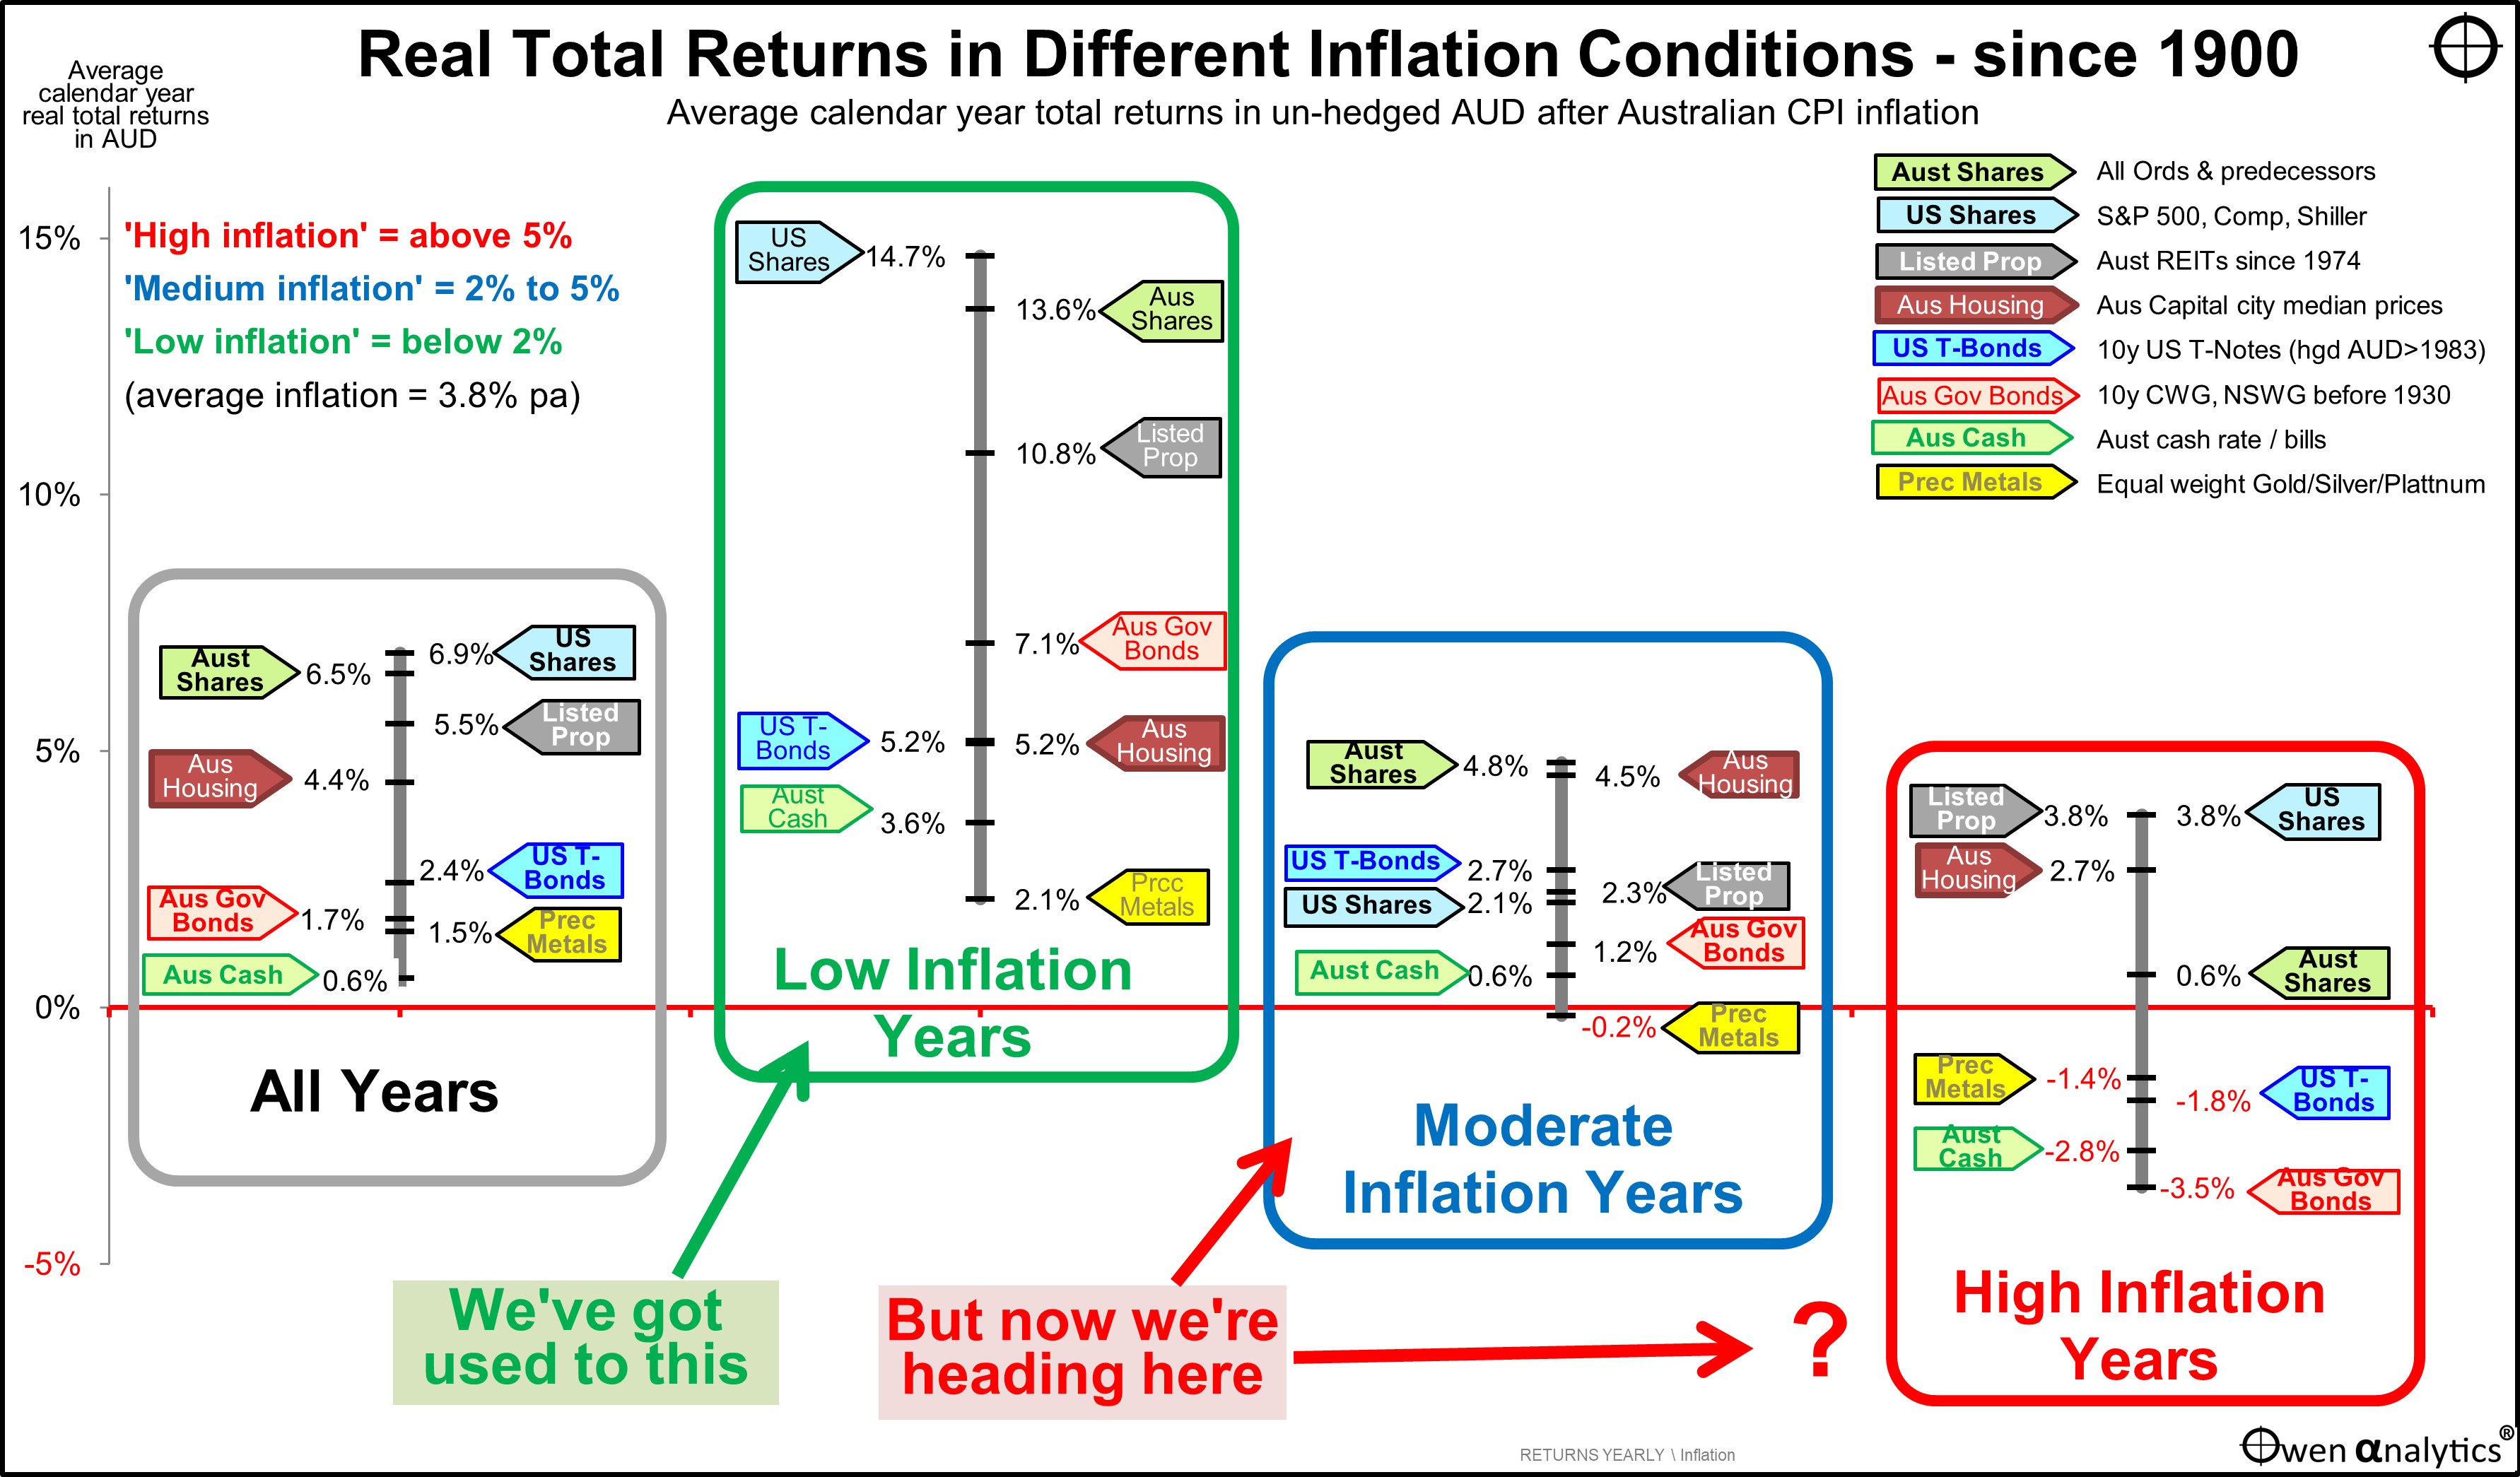
This shows that my forecast for below average returns from the CAPE ratio model are more or less the same as historical returns from the US share market in 'Moderate' and 'High' inflation conditions. The golden era of above average returns in 'Low' (ie sub 2%) inflation years is well and truly over.
Recent high CAPE ratios immediately before big falls
At the end of December 2021, immediately before the -25% correction in during January to October 2022, the CAPE ratio for the US market was at a post-dot-com high of 39.6. At that extreme level, any serious shock would been enough to trigger a big fall. As it turns out, the -25% correction in 2022 was triggered by the aggressive rate hikes from the Fed to attack runaway inflation, and Russia’s invasion of Ukraine.
Prior to that, at the end of December 2019, before the -34% Covid sell-off, the US CAPE ratio was a very high 31.2. The 34% correction was triggered, of course, by the sudden and unprecedented nationwide Covid lockdowns by governments everywhere.
NB. The pre-COVID CAPE ratio of 31 was similar to what it was in September 1929 immediately before the 1929-32 crash. The only time when the CAPE ratio was higher was at the end of 1999 at the dot-com peak before the ‘tech wreck’.
With extremely high pricing, the trigger for correction could be anything
Prior editions of this report noted the warnings from those high CAPE ratios in December 2019 and December 2021, right before the sell-offs in 2020 and 2022. I didn’t predict the Russian invasion of Ukraine, nor the Covid crisis of course. I didn’t need to predict the trigger. All I knew was the share market was vastly over-priced and highly vulnerable to a big correction, just waiting for a trigger to set it off.
The next trigger?
With the US market once again at extremly expensive levels on this measure (and many other measures), any serius trigger could be enough to cause a deep sell-off, eg:
- Over the past year and a half, economists everywhere were certain of a US/global recession. Fortunately, they were wrong, and fortunately nobody listens to economists!
- A major escalation of the war in the middle east eg Iran (backed by Russia/China) -v- Israel (backed by US/NATO).
- A major escalation of the Russia/Ukraine war – eg US troops on the ground in Ukraine, or Russia resorting to the nuclear option.
- China using the current diversions in Ukraine and the Middle East to invade Taiwan.
- NB. The trigger for the 2001-2 ‘tech wreck’ was the Fed hiking rates to 6.5% in May 2000 and warnings of countless profitless ‘dot-coms’ running out of cash. This time around the Fed is unlikely to hike rates above the current 5.25%, and the big ‘bubble’ stocks like Nvidia, Meta, Amazon, Apple, Microsoft, etc are posting enormous cash profits.
- Also, what triggered the 2008-9 GFC was a bank insolvency crisis, combined with extreme inter-connectedness of banks globally, with their unknown holdings of securities with unknown values. This time around, there is a looming crisis in US regional banks with their high levels of exposure to commercial real estate, but it is probably not enough to infect the broader US banking system, let alone the global banking system, as was the case in the GFC.
My base case for an end to the current boom has been far less radical than these. My base case for the past year has been that share markets will stop rising when investors everywhere finally come to realise that inflation is going to remain stubbornly above target levels and that central banks are not going to make the rapid, deep, and imminent rate cuts that investors everywhere were banking on.
I started this article with three questions -
- Is this ‘correction’ enough?
- Is the market still expensive?
- Is this the start of the coming big correct?
The answers to the first two questions are ‘No’ and ‘Yes’ – for the reasons explained above.
However, the answer to the third question is ‘Probably not yet’. Here's why:
My base case scenario - share markets pausing or falling a little as investors realise that rate cuts are not going to be as fast and furious as they had hoped for - is looking like coming to fruition
But this is not the kind of short, sharp shock that would cause a sudden deep sell-off like the ‘tech wreck’ or the ‘GFC’ (say -30% or -40% or so). That would require a massive, unexpected shock from left field.
History has shown that we don’t need to predict what it will be, because it is unpredictable! All we need to do is recognize the extreme over-pricing, and the extreme vulnerability to any unexpected shock. It won’t really matter what it is. Any major shock will do.
Meanwhile, the market may well go on rising to new highs for a while longer until the final shock hits.
Aggressive investors will probably ride the bull for a little longer, with a close eye on the exit door. Cautious investors will probably have taken profits and/or reduced exposure already.
‘Value’ investors have been waited on the sidelines for years hoping and waiting for good companies to become ‘cheap’ with a margin of safety below ‘fair value’ before they buy. At least cash is now paying 4%-5% interest while they wait.
Although this CAPE ratio measure has a very long history and a widespread following, it is only one measure. I report on a variety of other measures and other approaches in other articles.
Thank you for your time – please send me feedback and/or ideas for future editions!
This is intended for education and information purposes only. It is not intended to constitute ‘advice’ or a recommendation to buy, hold, or sell and stock or security or fund. Please read the disclaimers and disclosures below.