Key points:
-
-
- Most years of RISING oil prices (even severe oil price spikes like 1979) were GOOD years for shares.
- In the 56 years since 1970, oil prices ROSE in 57% of years (32 years, right half of chart), and shares posted POSITIVE returns 72% of the time (23 years) - upper right segment ’B’.
- Out of all four segments on the chart, the sector with the most years by far is the upper right segment ‘B’ which was when oil prices and shares were both UP.
- Many of the BEST years for Australian shares were when oil prices were RISING including 1978, 1979, 1985, 1989, 1995, 1996, 1999, 2003, 2004, 2005, 2007, 2009, 2013, 2019, and 2021.
- (The above chart only shows years since 1970 for simplicity, but before 1970 we also had positive shares with rising oil prices in 1902, 1919, 1925, 1931, 1933, 1936, 1942, 1957, 1967.
- Conversely, some of the WORST years for shares were when oil prices were also FALLING (segment ‘C’ ), but these had little to do with oil - like 1930 (Great Depression) and 2008 (Global Financial Crisis).
- The only time shares crashed while oil prices were rising was the 1973-4 crash, but inflation was already double digits before Yom Kippur/OPEC oil price spike.
- In summary - rising oil prices can have major impacts on consumer sentiment and economic activity but impacts on share markets have been mostly positive or benign – even during big oil price jumps.
- At most, oil prices have been a relatively minor contributing factor in share boom-bust cycles, mainly via general inflation and interest rates, rather than the sensationalist ‘sticker shock’ impact highlighted in media headlines.
- Each cycle is different of course, and it is still early days for 2026!
Rising oil prices tend to send a shiver down the collective spines of investors - but is this justified? There is a popular myth that rising oil prices are bad for share markets but is it supported by facts or is it just another market myth?
In theory, rising oil prices should hurt corporate profits, and therefore share prices, for two main reasons. First - virtually all goods and services sold by companies have an oil price component in their cost structure so corporate profit margins are squeezed by rising input costs if they can’t be fully passed on instantly to customers in the form of higher prices without losing sales. Second - higher oil prices take money out of the pockets of consumers and businesses, money that could otherwise be spent on buying goods and services from companies. Lower sales leads to lower production, jobs, spending, etc.
The Myth of oil prices and share markets
Contrary to the popular myth that rising oil price are bad for share prices, the fact is that most episodes of RISING oil prices in the past have been accompanied by GOOD returns from shares, even severe oil price spikes.
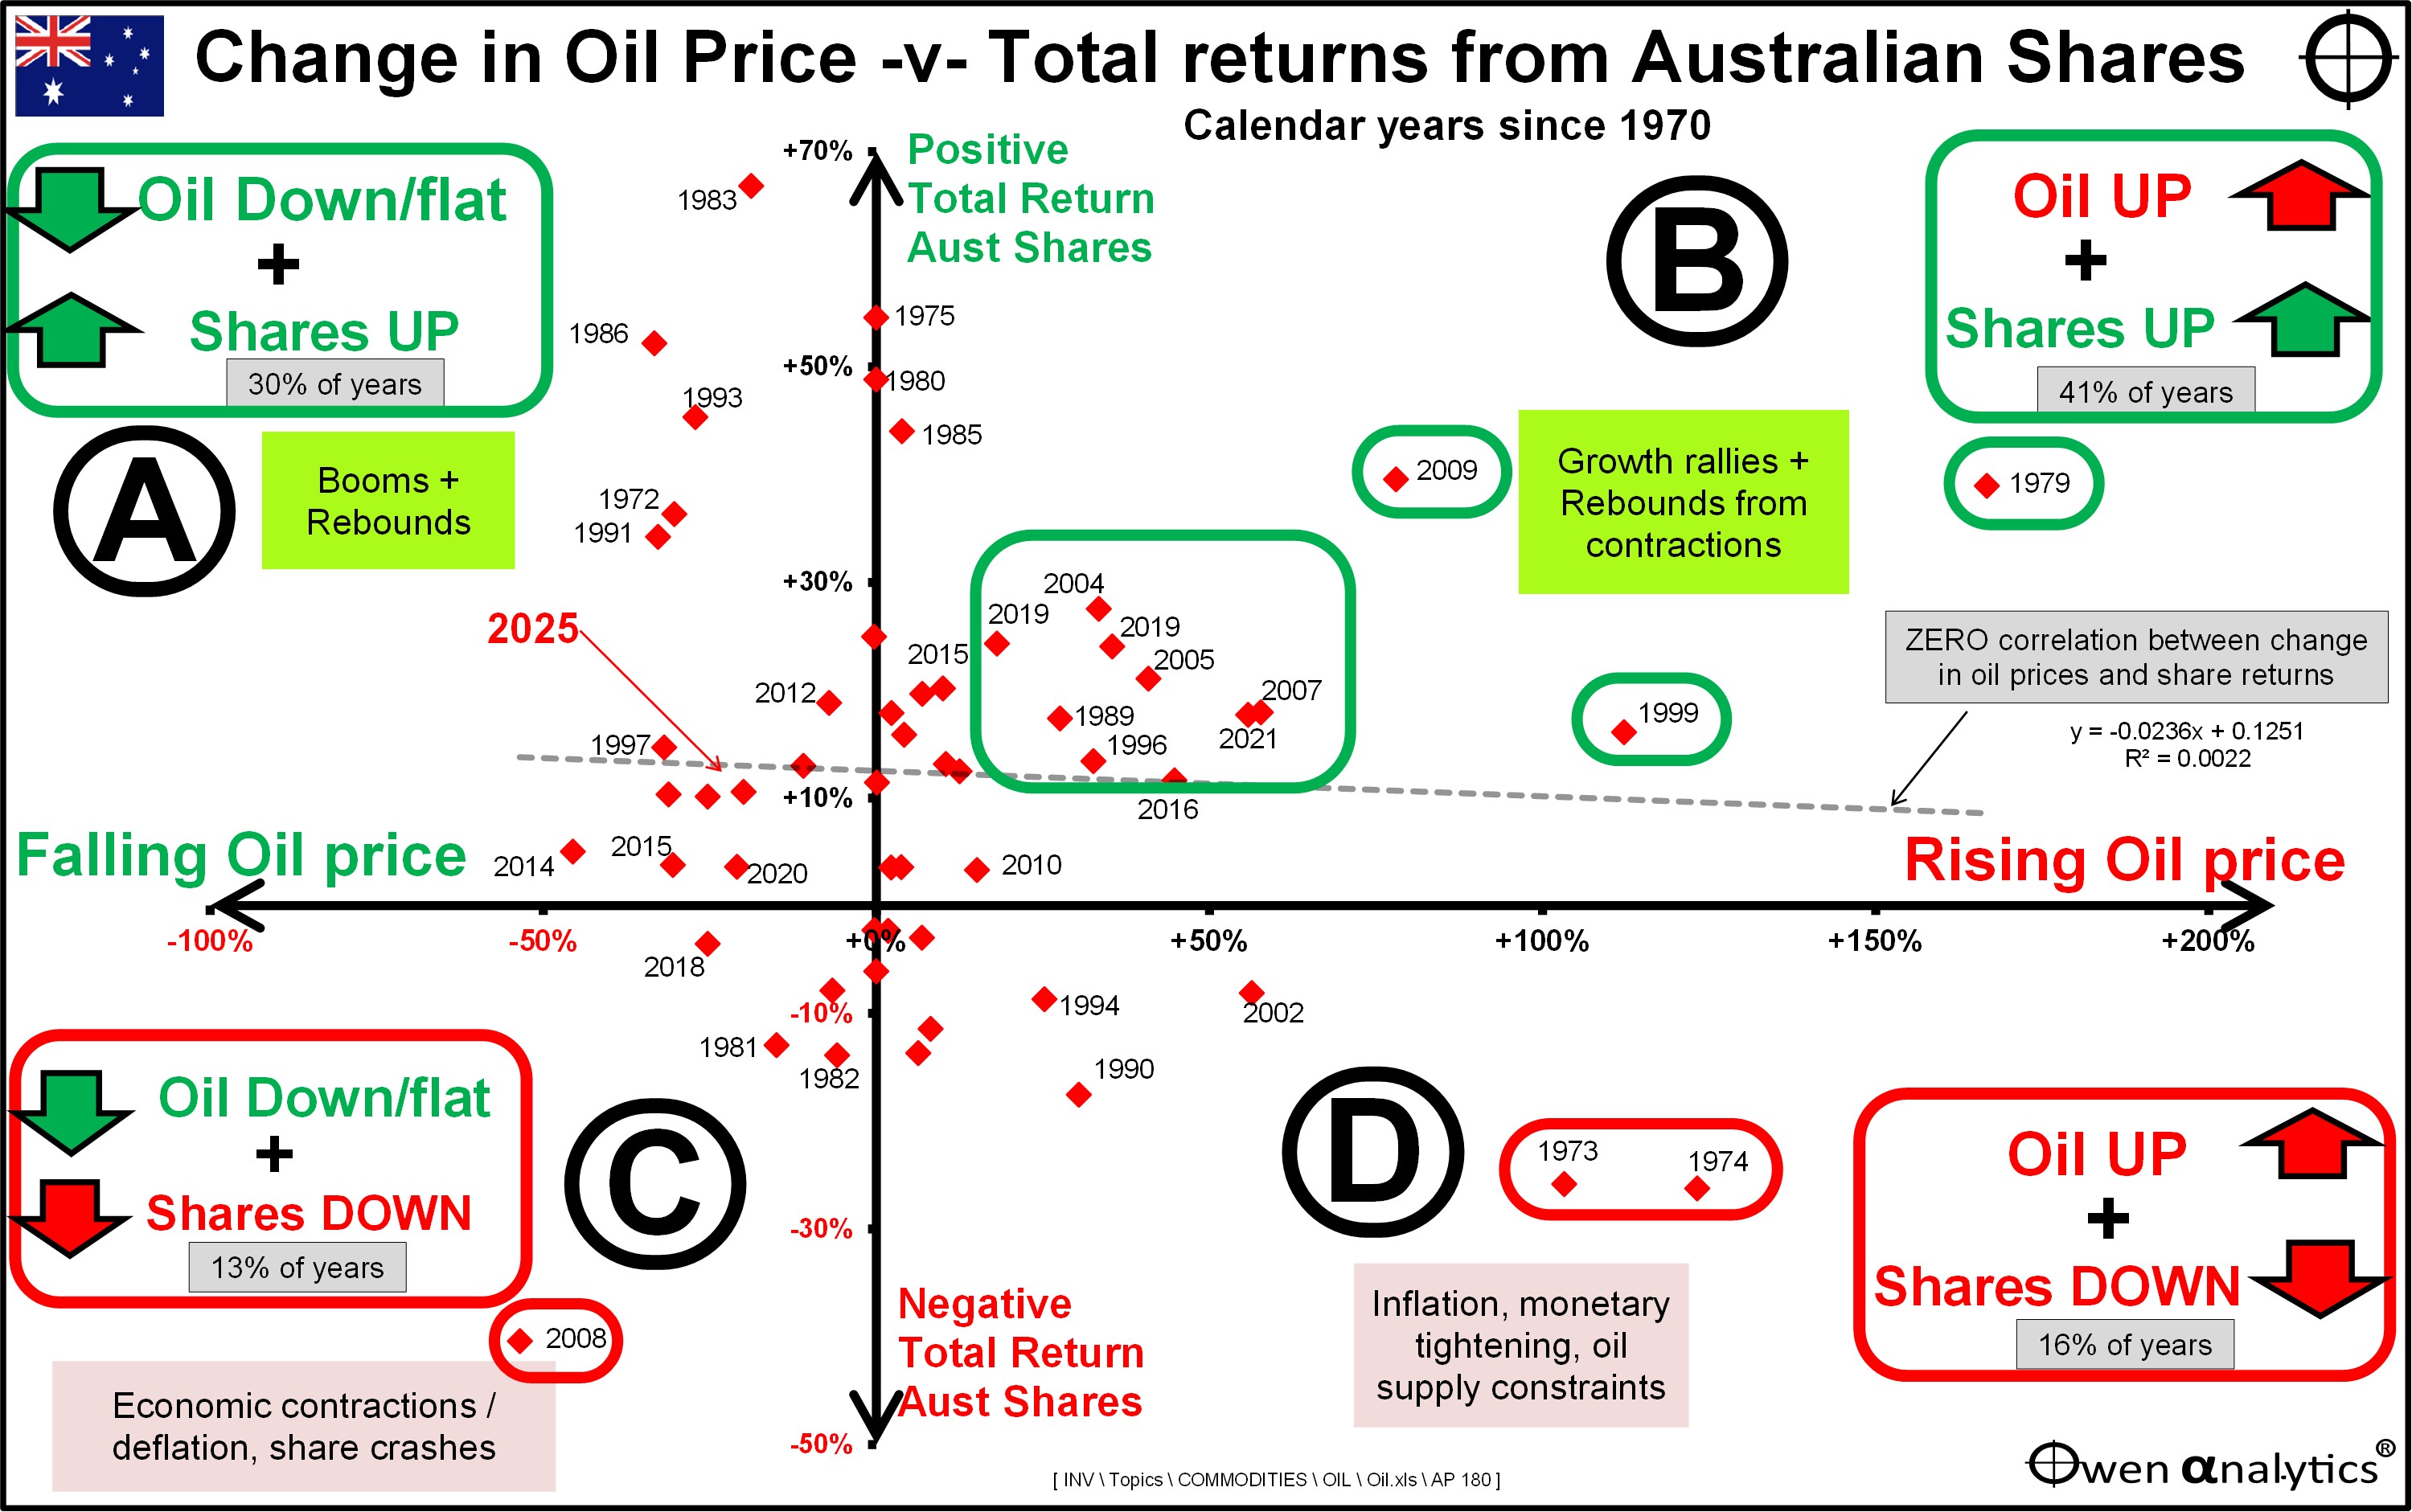
Today’s chart shows total returns (share prices + dividends) from the broad Australian share market index per calendar year since 1970 (vertical axis), against with the change in oil price (WTI benchmark in USD) during the year (horizontal axis).
(For this chart I selected 1970 as the starting point as this was when oil prices became much more volatile. However if we go back before 1970 to 1900, the outcomes are almost exactly the same).
Fact or myth?
If the market myth was true - that rising oil prices are bad for shares and falling oil prices are good for shares, then most of the dots should be in either the upper-left segment ‘D’ (oil price up + shares down), or upper-left segment ‘A’ (oil price falling or flat + shares up).
However the dots are scattered all over the chart, and less than half are in segments A or D. Most are in Segment B (oil and shares both up), or Segment C (oil and shares both flat or falling).
In fact there is no statistical relationship between annual share returns and changes in oil prices. (Likewise for the US share market.)
Here are the facts:
Best years for shares were when oil prices ROSE
In the 56 years since 1970 - oil prices rose in 57% of years (32 years, right half of chart), and shares posted POSITIVE returns in 72% (23) of those years of RISING oil prices (upper right segment ’B’).
Out of all four segments on the chart, the sector with the most years by far is the upper right segment ‘B’ which was when oil prices were RISING but share returns were POSITIVE, and most of these years had above average returns from shares.
In many of the years when oil prices rose the most - shares posted good positive returns:
-
-
- 1979 - oil up +167%, shares +39% (Iranian Revolution – the 2nd 1970s oil price ‘shock’)
- 1999 - oil up + 112%, shares +16% (dot-com boom)
- 2009 - oil up +78%, shares + 40% (GFC rebound)
- 2016 - oil up +45%, shares + 12% (China stimulus)
Segment B contains many of the BEST years for Australian shares when oil prices were RISING, including 1978, 1979, 1985, 1989, 1995, 1996, 1999, 2003, 2004, 2005, 2007, 2009, 2013, 2019, and 2021.
(The above chart only shows years since 1970 for simplicity, but before 1970 we also had positive shares with rising oil prices in 1902, 1919, 1925, 1931, 1933, 1936, 1942, 1957, 1967. Note that 1931, 1933 and 1936 were ‘Depression years’. Also in this category is 1942: the Aussie share market still returned +18% while Japanese planes were bombing Darwin and all across northern Australia, and Japanese subs were bombing ships in Sydney harbour.)
Rising oil prices and negative years for shares
There were also a small number of years of strong oil price RISES and NEGATIVE returns from shares (segment ‘C’). However, the causes of the share market falls were largely unrelated to oil prices:
-
-
- 1973 - oil up +103%, shares down -25% (1973-4 crash)
- 1974 - oil up +123%, shares down -26% (1973-4 crash)
- 2002 - oil up + 56%, shares down -8% (‘tech-wreck’)
- 1990 - oil up + 30%, shares down -18% (20% interest rates, ‘recession we had to have’)
The main one was the 1973-4 share market crash, but the 1973-4 oil shock was not a primary factor in the crash. Inflation was already above 10%, and Whitlam’s debilitating credit squeeze and dollar revaluation program were already underway even before the Yom Kippur / OPEC embargo sent oil prices skyrocketing from the end of 1973. The 1973-4 share crash was primarily a result of the combined impact of the collapses of the twin booms - the speculative mining bubble and the debt-fuelled property finance bubble, exacerbated by severe monetary tightening and domestic political crises.
For my story of the 1973-4 crash -
For my the role of oil prices in the 1973-4, 1979 and 2022 oil price spikes -
Worst years for shares were when oil prices fell
Conversely, some of the WORST years for shares were when oil prices were also FALLING (segment ‘C’). However, these crashes had little to do with oil prices:
-
-
- 1930 - oil down -45% shares down -30%, (Great Depression, nothing to do with oil)
- 2008 - oil down -54% shares down -40%, (Global Financial Crisis, nothing to do with oil)
Conclusion
Rising oil prices can have major impacts on consumer sentiment and economic activity but impacts on share markets have been mostly positive or benign – even during big oil price jumps.
At most, oil prices have been a relatively minor contributing factor in share boom-bust cycles, mainly via general inflation and interest rates, rather than the sensationalist ‘sticker shock’ impact highlighted in media headlines.
Each cycle is different of course, and it is still early days for 2026!
‘Till next time – happy investing and stay healthy!