Here is my essential 1-page snapshot for Aussie investors – covering Australian and US share markets, short- and long-term interest rates, inflation, and the AUD/USD exchange rate.
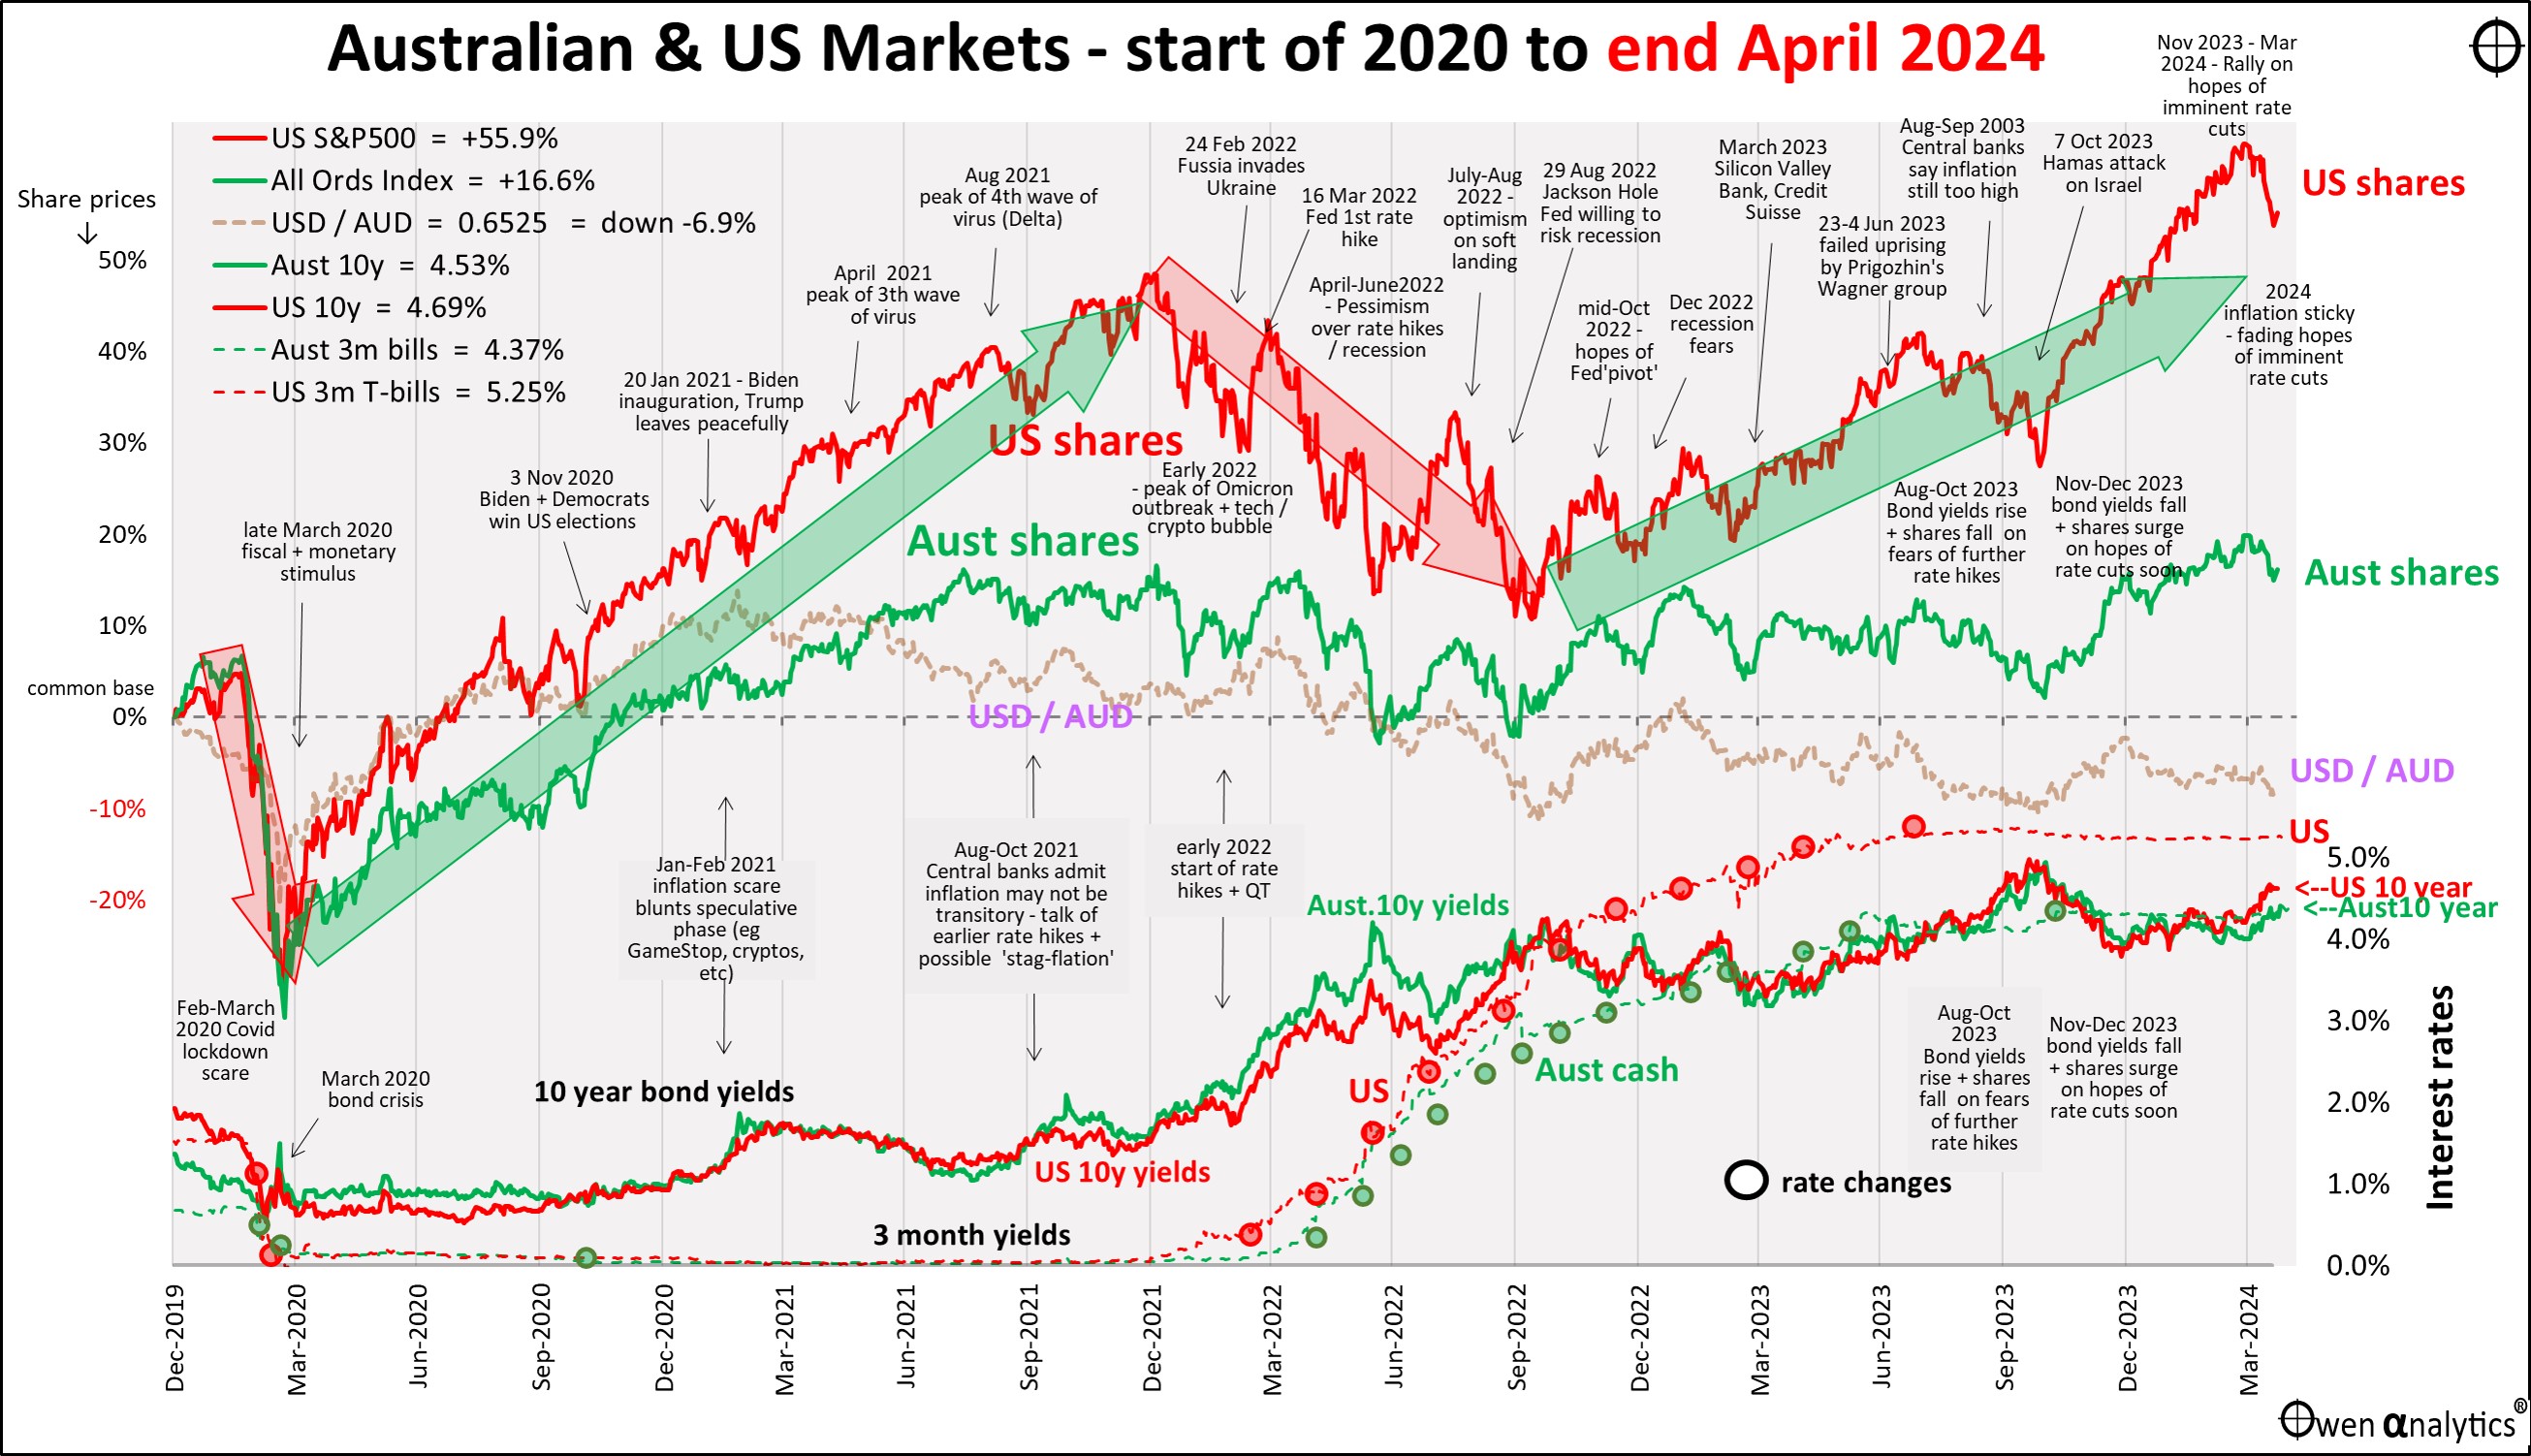
There are two versions – first is the traditional version on a single chart:
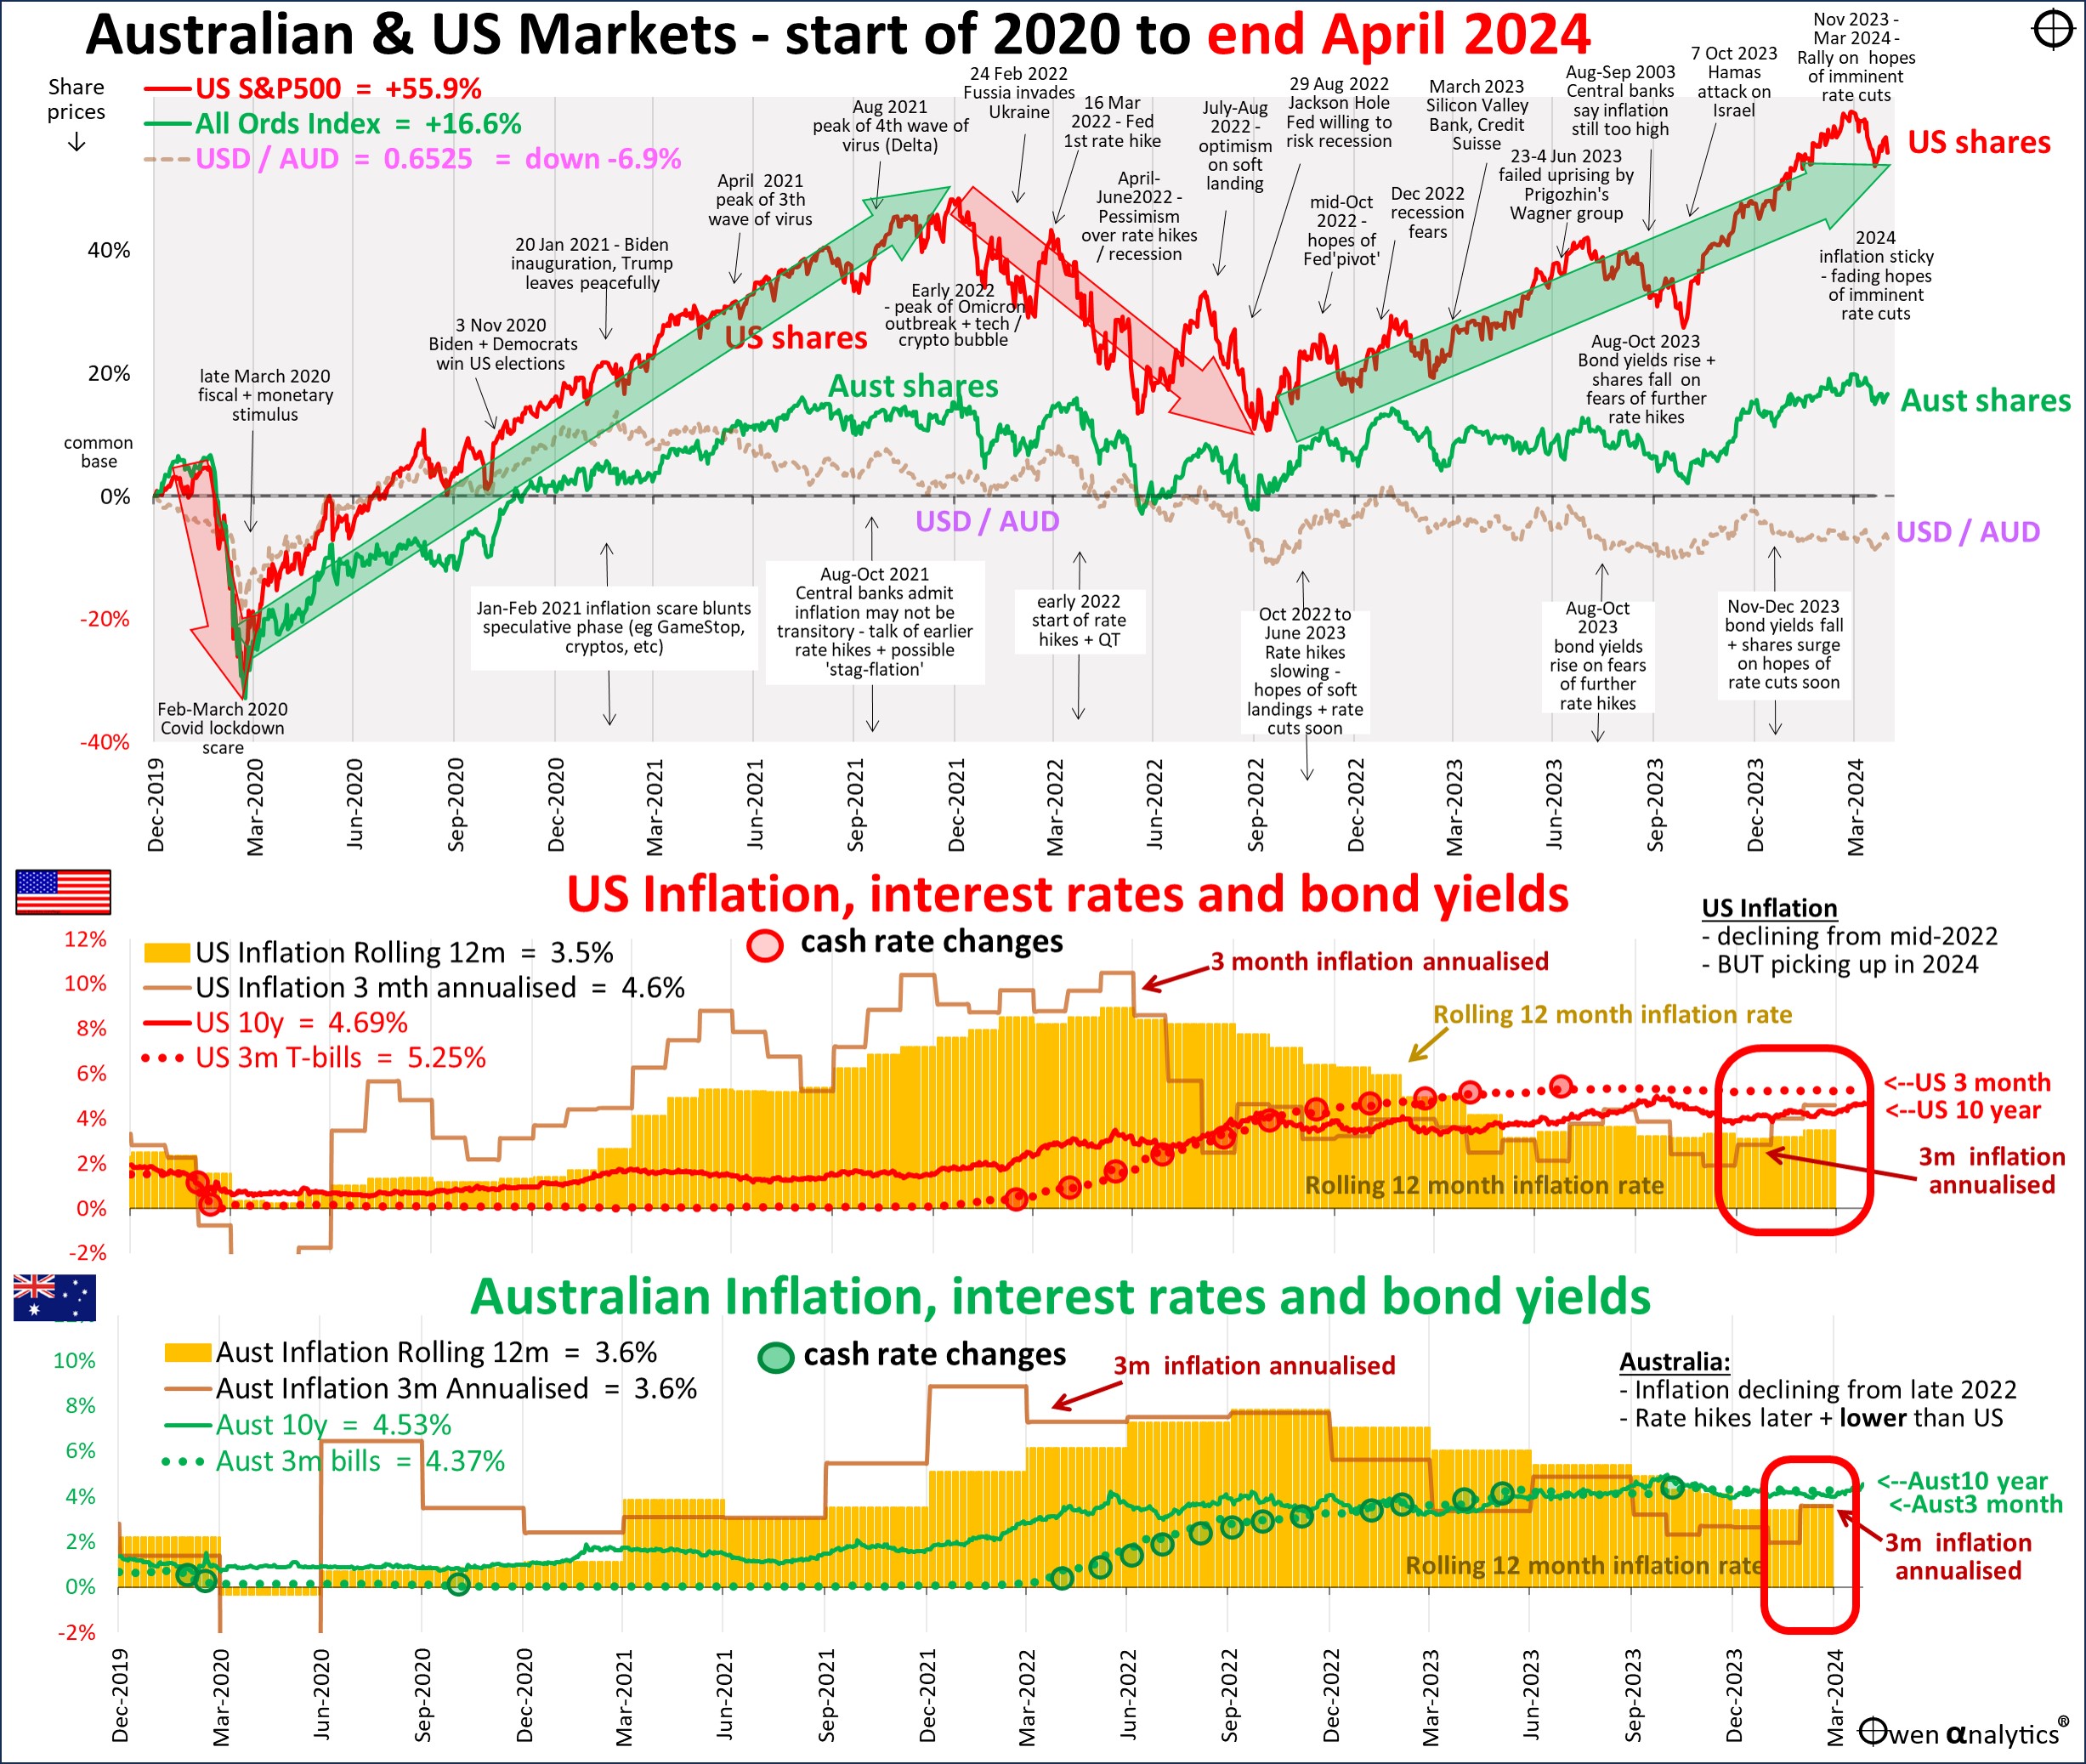
Also the alternate version below, requested by several advisers - showing inflation (rolling 12-month annual rate, and annualised rolling 3-month rate) in Australia and the US:
What happened and why?
The big story in April was that investors everywhere finally woke up to the fact that central banks were not on the cusp of rapid and deep cuts to interest rates as they had hoped. As these hopes were boosting share prices everywhere in the recent rally, share markets fell back a little in April.
Investors are asking: ‘Is this the start of a big correction?’, and ‘Are the share price falls done for now?’ Let’s find out.
In previous editions of this report over the past year, I have repeatedly said that this market-wide assumption of imminent rate cuts was far too optimistic. Inflation was not going to fall neatly back to target, especially with wages rising everywhere, and central banks were not going to cut rates back to post-GFC and post-Covid zero or near-zero levels, even if inflation did magically return to target.
(Keen readers may notice that I didn't change the position or angle of the big green arrow to the right of the main charts indicating the current trend in US share prices. In the end of March edition, the red line for US shares was well above the green trend arrow. In April, share prices fell back to the green trend arrow. I didn't move the arrow. I did not 'predict' the fall, it was just that shares were simply far too bullish and were bound to fall back. The question now is - will they fall further?)
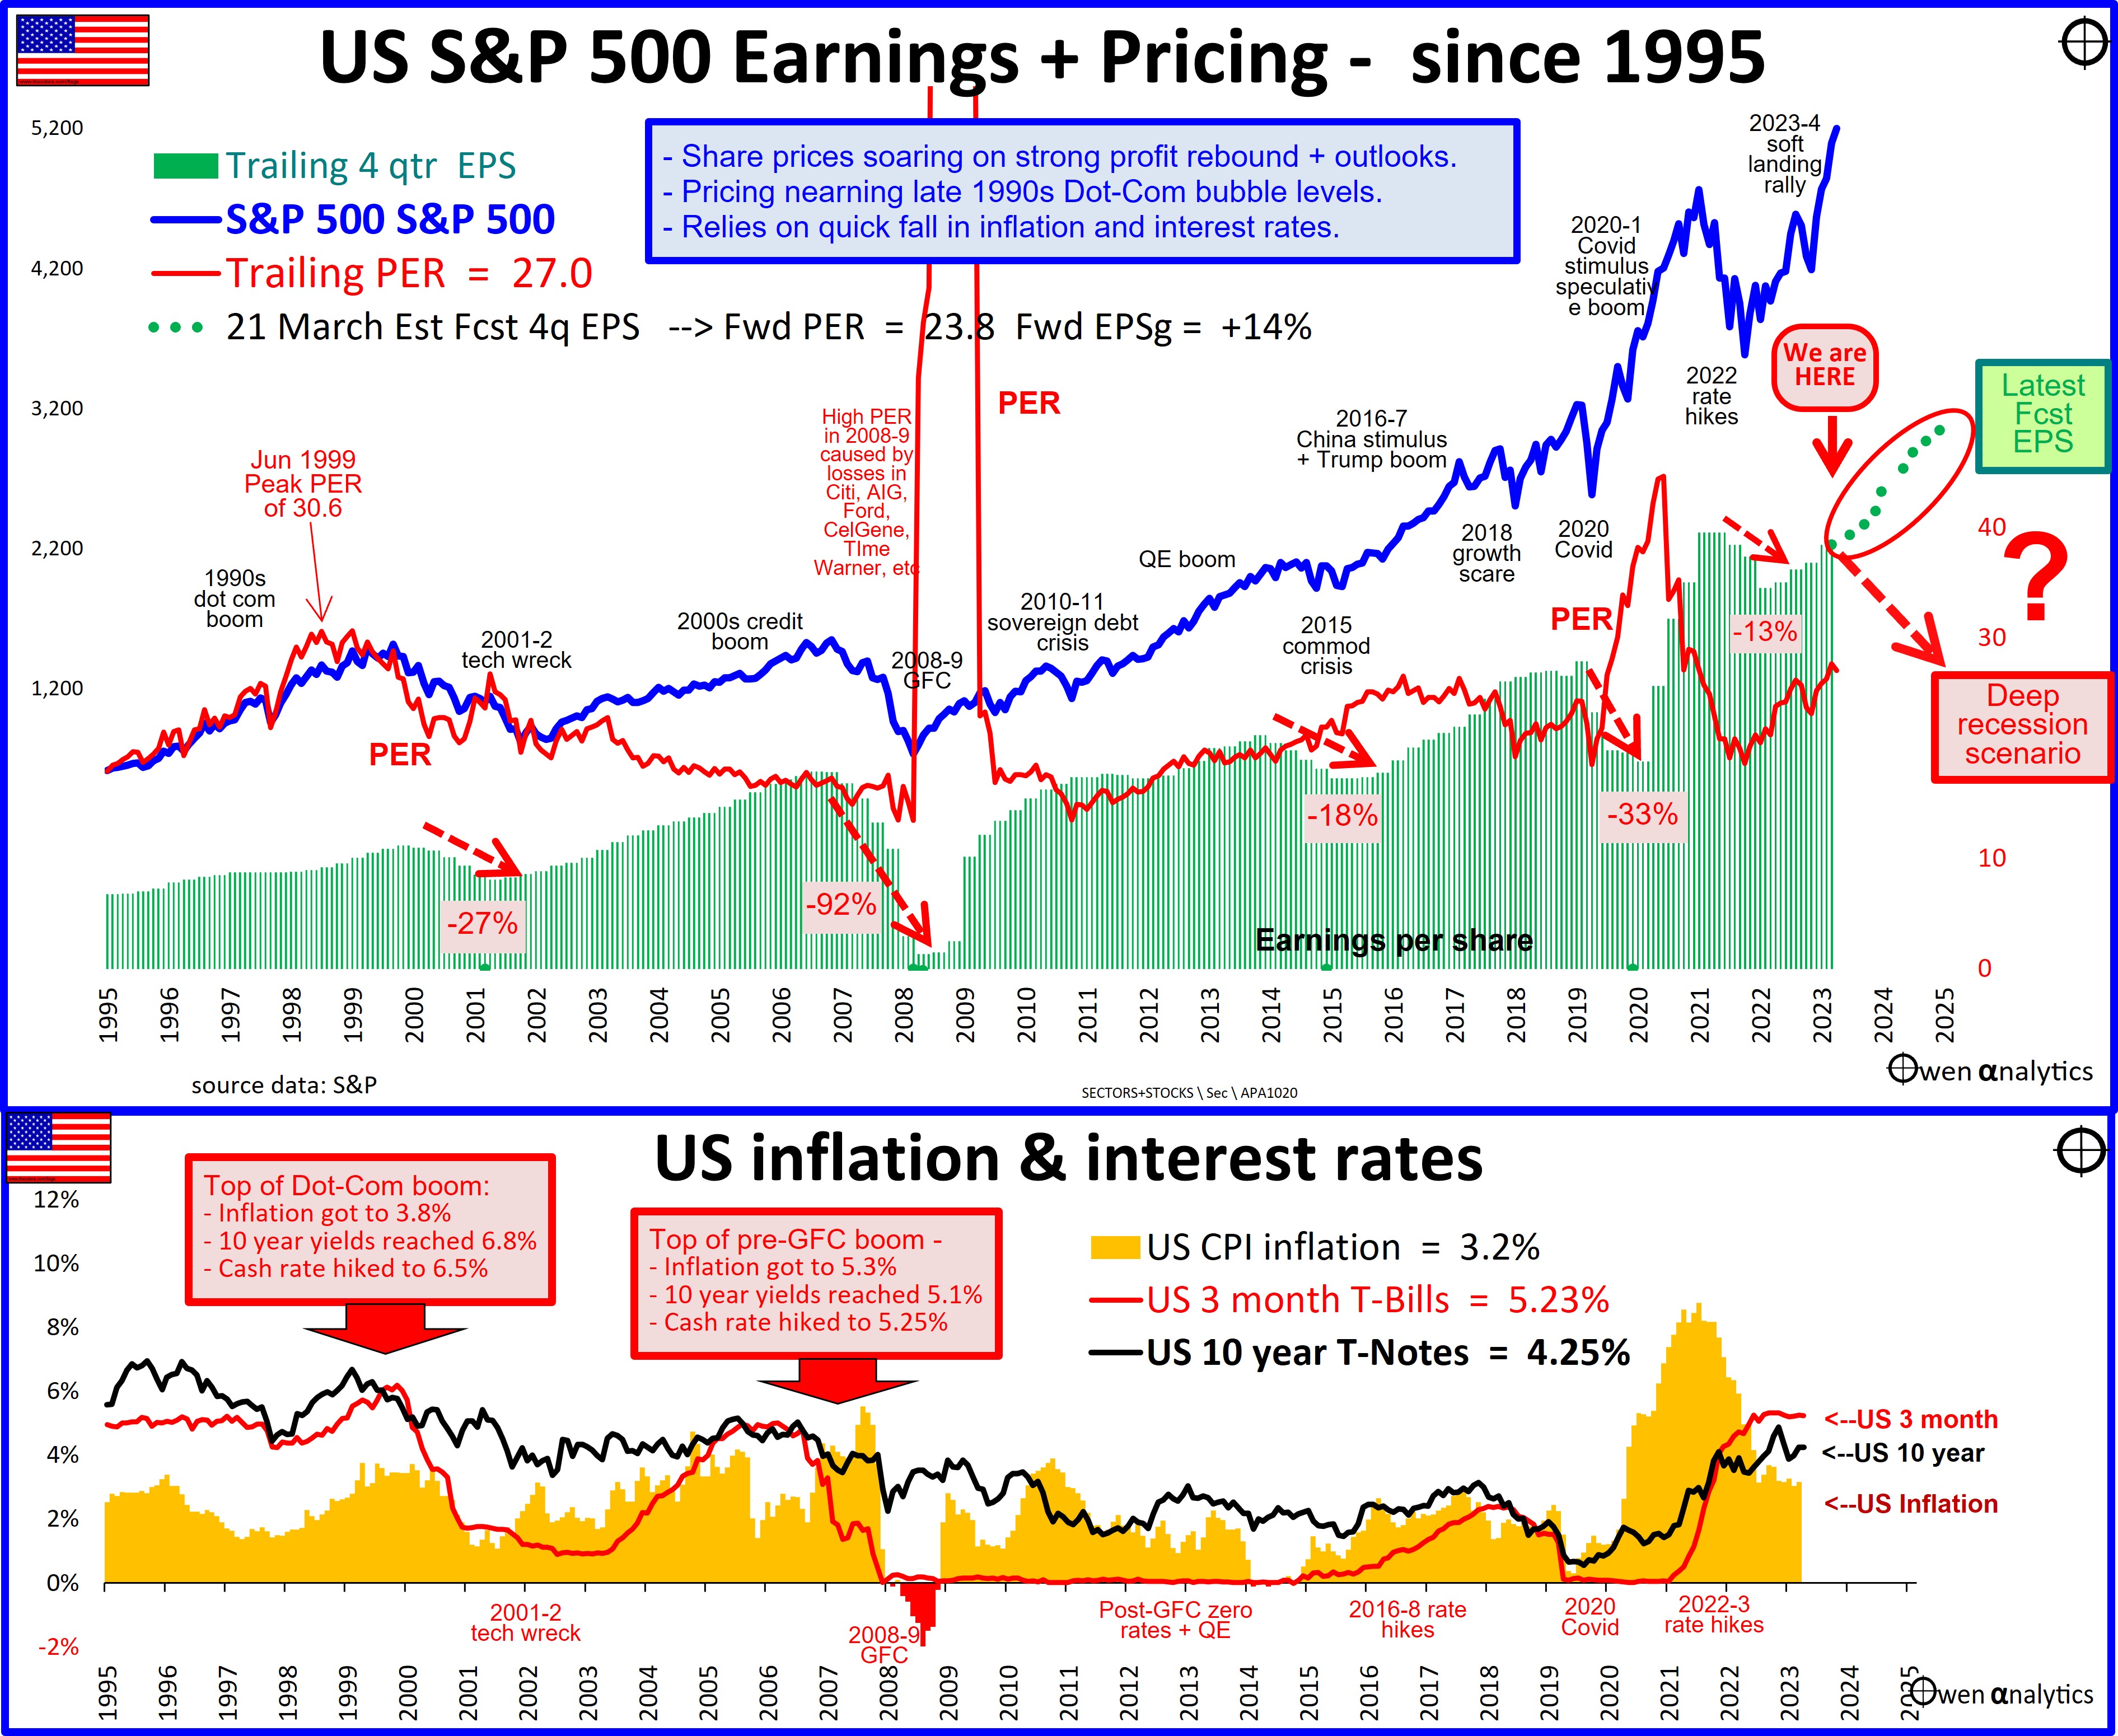
Inflation and interest rates
The inflation cat is out of the bag. Wage regulators and employers are granting double-digit wage claims without even a pretence of productivity gains, but just to cover rising ‘cost of living’. This runs the risk of creating an upward spiral in prices and wages, especially with very tight jobs markets and expansionary fiscal policy – ie government spending rising faster than inflation.
(The Left call it a ‘price-wage’ spiral, the Right call it ‘wage-price’ spiral, to emphasise what each side believes is the primary cause). In Australia, we have Treasurer Jim Charmer back-slapping union bosses to go for 20+% wage claims with not even a hint of productivity gains, unwinding the great work done by his former mentors Hawke and Keating.
The lower sections in the above chart highlight the problem. In the US panel, we can see that annualised 3-month CPI inflation is now back up to 4.6% pa, which is above the 3.5% rolling 12-month ‘headline’ rate. This is the wrong direction for rate cuts.
In the bottom panel for Australia, annualised 3-month CPI inflation was leading the rolling 12-month ‘headline’ rate down over the past year, but has now risen to 3.6%.
Services inflation is remaining ‘sticky’ due to rising wages, while goods inflation had been falling due to falling commodities prices with many Covid supply restrictions now easing. However, fuel prices are now on the rise again with fears of escalating war in the Middle-East.
Goods -v- Services inflation
Here is the Australian picture for Goods inflation (blue) versus Services inflation (orange) in recent years. The solid lines are rolling 12-month inflation rates, and the dotted lines are annualised rolling 3-month rates, which show the recent trends, but are much more volatile.
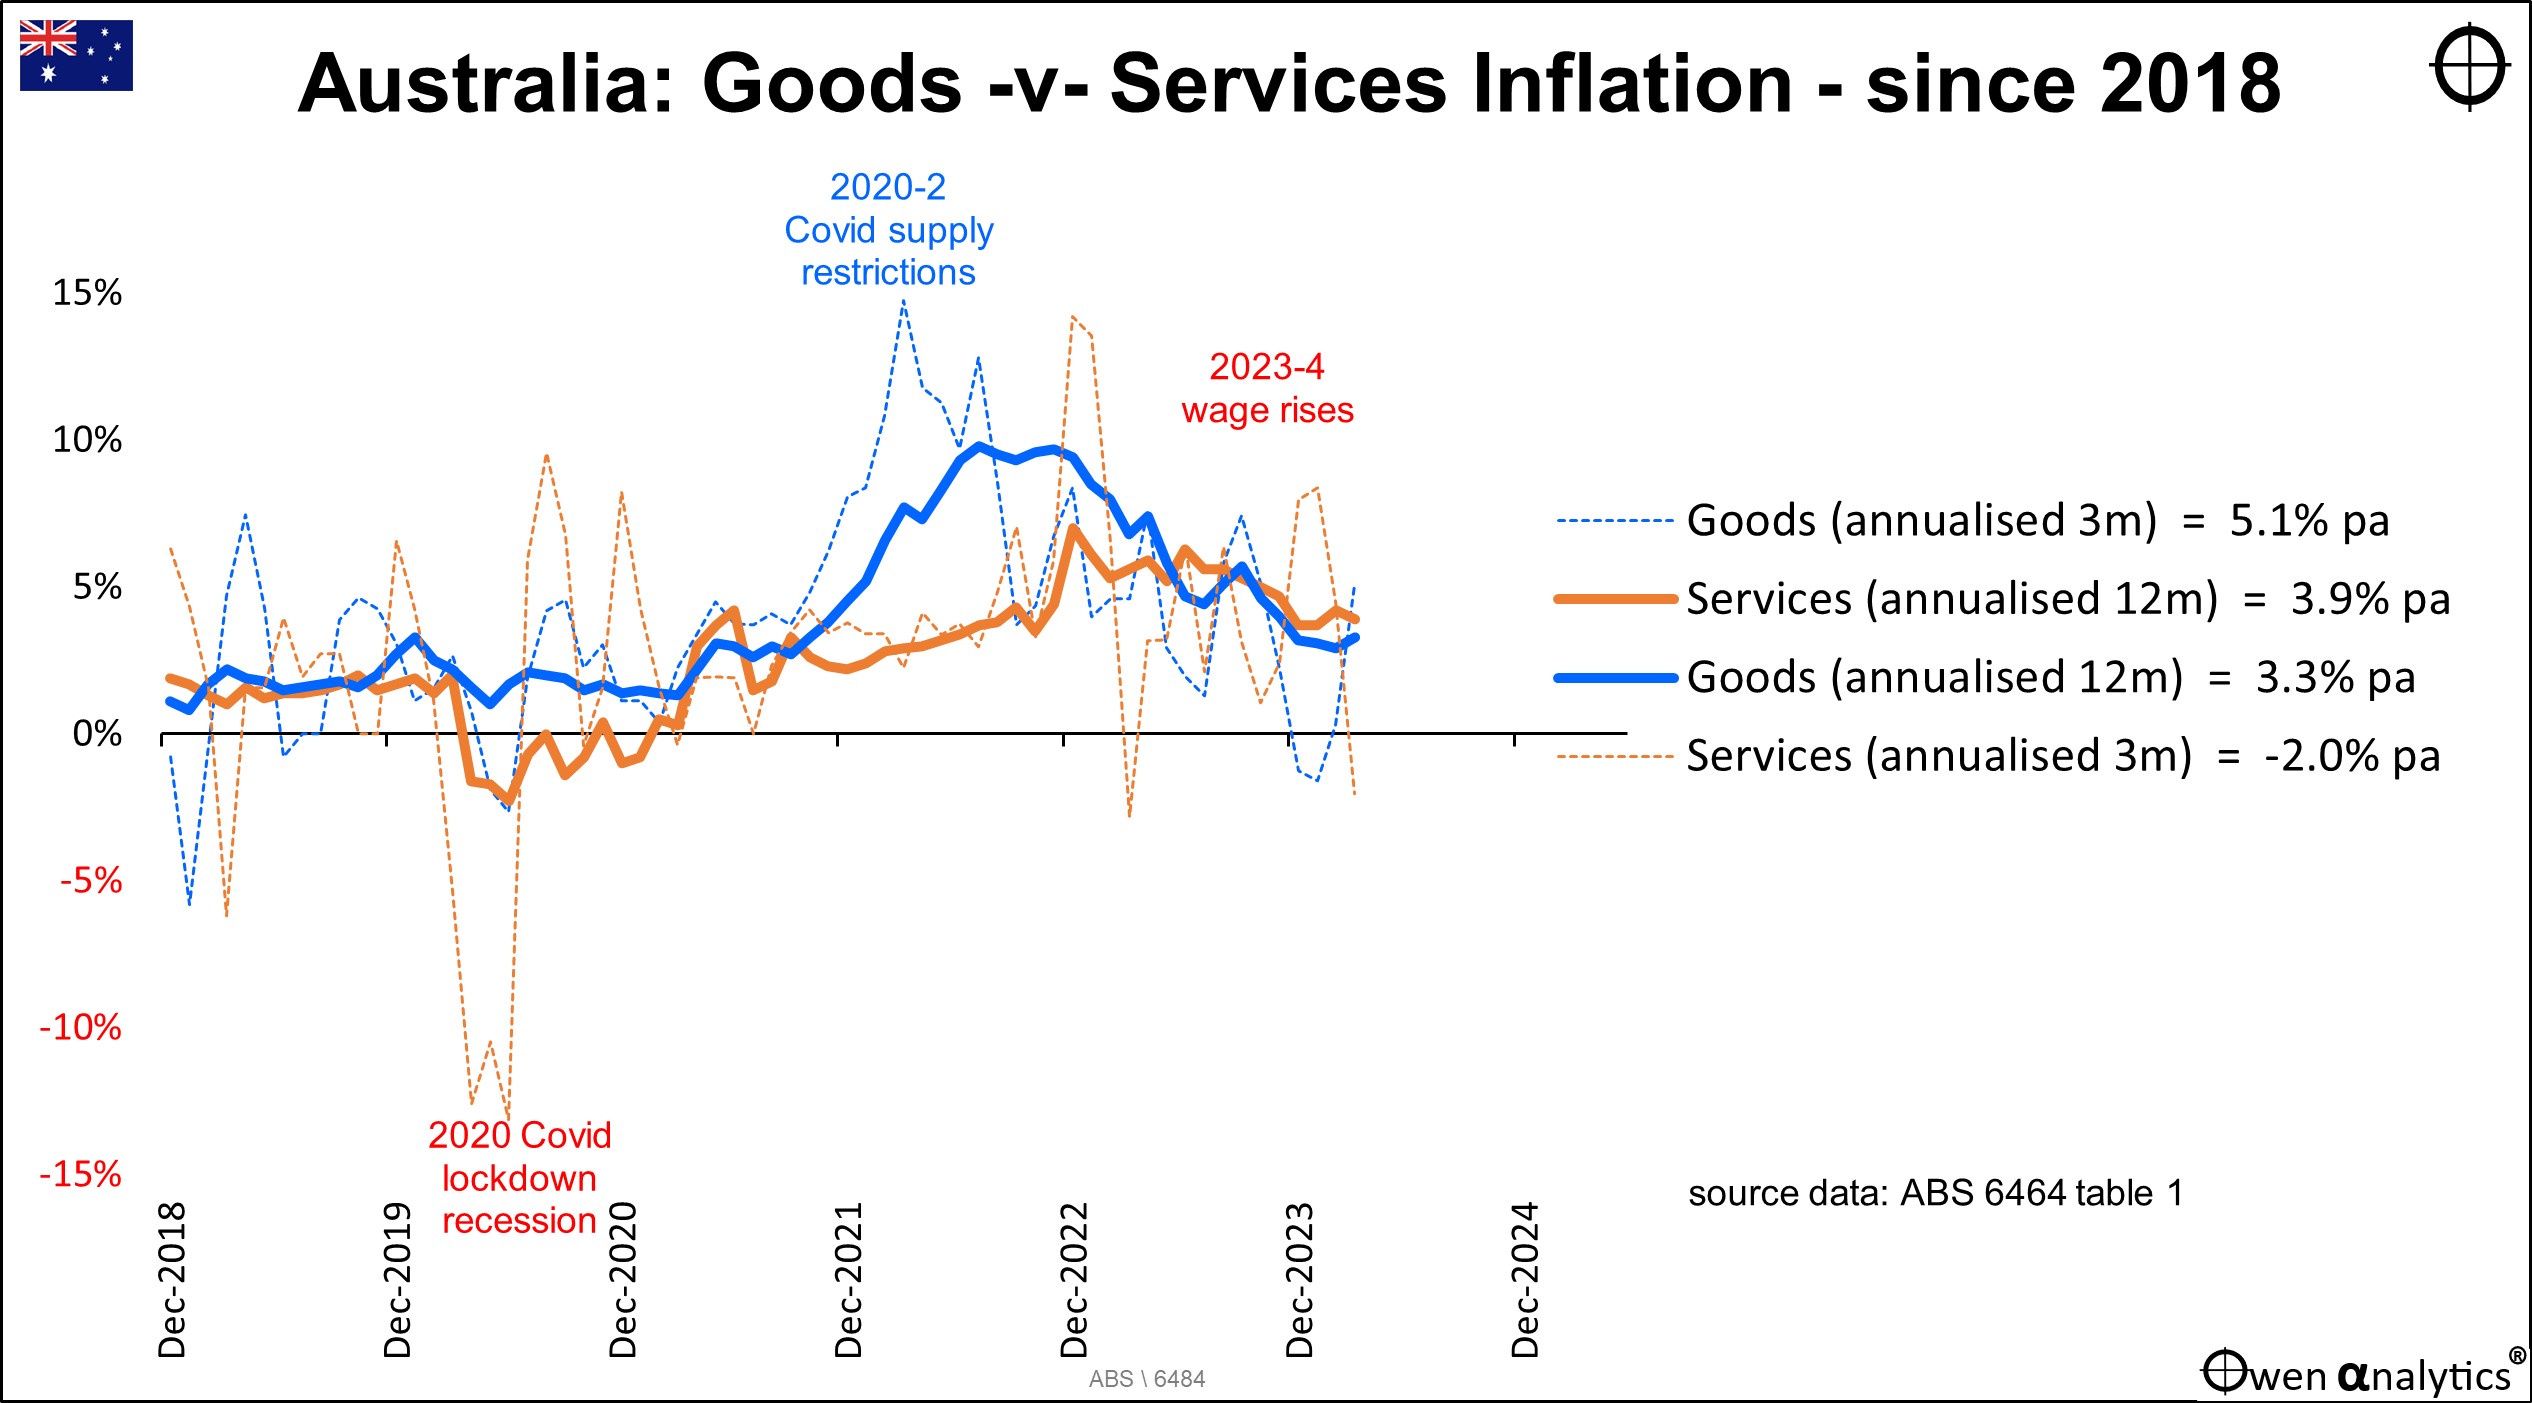
Goods inflation and services inflation in Australia were both running steady at around 2% pre-Covid. Then the Covid lockdown restrictions in 2020 hit global supply chains, sending goods inflation (blue) soaring above 10% during 2021-2. As supply chain restrictions eased over the past couple of years, goods inflation declined, but still remains at higher than target 3.3% pa.
Services inflation (orange) was sharply negative during Covid in 2020, then recovered in 2021-2, but is running at 3.9%, due largely to rising wages.
Services inflation is likely to remain high if jobs markets remain tight and governments and employers allow unions to win wage cases purely to chase rising living costs with no requirement for productivity gains.
On the other hand, there is more scope for goods inflation to fall back further toward target levels, despite governments’ best efforts to increase prices by trying to revive inefficient, non-competitive local manufacturing, propped up by tax-payer subsidies and protected by trade restrictions.
Fears of rising wages, zero productivity growth, rising protectionism, ballooning government spending, and signs of slowing US economic growth, are starting to re-ignite fears of the dreaded ‘stagflation’ – higher than target inflation plus slow growth.
Meanwhile, in the background are ongoing threats of rising military tensions in Europe, the Middle East, and East Asia.
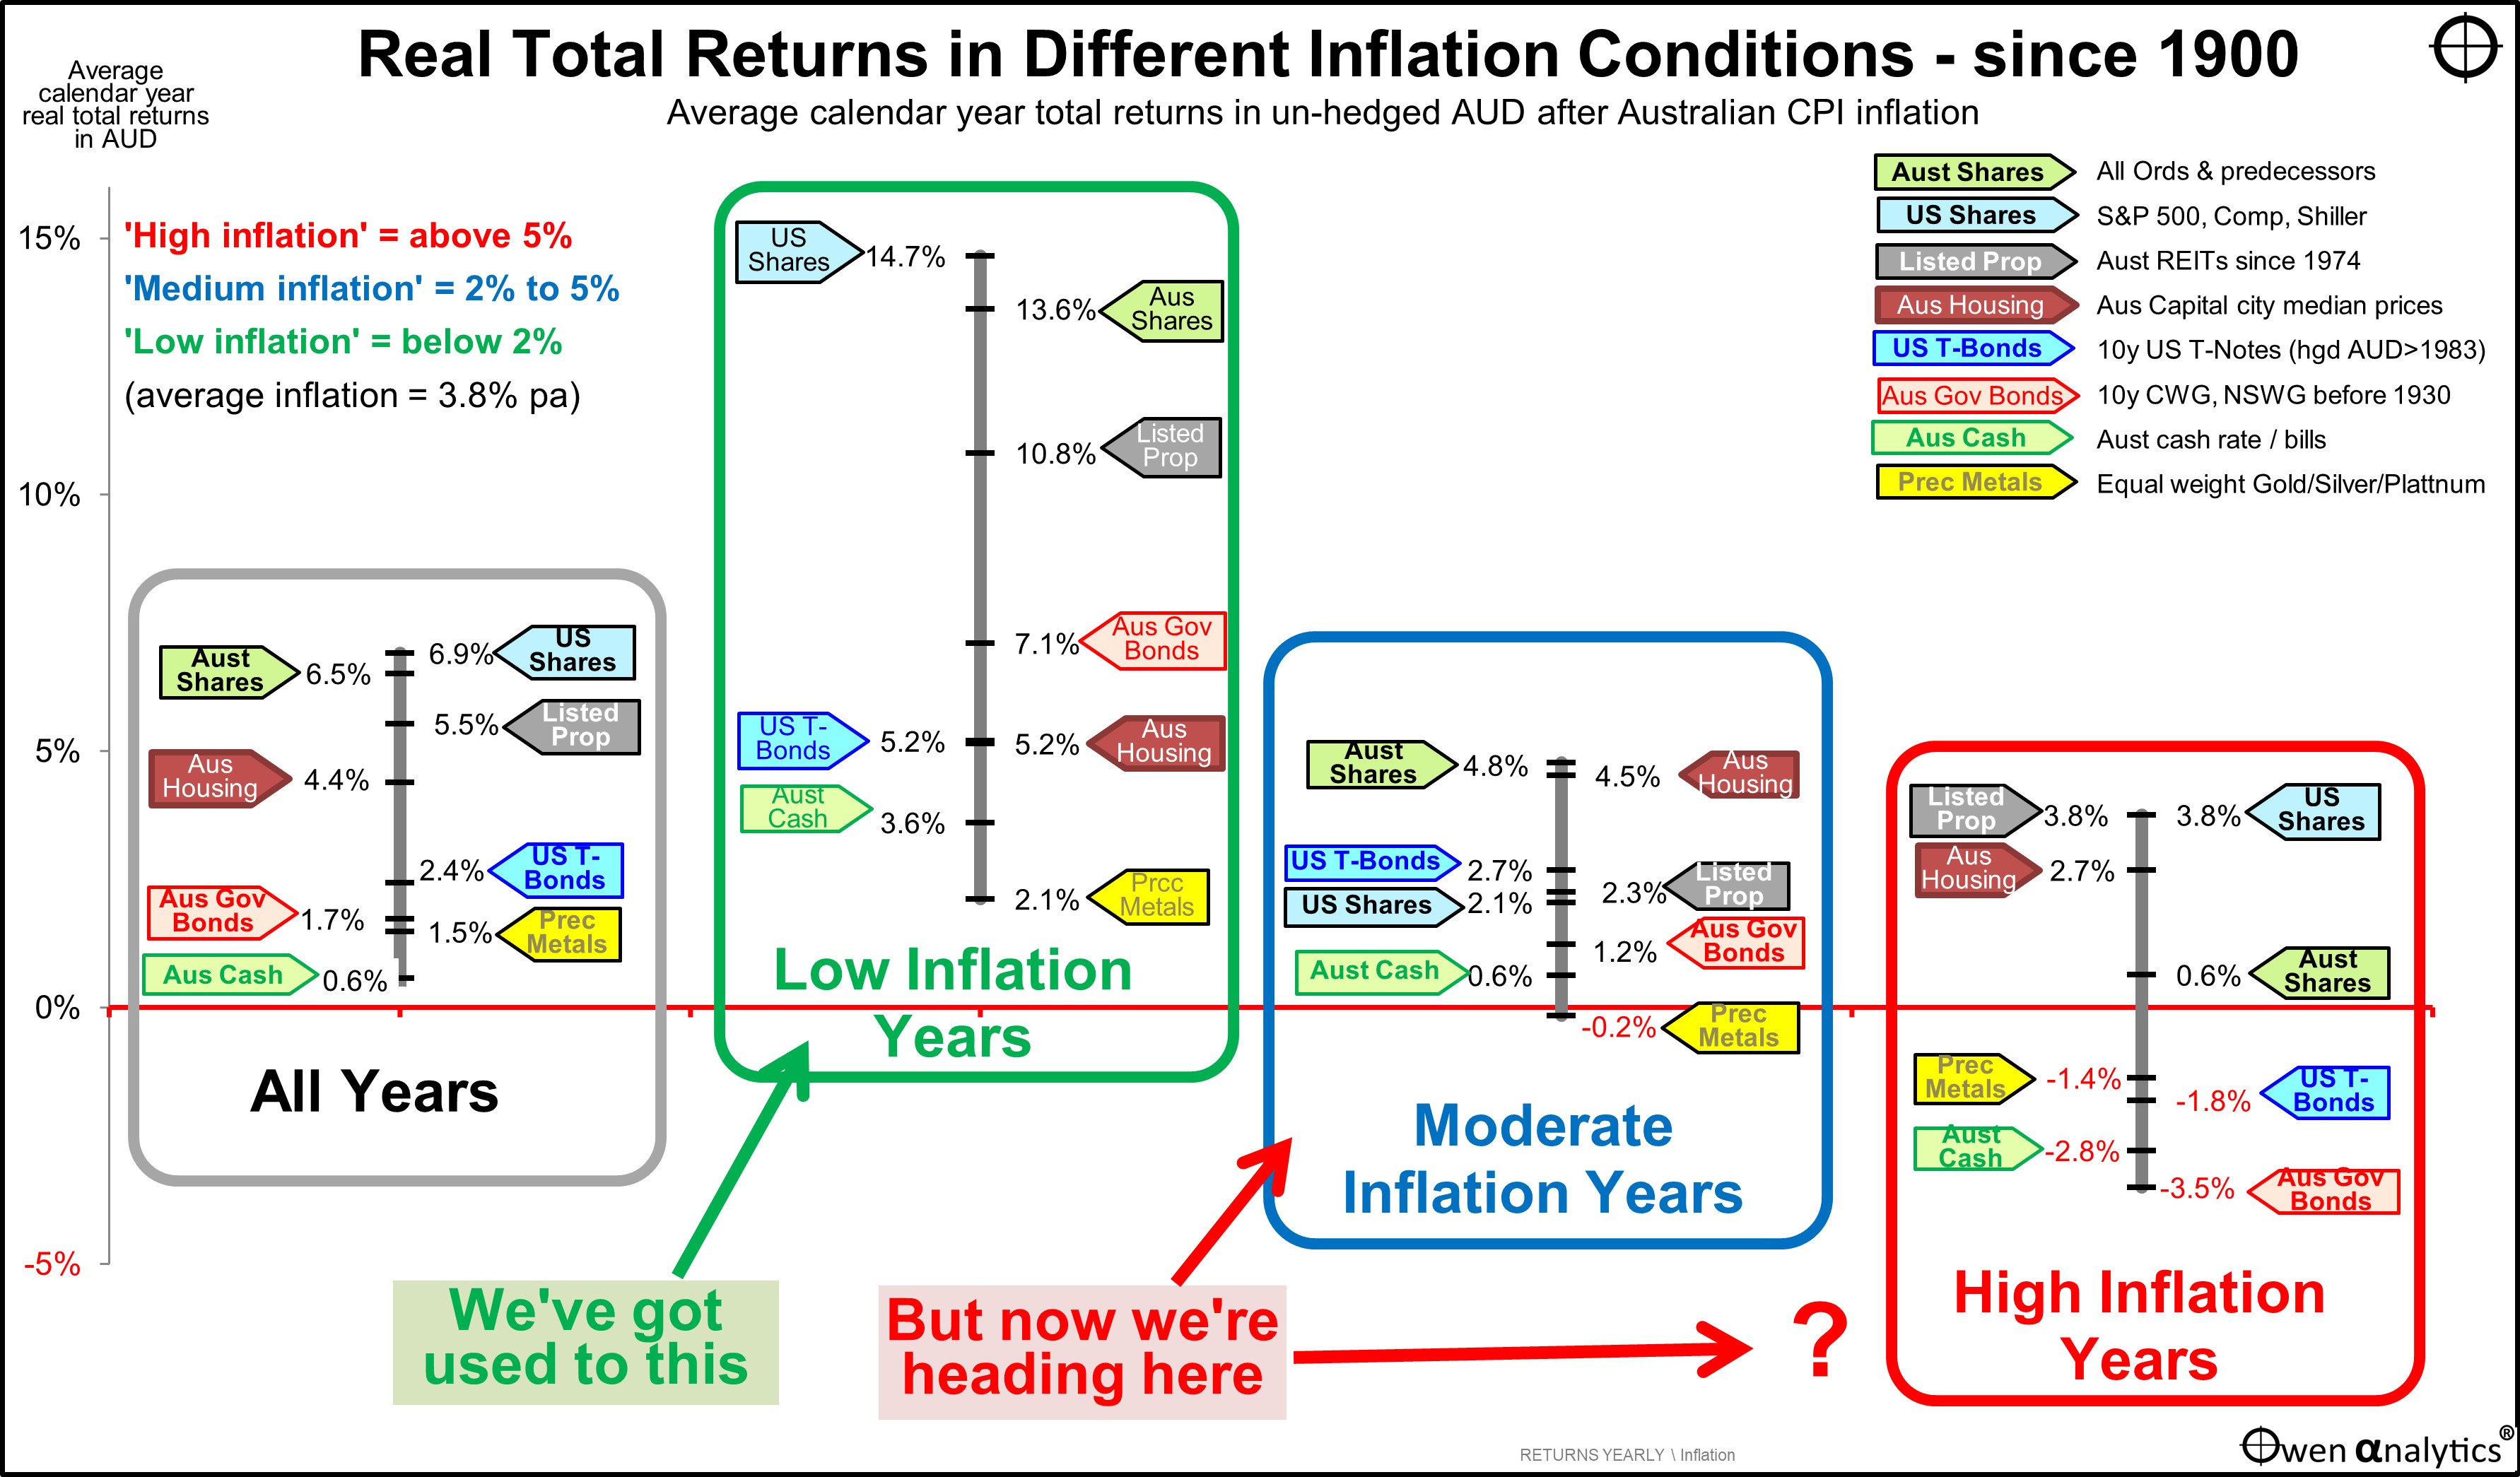
For the impacts of inflation on investment market returns see:
The Low Inflation era of great returns is over. Investing just got a whole lot harder! (16 Apr 2024)
Global shares lower
These fears combined to send global share markets lower in April. All sectors were lower except for fossil fuel producers and burners (‘Energy’ and ‘Utilities’ sectors respectively).
The left chart below shows the main global stocks in April. It is mostly a sea of red ink, apart from gold miners (eg Newmont) and fossil fuels. Of the so-called ‘Magnificent Seven’, only Alphabet/Google posted new highs during the month, but most were lower.
Tesla was also up a fraction, but is still less than half its late-2021 peak price. Tesla was once the hottest of hot tech stocks, but now is just a car maker. Toyota’s share price has doubled in the past 18 months (helped in no small way by the Bank of Japan trashing the Yen), while Tesla’s share price has halved.
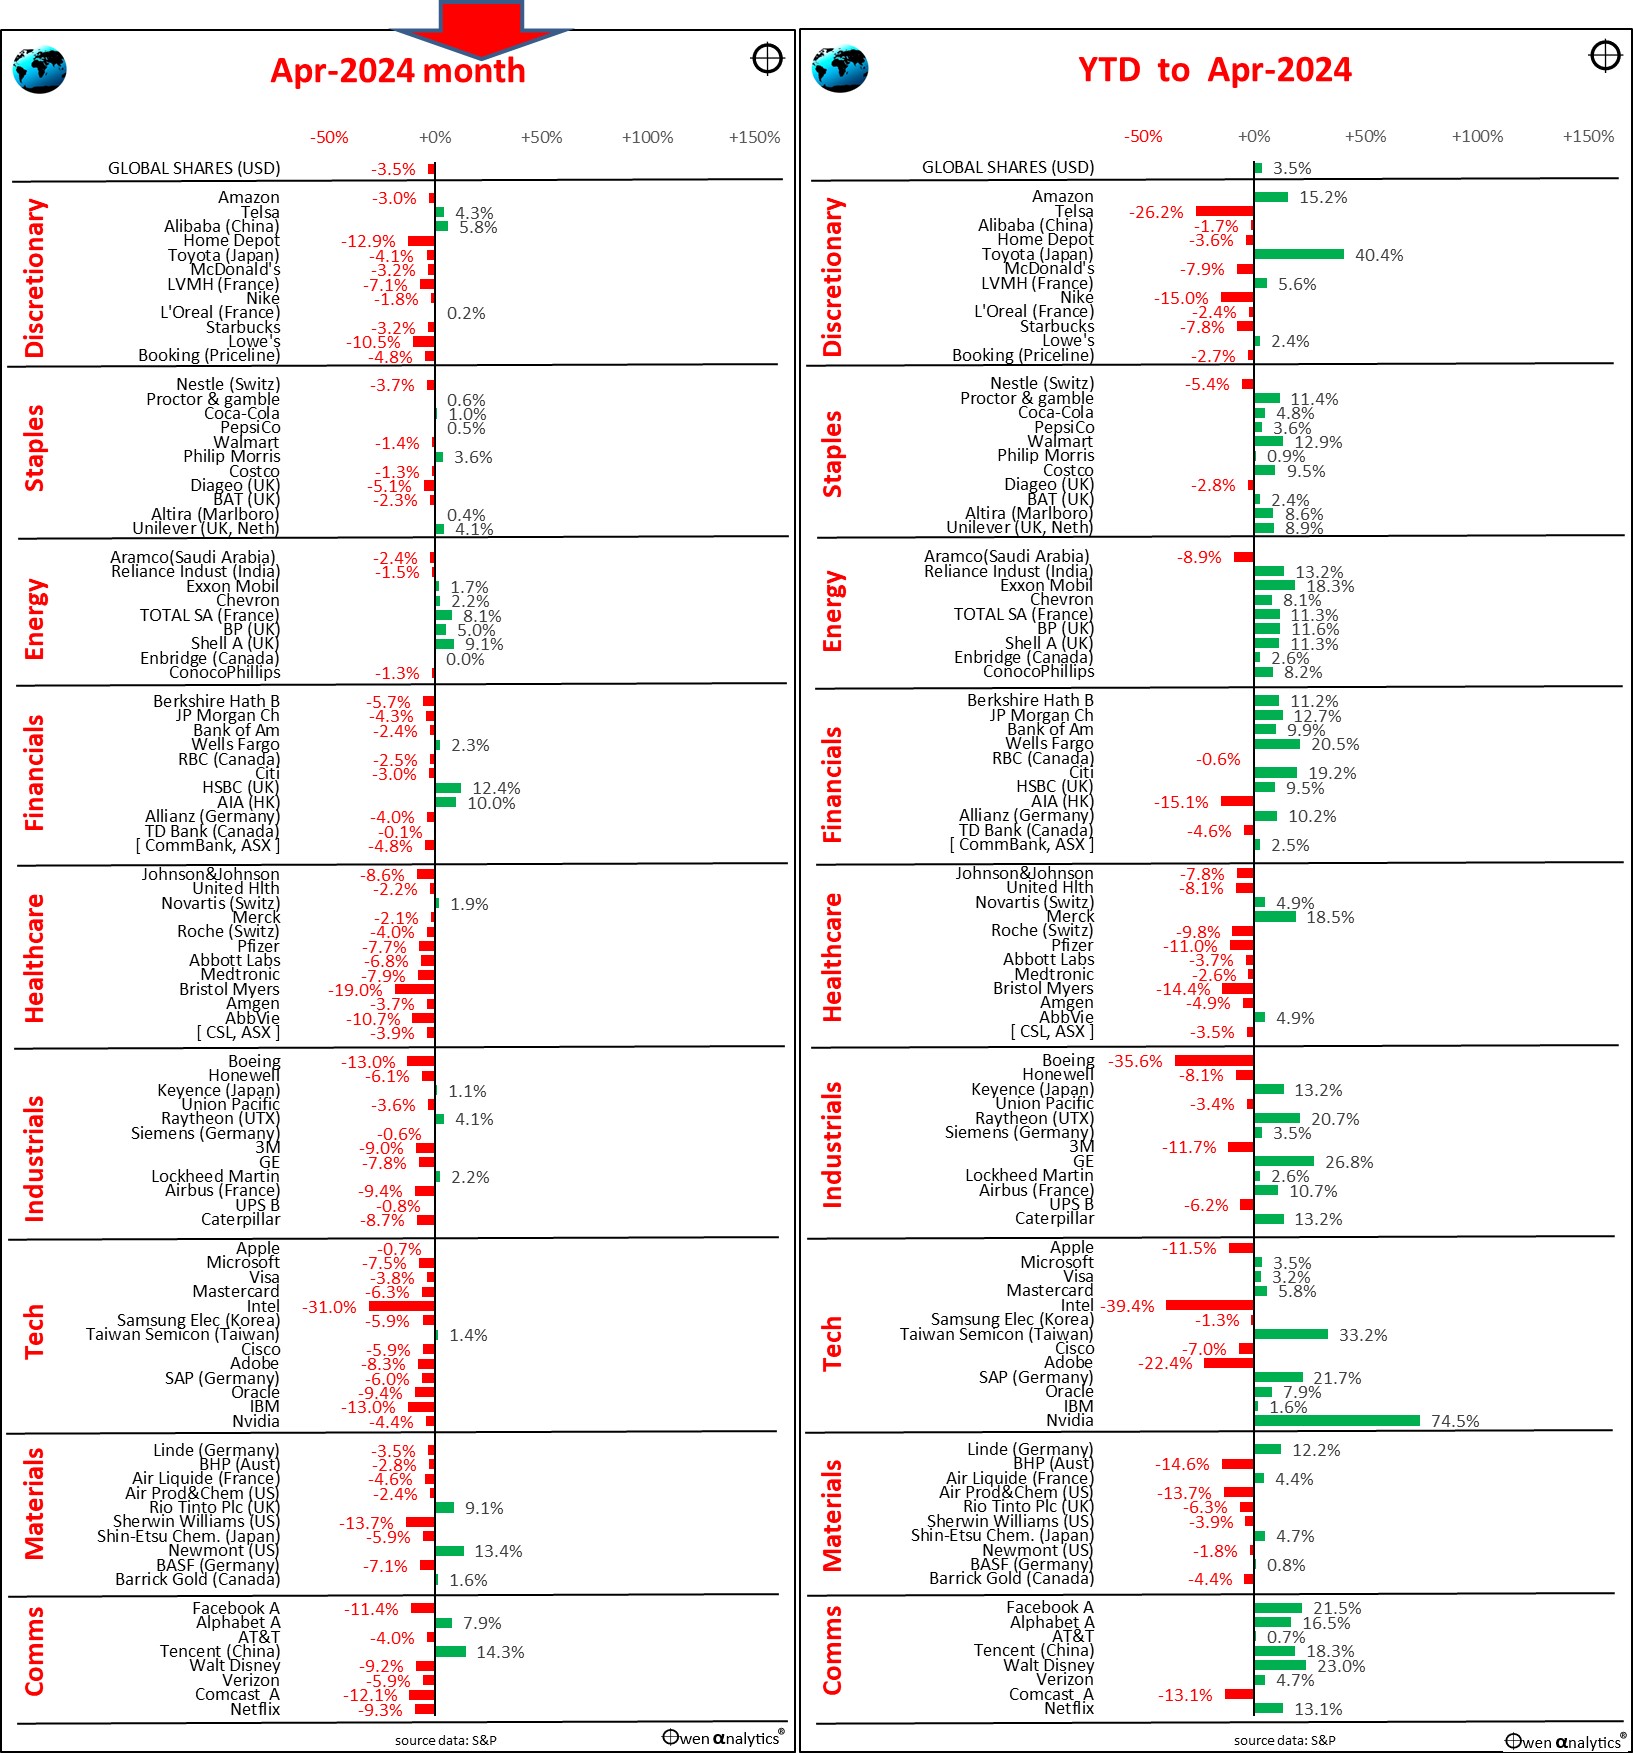
The right chart shows share prices for 2024 year-to-date. Most shares are still up this year (apart from healthcare), albeit more modestly than the very strong overall share market rises in 2023.
At a country level, the only major country share markets up in April were the UK (BP, Shell, RIO, HSBC, AstraZeneca), and Chinese and Hong Kong markets were also stronger, with signs of stimulus and possibly an end to the long slump in Chinese consumer confidence and spending.
Australian shares
Australian shares also followed the global trend down in April, with the All Ordinaries down -2.7%, ASX200 down -2.9%. The left chart below shows the main local stocks in April, and the right chart is 2024 year to date.
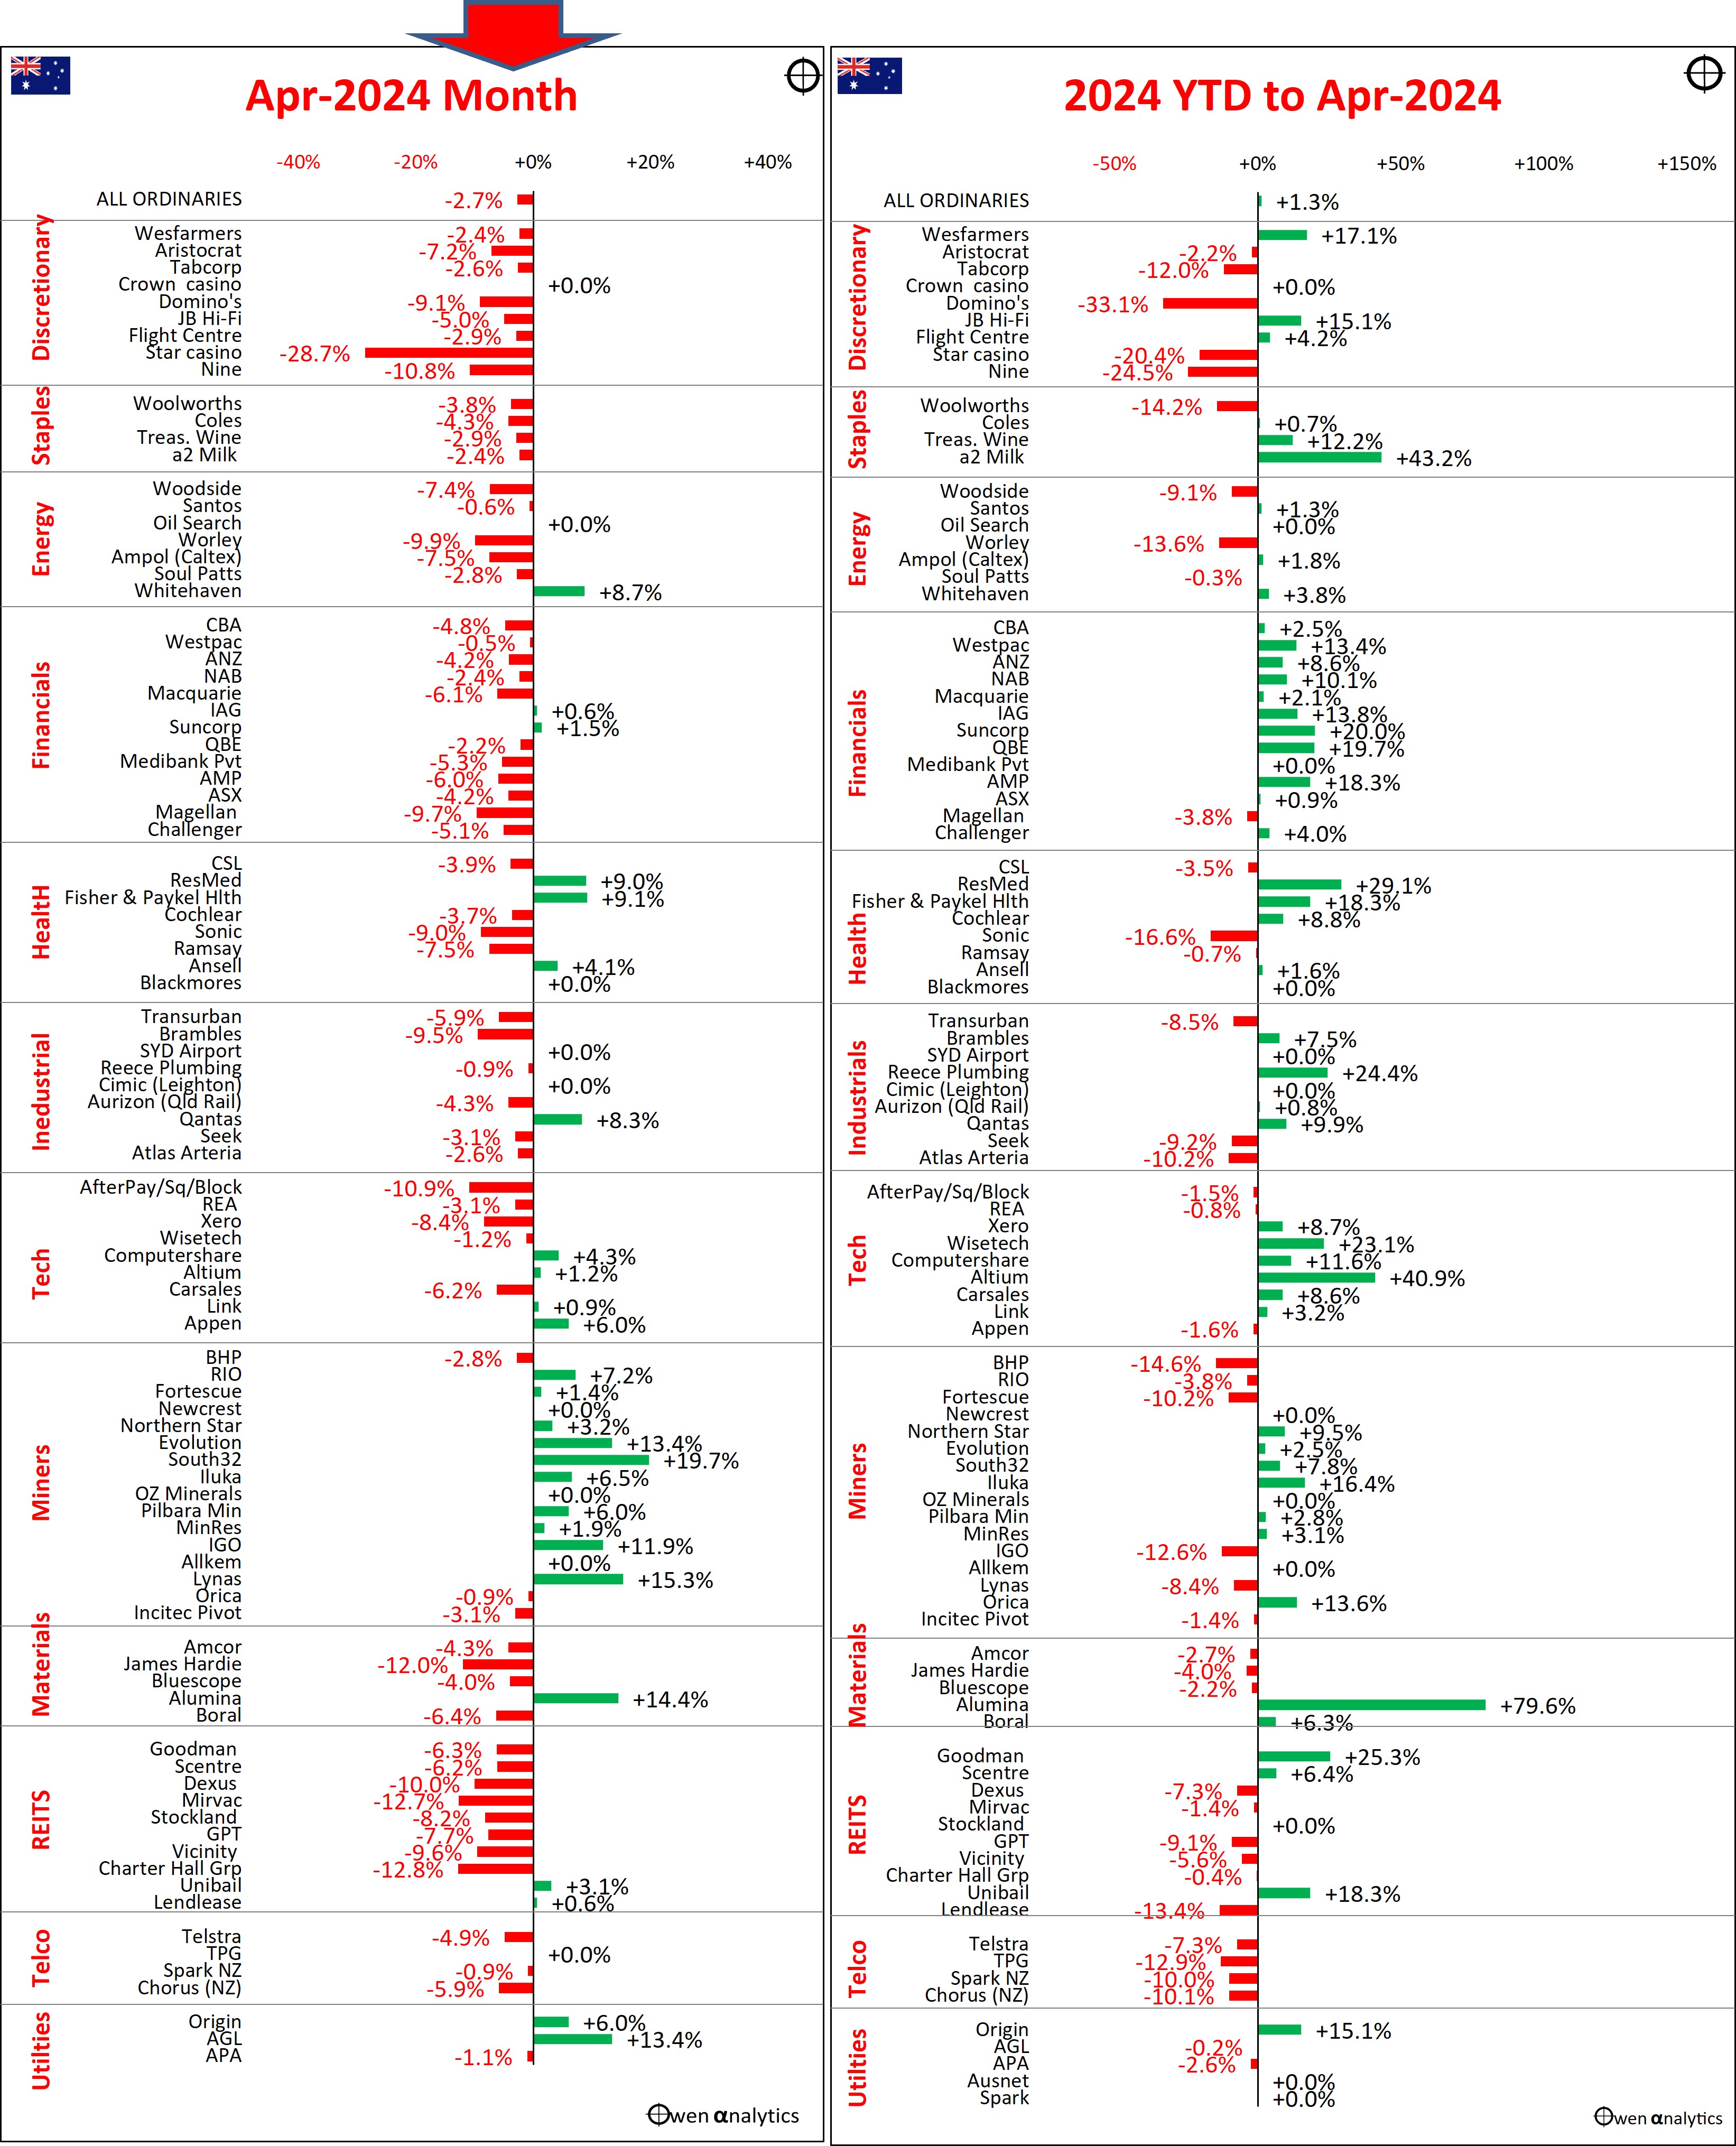
Just about the only green in the left chart (April) is the miners, boosted by higher prices for metals and fossil fuels. The big banks were the main drag on the overall market, led down by CBA (still vastly over-priced), and Macquarie (slower global deal flow). A-REITs (listed property trusts) were also down heavily with rising bond yields.
Commodities
Iron ore prices gained 15% in April for the first positive month this year, with some more tentative steps toward stimulus in China, plus continuing demand for steel in the on-going military build-up.
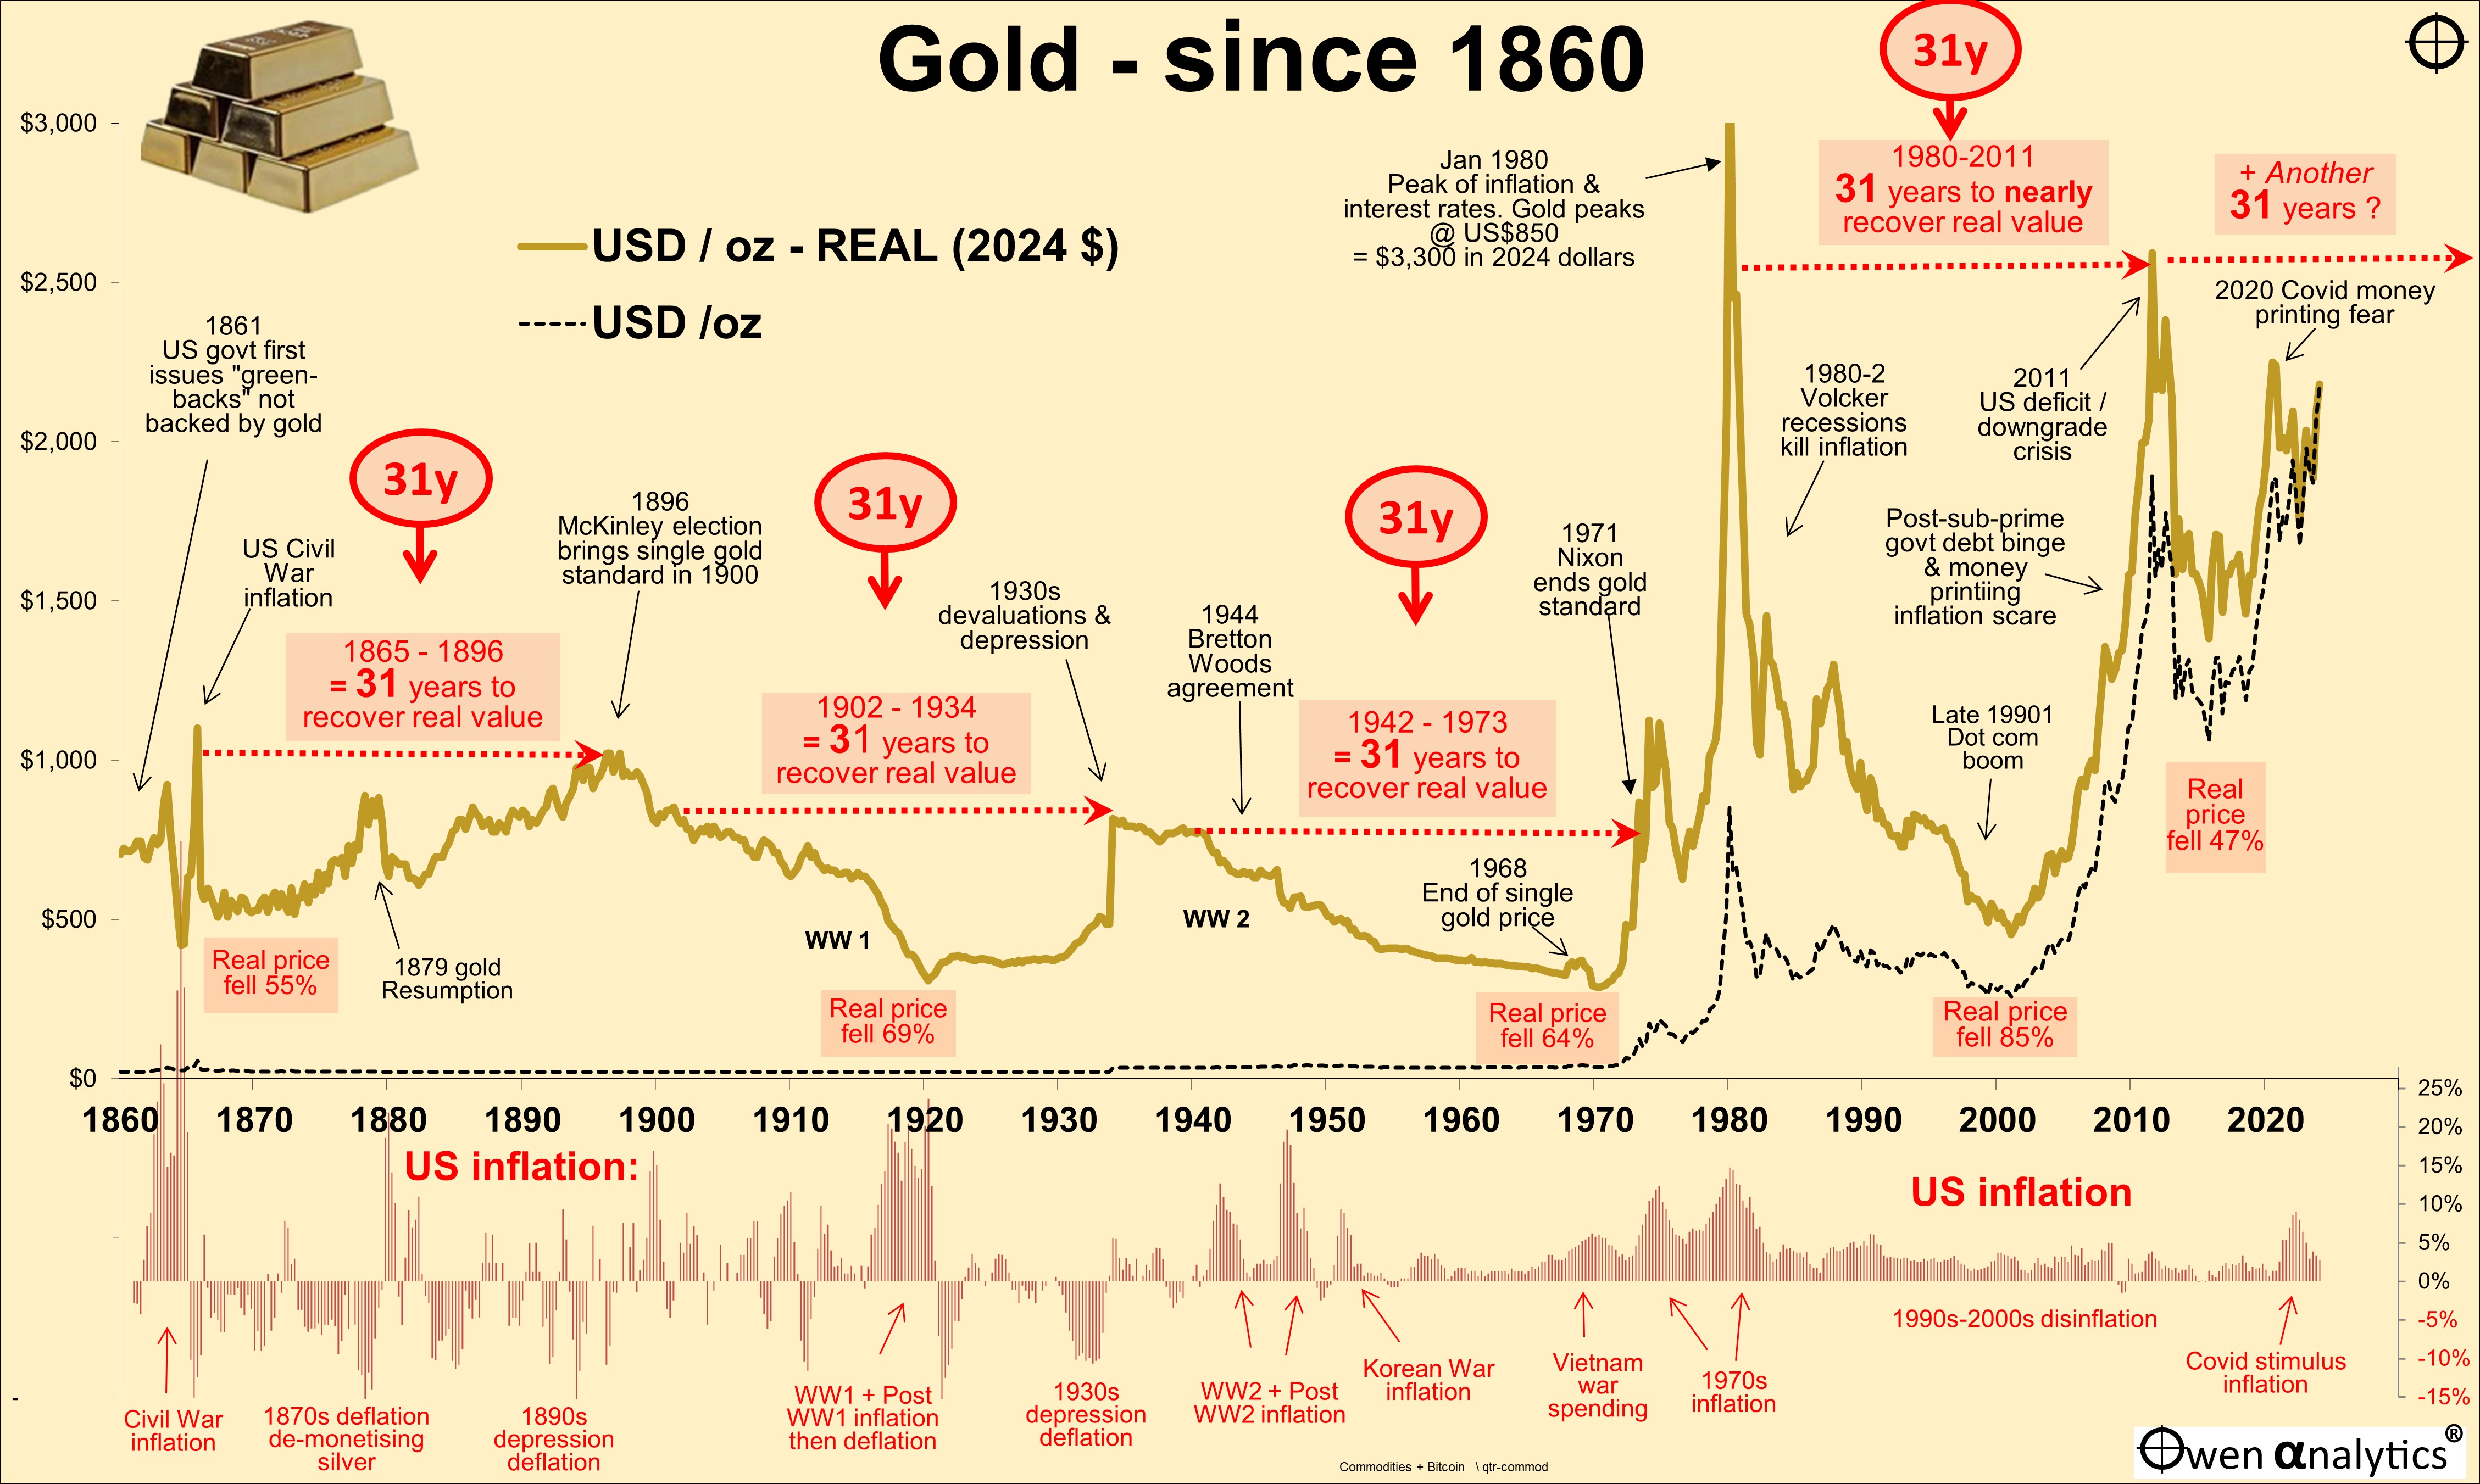
Gold was up another 4% on strong buying, mainly from Chinese nationals (diversifying away from the ailing property market), and central banks (mainly non-NATO governments diversifying away from the US dollar assets, to avoid a repeat of the US seizing Russia’s dollar assets after it invaded Ukraine).
See also: Gold: Curious case of the '31-year itch'? (15 Mar 2024)
Natural gas and coal prices were also stronger in April, but oil ended flat. Battery metals prices were also up a little after their recent slide caused by over production and weak global EV sales. Copper, nickel, and even lithium was up a little more after its -80% price collapse in 2023.
Bonds
Bond markets had another shocker in April as prices fell, lifting yields across all maturities in all major markets. Rises in yields at the short end reflect diminishing hopes of imminent rate cuts from central banks (and even now some talk of more rate hikes!). Rises in yields at the long ended reflect diminishing hopes of inflation falling back to target (or inflation and cash rates ‘higher for longer’).
I’m not sure why people still pile into government bonds as a so-called ‘defensive asset’. I guess they are just following academic finance textbooks that tell us that that long-term portfolios (eg pension funds) should be stacked with ‘risk-free’ bonds.
The problem is that finance textbooks were all written in the past 30 years when declining inflation and interest rates boosted bond returns as rates fell. That era is over, so finance textbooks written in the last 30 years will need to be re-written. (A good reminder that finance theory is subject to fads just as much as fashion!)
However, government bonds do have a narrow and specific role in diversified portfolios as a very short-term defensive play leading into economic recessions and slowdowns. The problem is that you need to get the timing right for both the entry and the exit, especially getting out of bonds in the middle of recessions before inflation rebound expectations return, which is usually very sudden.
I have done it in several recent cycles going back to the GFC, but I have found that dragging advisers and clients out of the 'safety' and great returns from government bonds in the first half of recessions, and back into beaten down 'risky' shares in the middle of recessions when there is blood in the streets and bankruptcies filling the media headlines, is extremely difficult.
Credit
In credit markets, credit spreads tightened even further in April, resulting in corporate bonds posting slightly less negative returns in April than government bonds. However, with credit spreads at very tight (thin) levels, there is no buffer for even the slightest hint of recession.
Exchange rates
The US dollar almost always rises as a ‘safe haven’ in broad global share sell-offs. It played this role in the April sell-off, rising against all major currencies, especially the collapsing Yen.
As a ‘risk’ currency, the Aussie dollar almost always falls in broad global sell-offs (if you can call April a 'sell-off'), but in April it was flat against the USD due mainly to rising metals prices.
Looking ahead – is this the start of the ‘big correction?’
The most common question I have received in recent weeks has been: ‘Is this the start of the big correction?’ My answer has been: ‘Probably not yet’.
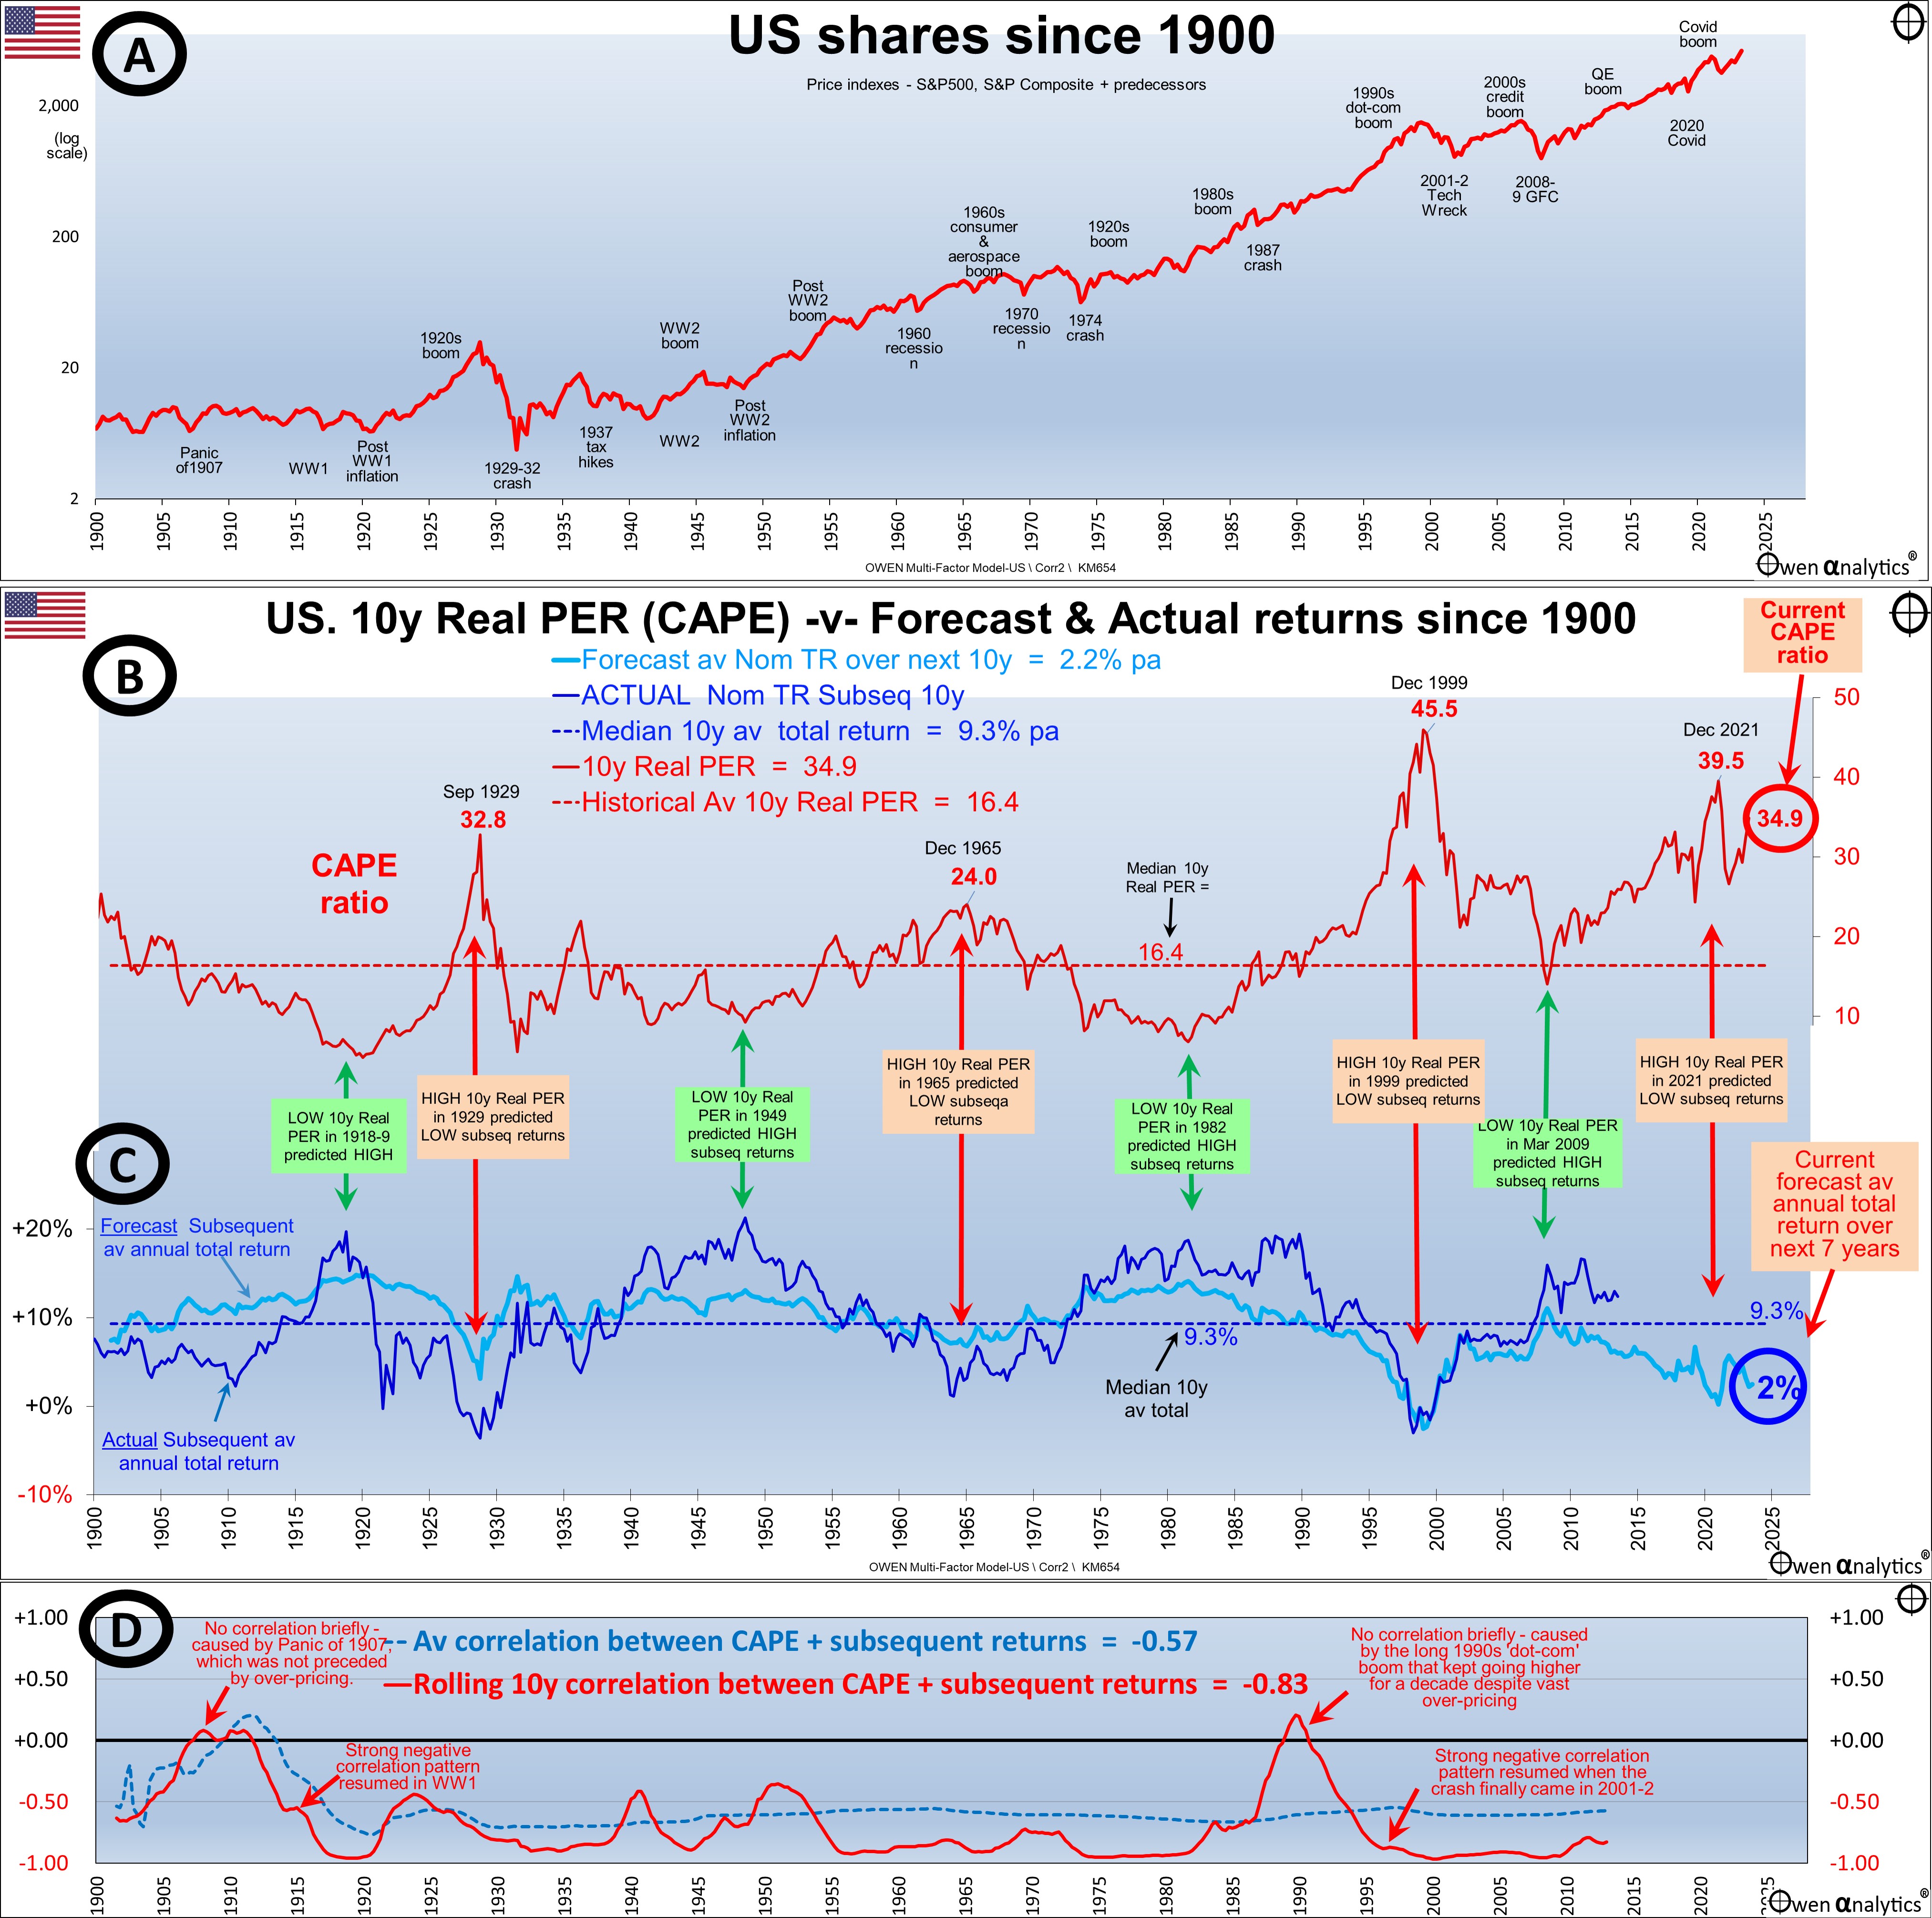
Yes, share markets are down a little (although a 4% or 5% decline is not even a minor hiccup), and yes they are still significantly over-priced on a variety of measures (mainly driven by the US tech/online/‘Ai’ giants, but many smaller markets including Australia are also significantly over-priced).
See for example:
· US Shares: 'double-whammy' of over-pricing, but how serious is it? (27 Mar 2024)
· US shares vastly over-priced and primed to fall – but what will be the trigger? (US ‘CAPE’ ratio update) (22 April 2024)
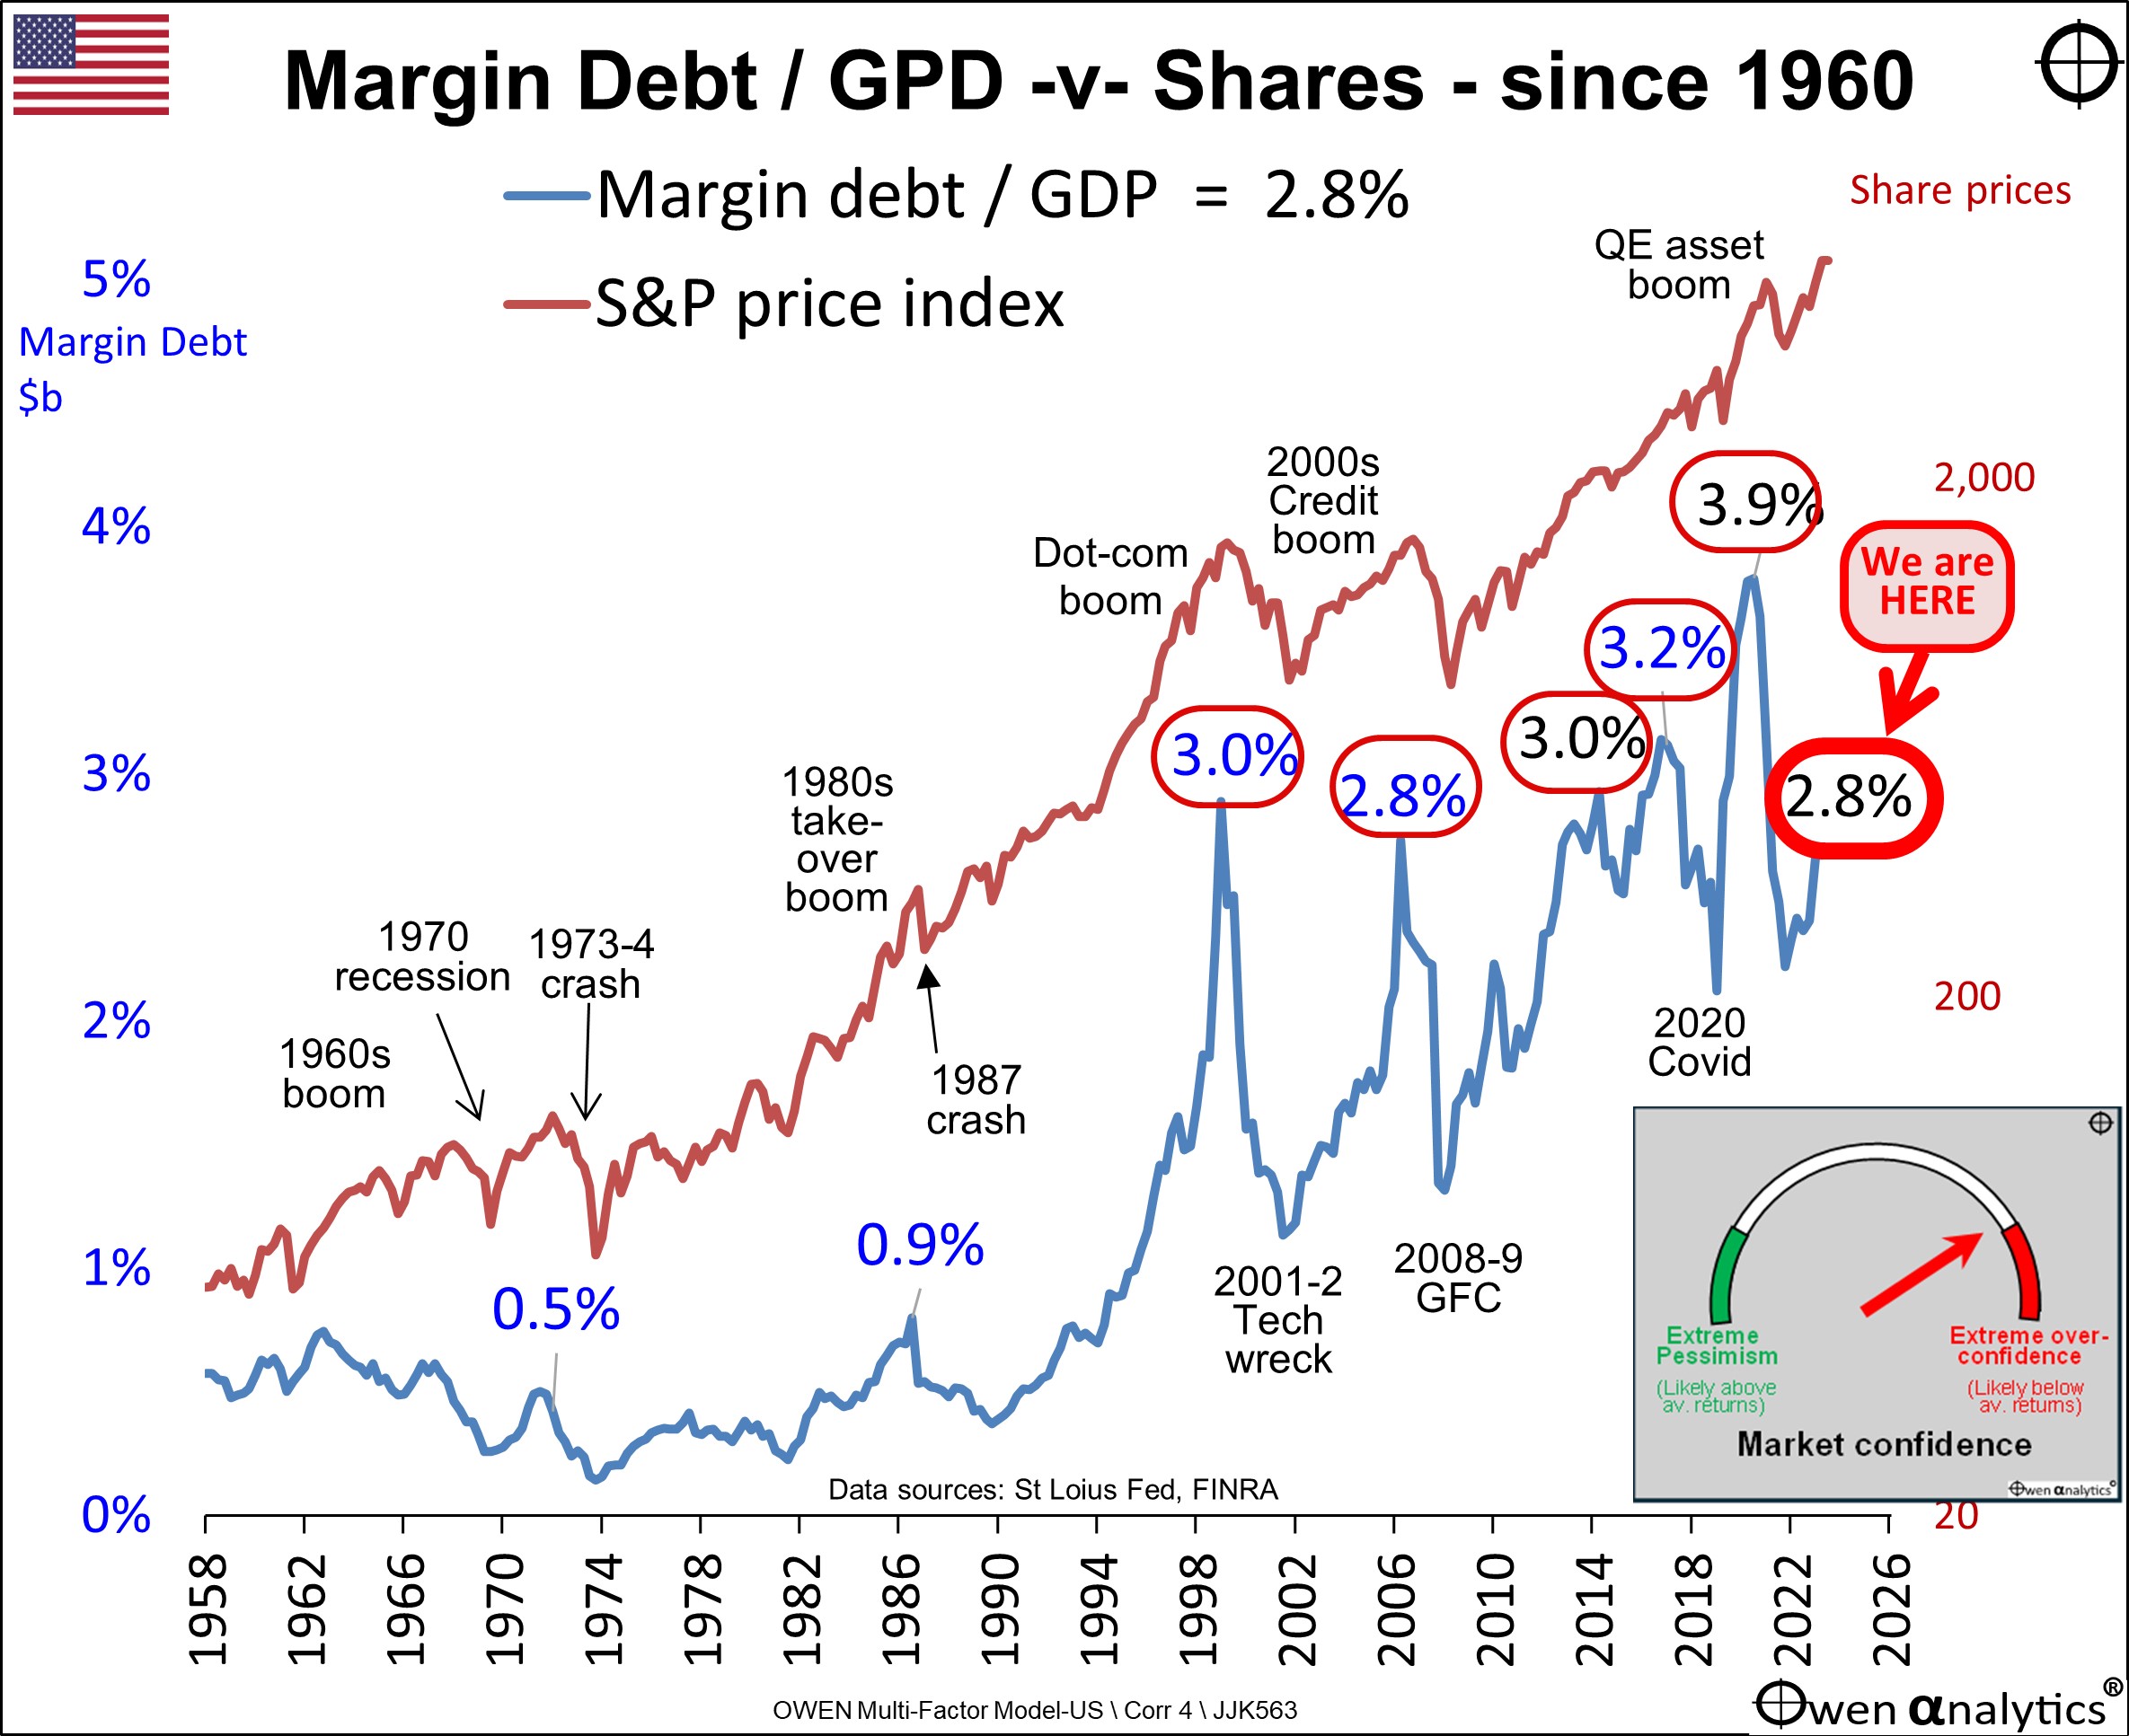
· Margin Lending boom-bust signal of share market over-confidence: Not flashing red yet (28 April 2024)
However, the realisation that inflation and interest rates are not going to be coming down as quickly as hoped, is likely to take some fluff out of pricing – say 10-20%, but that realisation is probably not enough to start the big correction, which would require the US share market aggregate to come down by say 40-50% for it to be ‘fair value’.
That would require a major trigger – something like:
- A major escalation of the war in the Middle East - eg Iran (backed by Russia/China) -v- Israel (backed by US/NATO). We have seen a few different varieties in recent decades – including the 1956 Suez Crisis, the 1967 Six Day War, the 1973 Yom Kippur War, the 1979 Iranian revolution/hostage crisis.
- A major escalation of the Russia/Ukraine war – eg US troops on the ground in Ukraine, or Russia resorting to the nuclear option.
- China using the current diversions in Ukraine and the Middle East to invade Taiwan.
Let’s look at what triggered the last two ‘big corrections’ in US/global share markets:
2001-2 ‘tech wreck’
(S&P500 down -46%, NASDAQ down -78%, ASX All Ords down -22%)
The trigger was the Fed hiking rates to 6.5% in May 2000, and dire warnings of countless profitless ‘dot-coms’ running out of cash, together with other contributing events like Microsoft losing an anti-trust case for abuse of monopoly power, and the Enron, WorldCom and Global Crossing bankruptcies revealing massive accounting frauds.
The Australian share market was also down, but 'just' -22%, because we didn't have a large tech sector bask then (or now). Believe it or not, our two largest tech bubble stocks in the 'dot-com boom' were Telstra and News Corp (!). Both are still a fraction of their peak 'dot-com' boom prices.
This time around the Fed is unlikely to hike rates far above the current 5.5%, and the big ‘bubble’ stocks like Nvidia, Meta, Amazon, Apple, Microsoft, etc are posting enormous cash profits. Note, however, than most of the ‘Mag-7’ would still not be good value at half the price.
Alas, accounting fraud will always be with us, so there will be a good assortment of examples to keep us entertained in the next bust.
2008-9 GFC
(S&P500 down -57%, NASDAQ down -56%, ASX All Ords down -55%)
What triggered the 2008-9 GFC was a US mortgage securities/derivatives crisis that became a US/UK/European bank insolvency crisis, made worse by with inconsistent Fed bail-outs, and extreme inter-connectedness of banks globally, with their unknown holdings of securities with unknown values leading to bank runs.
The Australian share market fell by -55% despite Australia not having a housing crisis, or mortgage crisis, or bank insolvency crisis.
This time around, there is a looming crisis in US regional banks with their high levels of exposure to commercial real estate, but it is probably not enough to infect the broader US banking system, let alone the global banking system, as was the case in the GFC.
Where are we now?
My base case in prior editions of this report over the past year has been the broad market rally based on the belief in imminent and deep rate cuts, was completely unwarranted, and that the rally will end when investors everywhere finally come to realise that inflation is going to remain stubbornly above target levels and that central banks are not going to make the rapid, deep, and imminent rate cuts that investors were banking on.
This is all that is happening now, and it might take share prices back to where they were a year or so ago – say a fall of 15-20%, but that still leaves share markets in expensive territory and still vulnerable to the ‘big one’ when the trigger does arrive.
‘Till next time – happy investing!
Thank you for your time – please send me feedback and/or ideas for future editions!