Greetings fellow investors.
By far the most eagerly anticipated and talked about economic number is the ‘CPI inflation’ number. When it is announced each month it dominates media headlines and prompts fierce debate among the mindless media commentators and clueless, chattering bank economists over whether the Reserve Bank will hike or cut interest rates.
But how does CPI (Consumer Price Index) inflation relate to investment strategy and retirement planning?
Will ‘inflation-indexing’ your investments be enough to cover your expenses?
Most long-term pension/retirement funds target long-term returns at a specified margin above CPI inflation. Almost all Big Super funds in Australia (including Industry, Corporate and Retail funds, and even the Future Fund) set a ‘CPI+’ target in their long-term return objectives.
A very common long-term return target for pension funds in Australia and around the world is ‘CPI+4%’. Why 4% above inflation?
Because if a fund posts returns averaging CPI+4% it theoretically allows for withdrawals of 4% of the balance each year, leaving the balance after withdrawals to keep growing for CPI inflation, so that the fund, and future withdrawals, keep pace with inflation and do not lose ‘real’ purchasing power over time (This is known as the ‘4% rule’). (It is no accident that initial minimum withdrawal rate for Super funds in Pension mode in Australia is set by legislation at 4%).
What is your own spending inflation rate?
All of this is fine if your expenses are rising at the national average CPI inflation rate, but what if the prices of things you spend money on rise by more (or less) than national average CPI inflation rate?
‘Inflation-indexed’ investments and retirement income products (eg ‘inflation-linked’ bonds, and ‘inflation-indexed’ annuities) are indexed to CPI inflation, but that might not be enough to cover the rising costs in your own spending budget.
If your expenses are rising by more than the published national CPI inflation rate, then you will need more investment capital per dollar of spending – ie you can afford to spend less of your capital each year (eg less than the theoretical 4%) if you want to keep the balance growing in future to cover your expense inflation. Ie if your expense inflation is more than CPI, if you withdraw the required 4% each year, your fund and future withdrawals will not keep pace with your expense inflation. Your standard of living will decline, and/or you will run out of money sooner than you expect.
Conversely, if your own expense inflation is lower than CPI, and is likely to remain lower indefinitely, then that provides a layer of added confidence that that your ‘CPI+’ investment strategy will be able to maintain your living standards in future, and reduce your risk of running out of money.
(Note there are many other factors in long-term retirement planning, including allowances for rising health-care and medical costs in later years, unforeseen lump sums required for nursing homes, divorce, bailing out family in trouble, etc, etc).
Inflation is different for different types of households
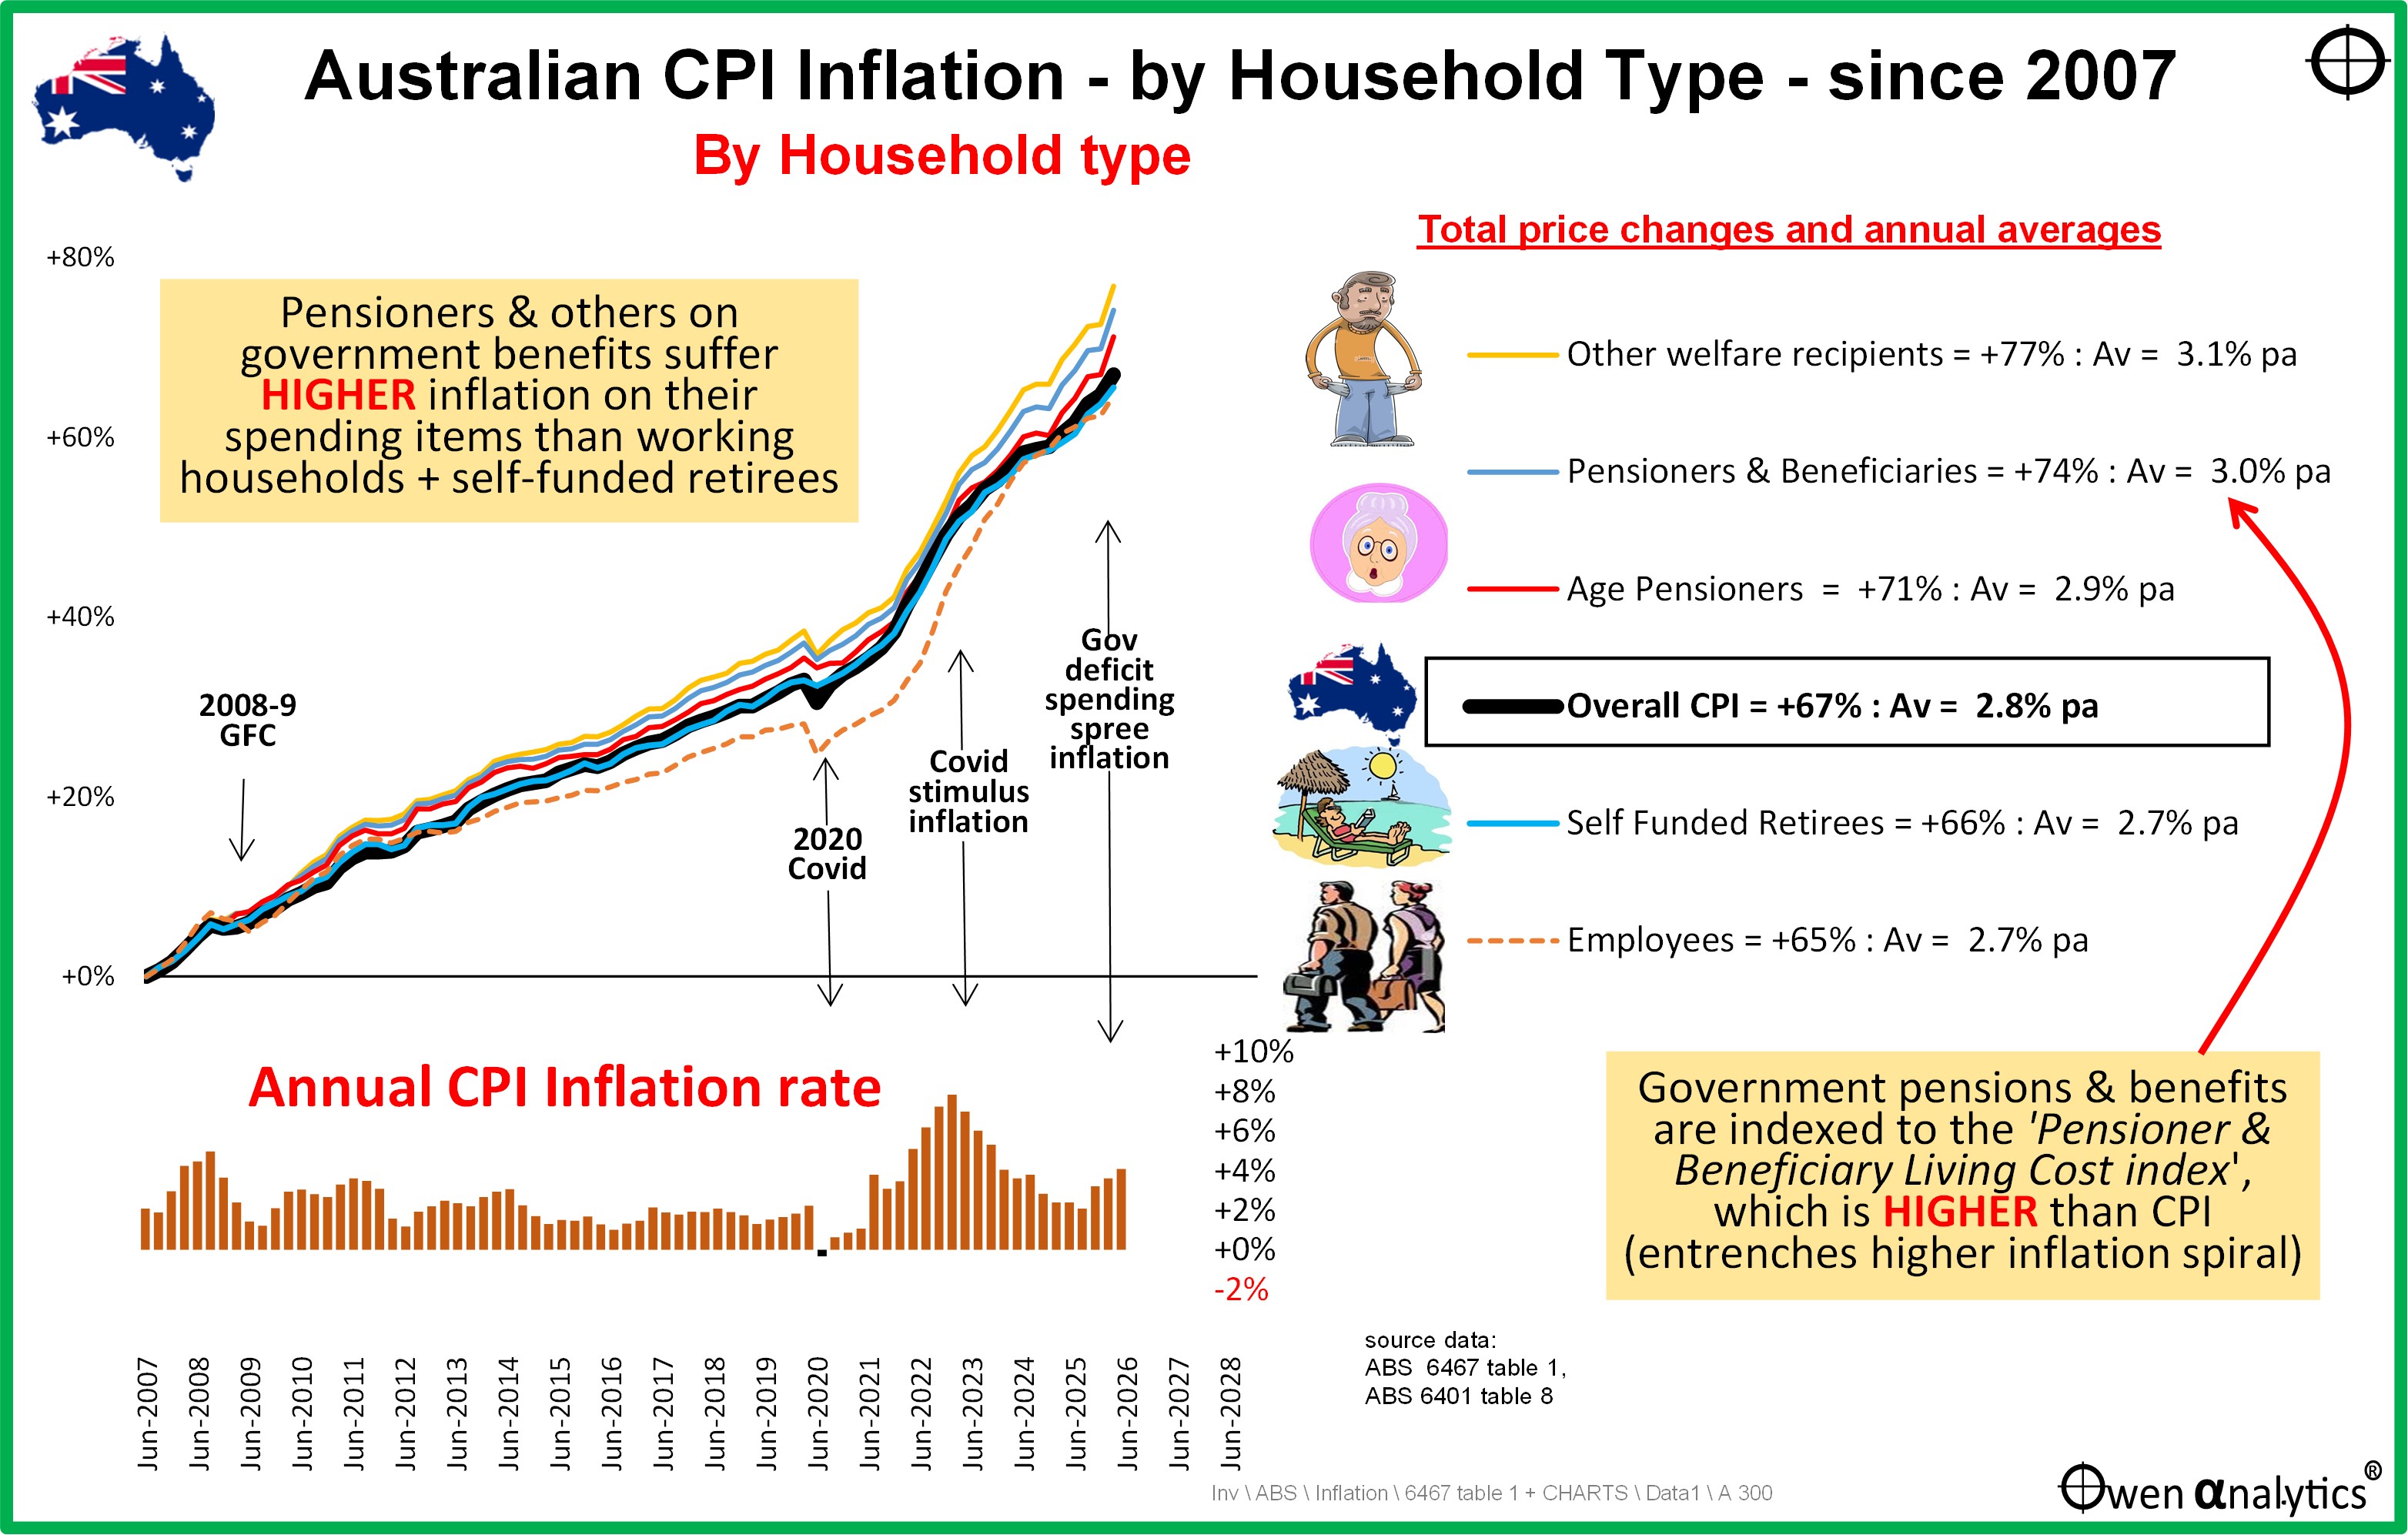
Today’s chart shows average inflation rates in Australia since 2007 for different types of households. Overall national CPI inflation averaged 2.8% per year, but inflation differs for different types of households because they tend to have different spending patterns.
The inflation pyramid is something that you want to be at the BOTTOM of (with the LOWEST expense inflation), not the TOP (with the HIGHEST expense inflation).
At the bottom of the inflation pyramid, working households (’employees’) have the lowest overall inflation rate, BELOW the overall national average CPI inflation rate. However, note how this gap has narrowed somewhat in recent years largely due to higher utility costs (electricity, gas, etc).
Next are self-funded retirees, with higher average expense inflation than working households, but still LOWER than the overall national CPI inflation rate.
Government age pensions on average suffer inflation ABOVE the national average CPI inflation rate.
At the top of the inflation pyramid suffering the HIGHEST average inflation rates are recipients of government welfare other than aged pensioners.
Inflation rates above CPI (for government welfare recipients including aged pensioners) are largely because a larger share of their spending budget goes on essentials items with higher inflation (including food, electricity, gas, rent, health-care) and they spend less on discretionary items with lower inflation (imports from low-wage countries - eg cars, appliances, phones, computers, furniture).
Inflation spiral
The ‘good news’ (on the surface anyway) is that government welfare payments, including age pensions, are indexed at the ‘Pensioner and Beneficiary Living Cost Index’ (PBLCI), or CPI, whichever is HIGHER. The PBLCI is generally higher than CPI inflation (illustrated on the chart), so welfare recipients are theoretically covered for their higher living expense inflation, on average.
The downside of indexing government pensions and other welfare benefits to a price index that is generally HIGHER than CPI is that this entrenches the inflation spiral.
It is the same populist, but twisted logic used by state and federal governments with their free ‘cost of living relief’ hand-outs aimed at compensating voters for higher prices. These tax-payer funded hand-outs inevitably buy short-term votes, but they entrench higher inflation and higher interest rates for all of us, plus higher government debt which burdens future taxpayers.
Essentially, indexing welfare payments to an above-CPI index just fuels a self-fulfilling inflation spiral. This is not a trivial factor affecting just a few people, as two thirds of retirement age Australians are on a government age pension indexed to an above-CPI escalation index.
The power of compounding
These differences in annual inflation rates may appear small, but the power of compounding magnifies even very small annual differences into very large differences in wealth and living standards over long periods, like 30 years of retirement.
It is now tax season in Australia, an ideal time to get to know your own expense inflation and how it may change in the future.
Next I look at differences in inflation rates for different categories of spending, and what this means for retirement planning -
· What’s your personal inflation rate? And how it affects your investment strategy & retirement planning (14-Jul-2026)
Some further reading on inflation
‘Till next time – happy investing and stay healthy!
Visit my web site for hundreds of original articles on a wide range of topics for advisers, portfolio managers, and serious long-term investors.
https://www.owenanalytics.com.au/
-
- All completely free of charge. Free of conflicts. Free of ‘ai’.
- All original research and analysis.
- No ads, No marketing material, No sponsored material at all.
- Not ‘monetised’ in any way. No ‘revenue model’.
- Guaranteed No ‘hot stocks’, No ‘hot tips’.
- Newsletter cost-free and conflict-free.
- Guaranteed No ‘ai’. All human.
Enjoy!