Greetings fellow investors!
Here’s my quick wrap-up on global markets for serious long-term Aussie investors – including shares markets, interest rates, inflation, bonds, currencies, commodities, and more, including portfolio implications.
But first - my essential 1-page snapshot chart - covering Australian and US share markets, short and long-term interest rates, inflation, and the AUD/USD exchange rate. Regular readers will notice that this year I have dropped the first version (all on one chart) and now just have the second version (showing Australian and US inflation and interest rates separately in the lower sections) from now on.
It is my go-to chart that tells me what happened when and why, whenever answering queries from advisers, investors, doing webinars, market updates, etc.
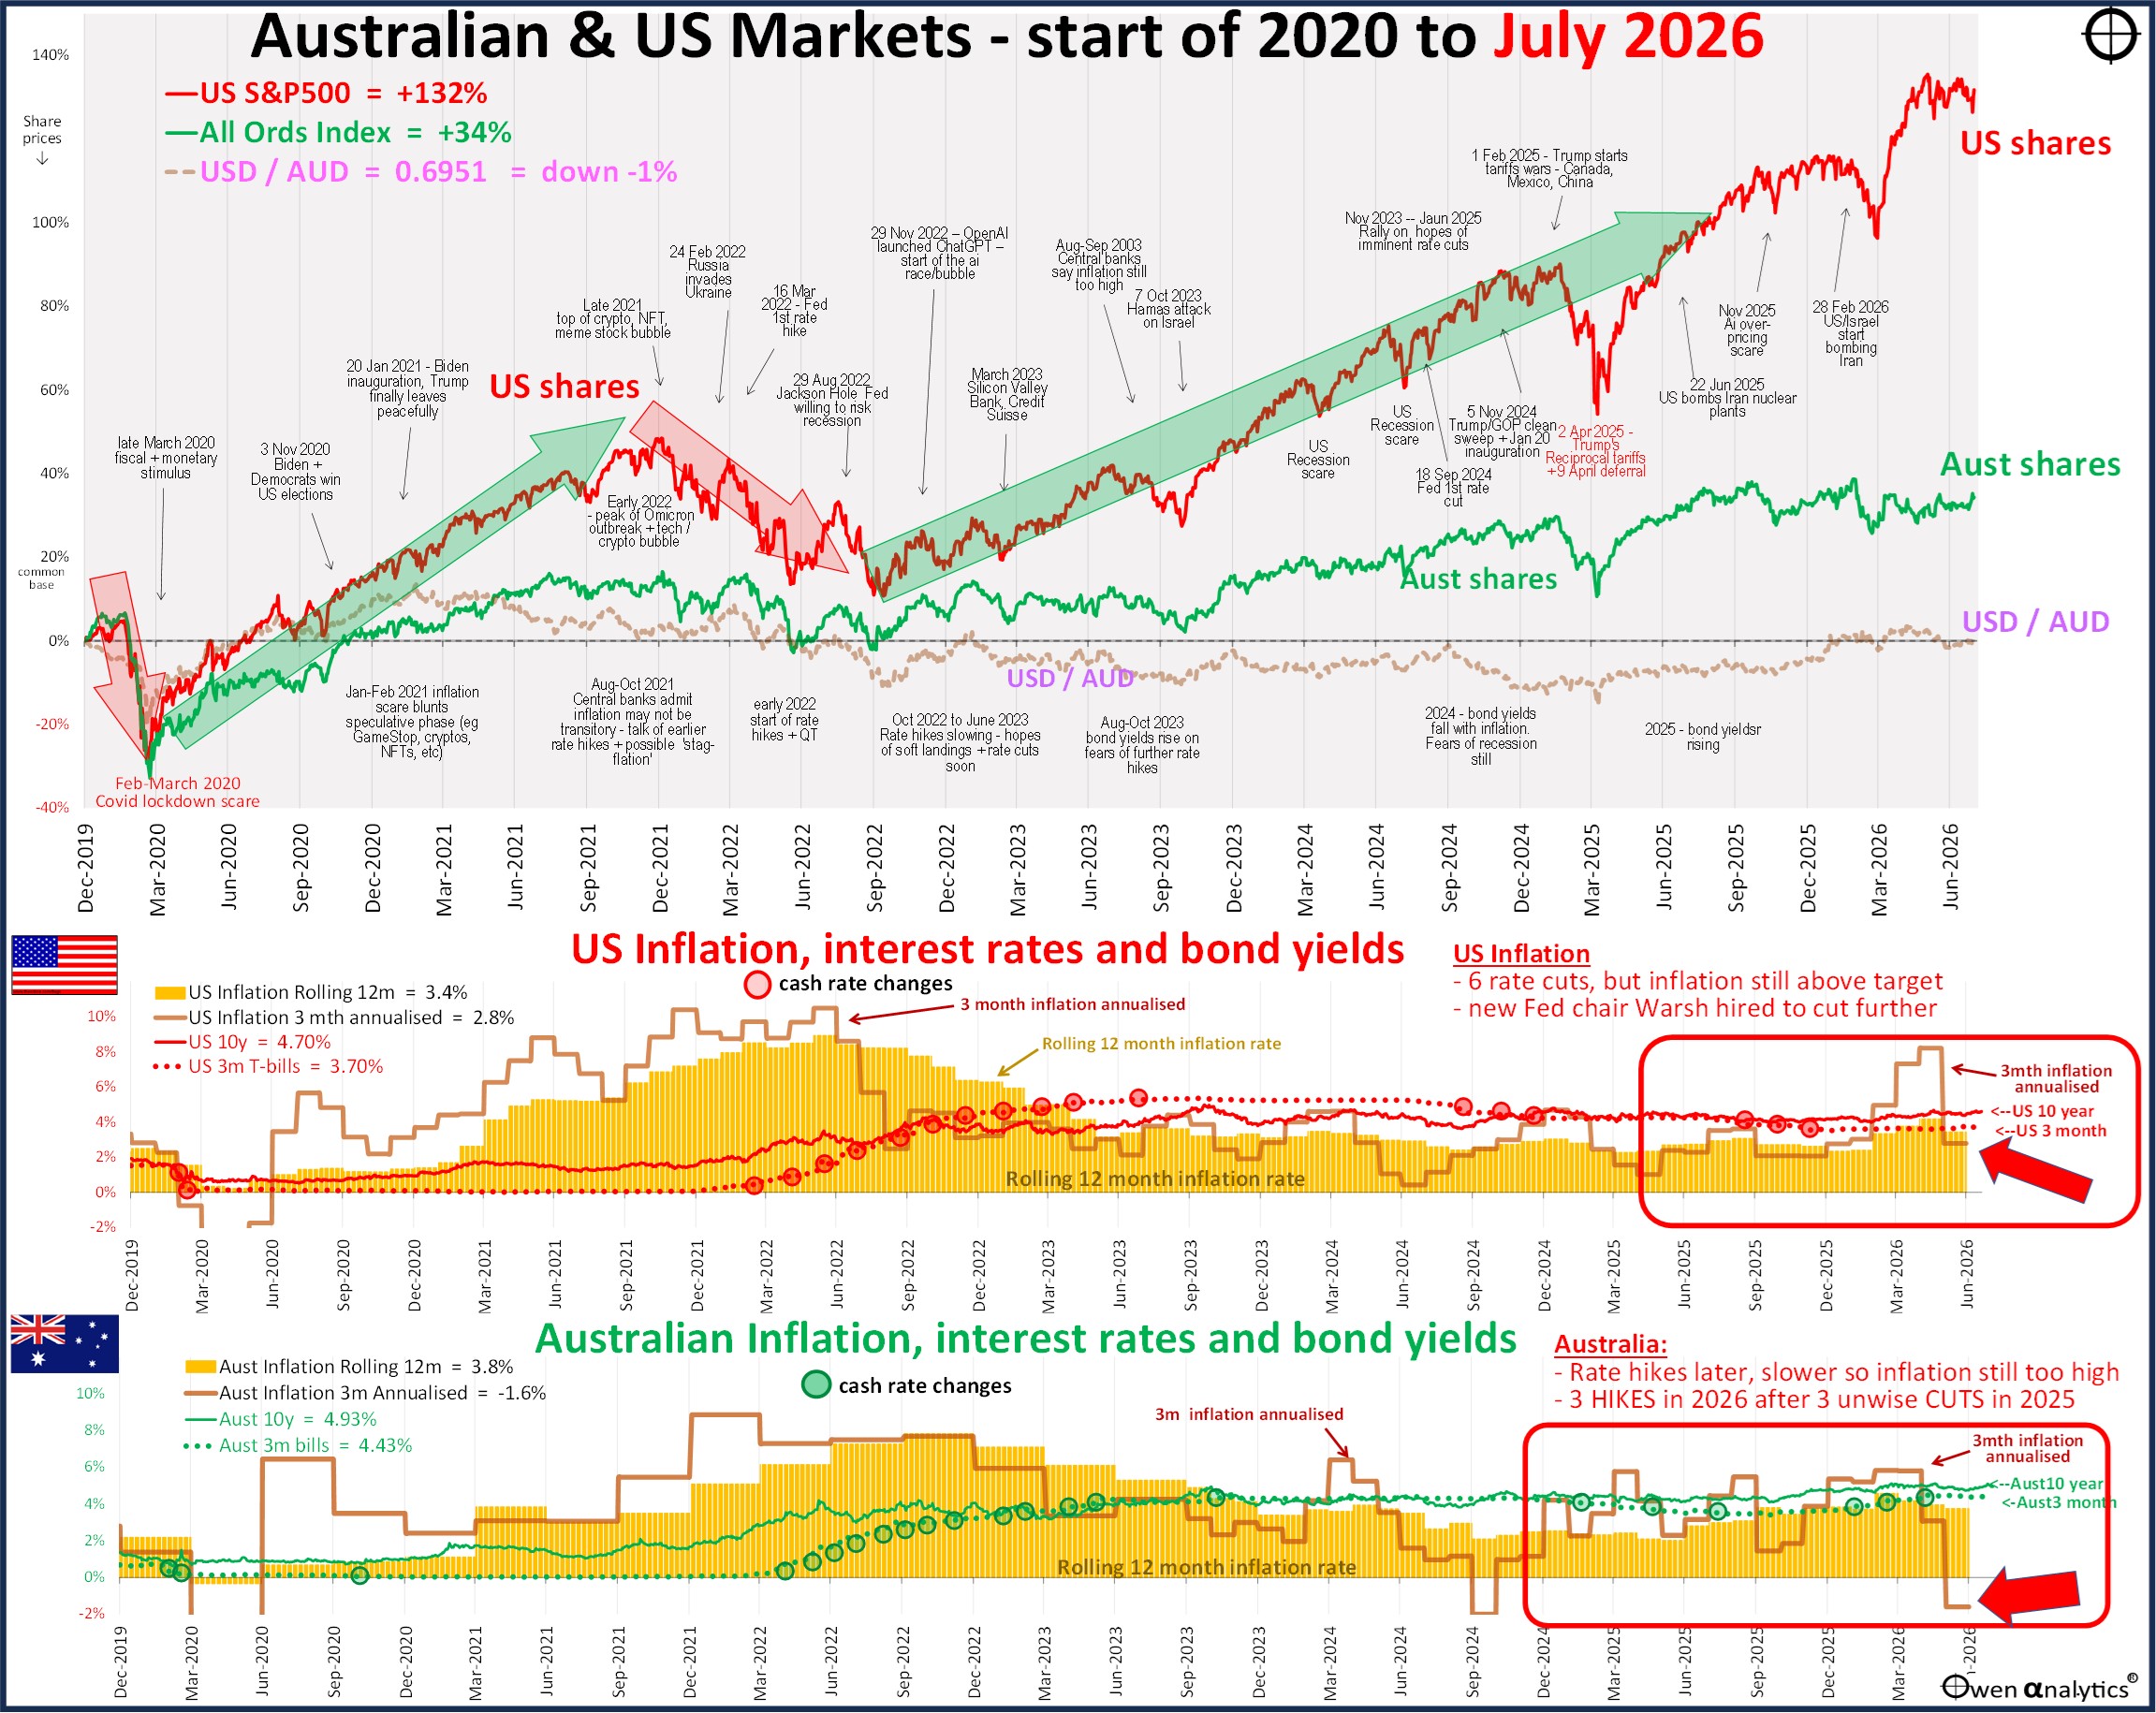
Not only does this chart have all the detail I need to answer investor questions from advisers, but even from the back of the room you can easily see the big picture on where we are for share markets, currency, inflation, long & short interest rates.
I will get into shares in a moment, but from the back of the room you can see that share markets had a minor hiccup in March this year (near top right corner of the chart – red for US, green for ASX), then were back on track in April and May, but paused in July.
Bottom line – if you were rattled by the volatility and (very brief) share market falls in March 2026 or 2022 (rate hikes) or 2020 (Covid), then you ain’t seen nothin’ yet! (or you are too young to remember what a real crash looks and feels like!)
Share markets
Global share markets were more or less flat in July, ending the rebound since the brief dip at the start of the US/Iran war. Three main reasons for the pause:
First: the US/Iran war stalemate leaving fuel prices high, flowing through to broad inflation numbers and consumer confidence & spending.
Second: the US Fed’s new Chair Kevin Warsh sounding too soft on inflation – raising fears of higher-for-longer inflation and interest rates (reflecting in higher bond yields – see below), which are never good for share markets.
Third: widening fears about the ai boom deflating. Four key developments in July:
-
- (1) Fears that China is fast catching up with the US on ai (another ‘DeepSeek’ moment with the launch of MoonShot’s Kimi K3 on 17th July) and chips (monster IPO of CXMT: ChangXin Memory Tech on the 27th).
-
- (2) More circular funny-money deals from Nvidia - this time guaranteeing Softbank/OpenAi debt to finance them buying Nvidia chips;
-
- (3) The ‘hyper-scalers’ chewing up all of their operating cashflows (plus taking on huge debts) to throw at ai capex, with no compelling business cases other than frenzied FOMO spending on a monumental scale;
-
- (4) Fears the Ai capex boom is fuelling inflation, meaning more rate hikes which would hit private credit, private equity, venture funds, hedge funds and their bankers.
Global Industry Sectors
Most global industry sectors were up for the month. The next charts show total returns from global sectors for July 2026 (middle chart), calendar year to date (right), compared to 2025 (left chart):
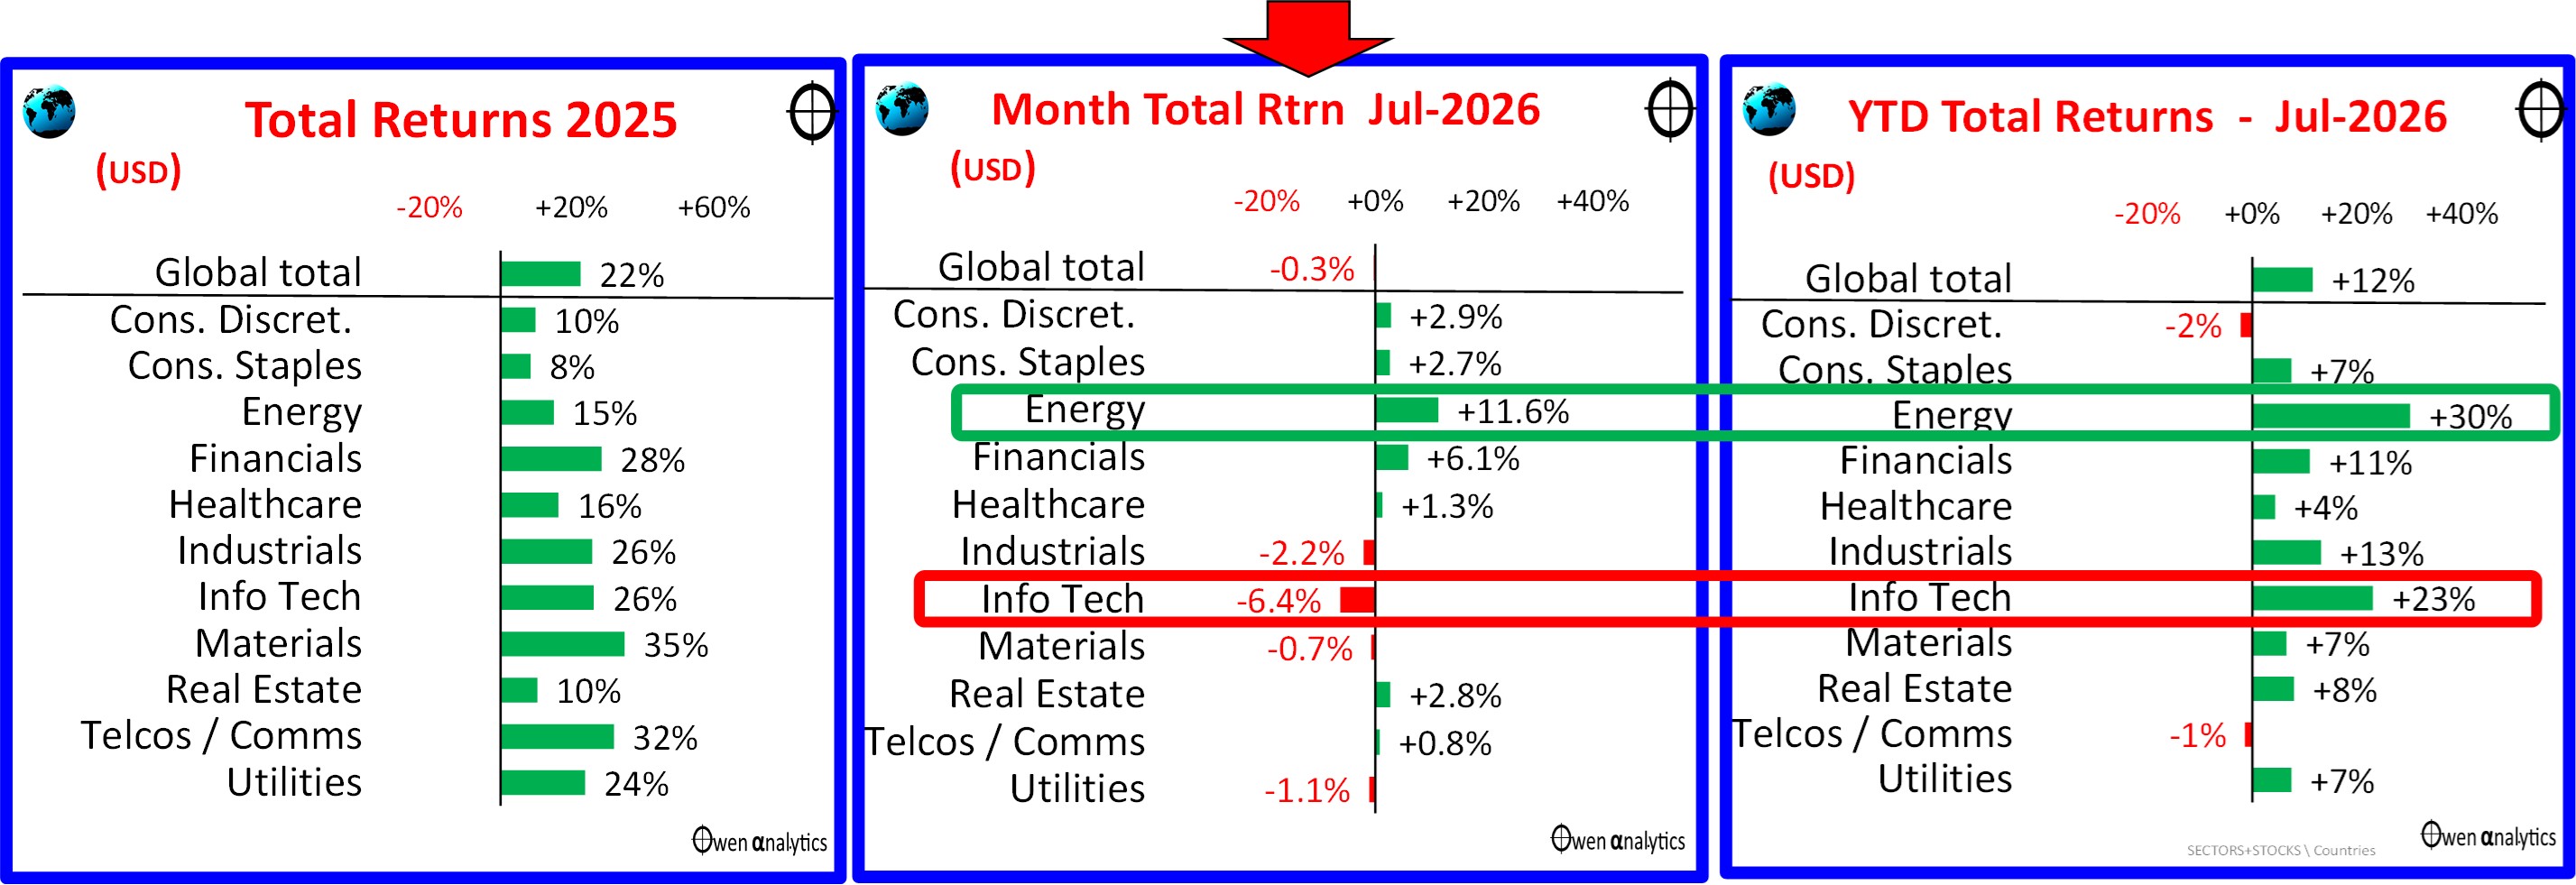
The stand-out sector up is fossil fuels (‘energy’) – with good gains in the major stocks this year as they profit from the global supply squeeze.
The tech sector was the main drag in July (middle chart), but is it still up strongly for the year to date (right).
Major global stocks
Here is the picture for the largest global stocks (almost all of which are US based) for the same three periods:
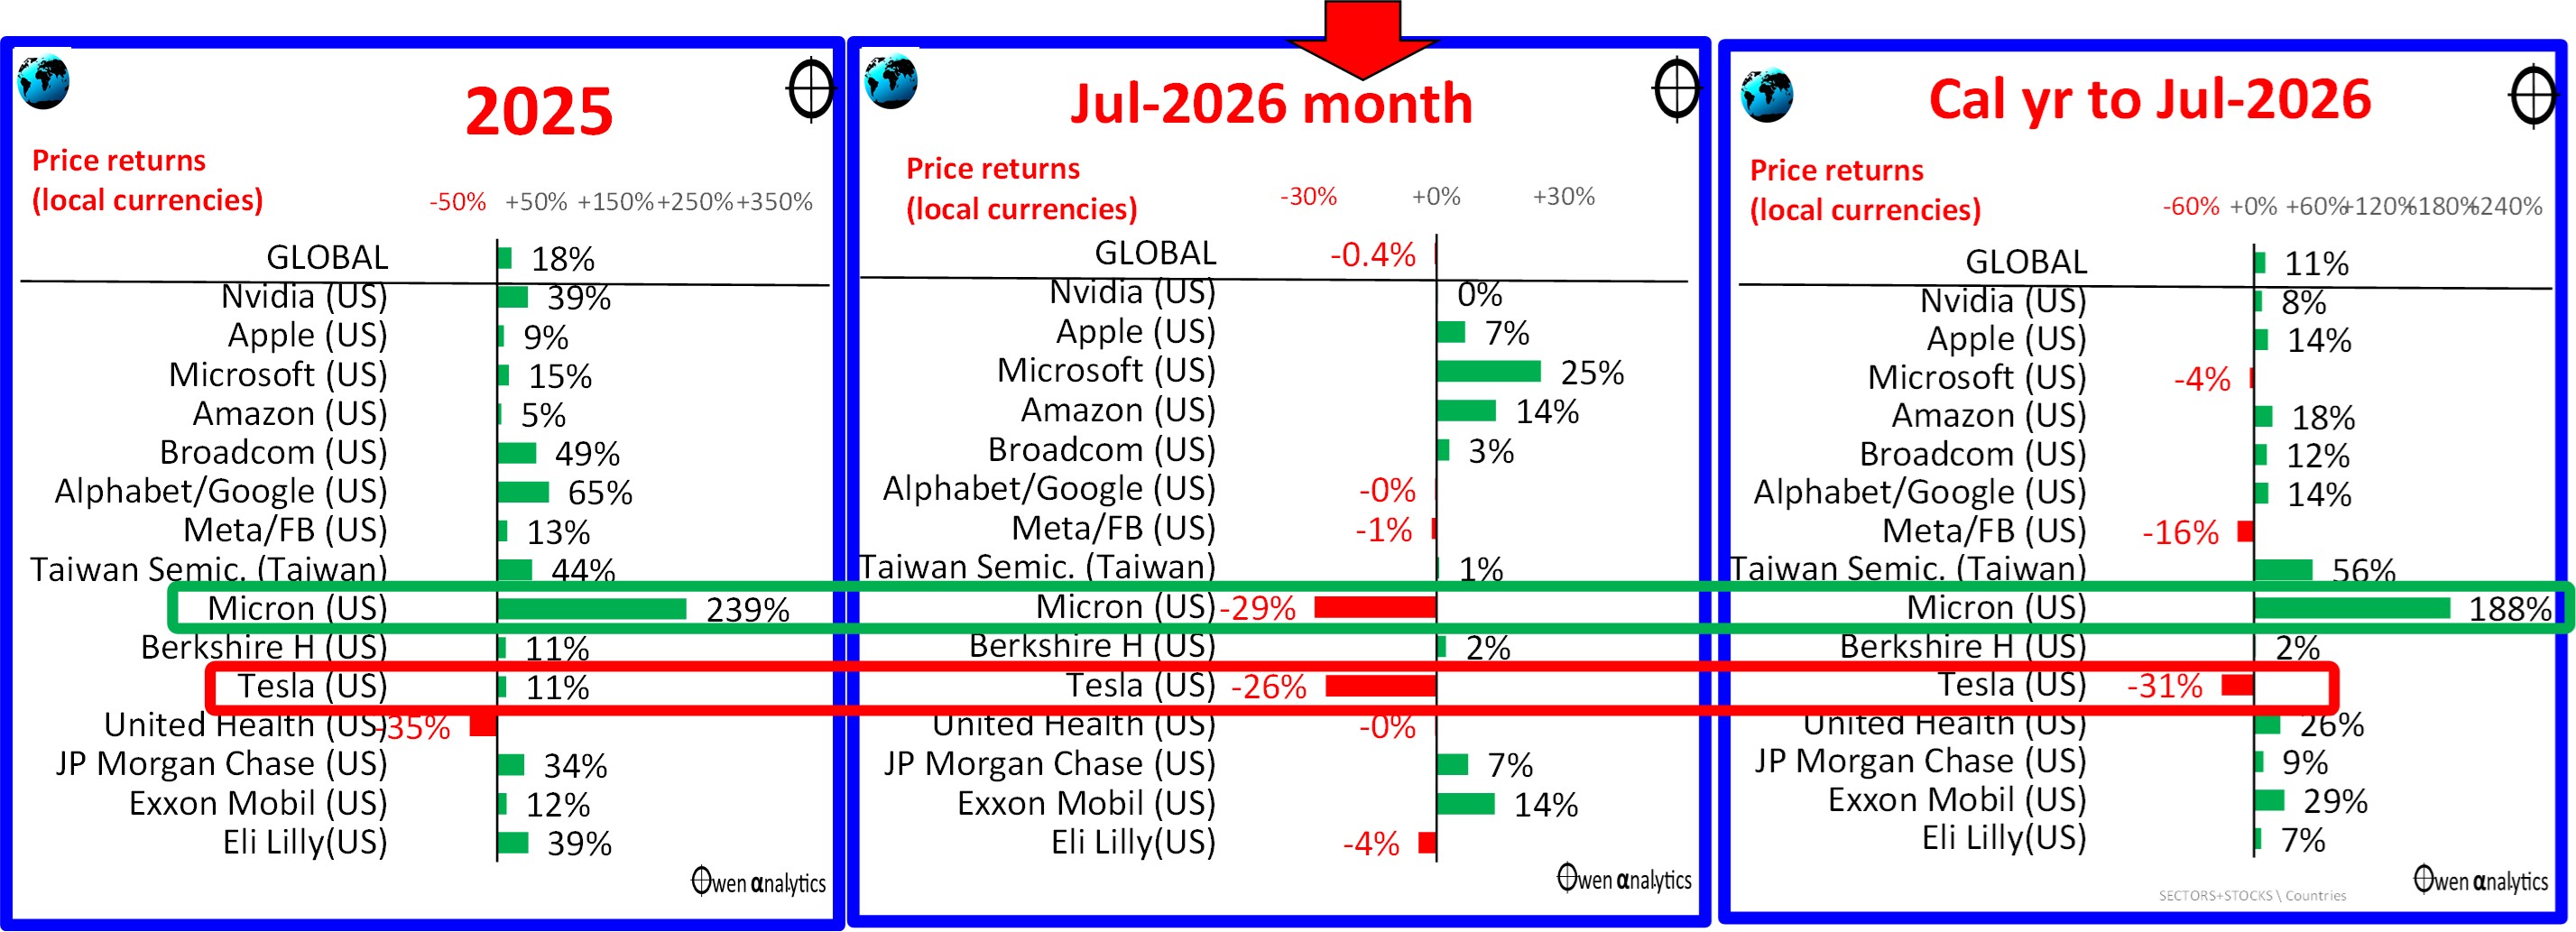
Microsoft had a good month in July and defied the recent tech-rout thanks to its surging cloud computing revenues, but it still lags for the year to date.
The star this year has been Idaho-based US chip maker Micron Technology (no relation to Idaho potatoes). The laggard this year has been Tesla, the low-margin car maker dressed up as a tech stock.
SpaceX – the hottest of hot stocks in June - had a shocker in July. It raised US$77B at $130 per share in the IPO, by far the largest IPO in the history of the world. It opened at $150 on the first day of trading on 12 June, peaked at $225 on 16 June, but sank to $108 by end of July. At the time of the IPO I wrote that I would certainly not be buying as it had no fundamental merit (vastly over-priced on cash flows, profits, dividends, assets) and it also did not stack up as speculative bet -
· SpaceX: am I a buyer? How it compares to my only ‘1,000 bagger’ (12-Jun-2026)
My conclusion at the time was – ‘You buy when everyone else is running the other direction. Don’t be lured into a buying frenzy at crazy prices at or near the top of a boom/bubble. Always go against the crowd.”
As it turned out, the SpaceX IPO marked the peak of the speculative FOMO frenzy. It will go down in history as the ‘Pets.com’ of the 2020s tech boom.
I might be wrong of course. Recall that Facebook IPO’d at $32 in 2012, promptly sank below $18, but is $600+ today.
Major country share markets
Here are the main share markets:
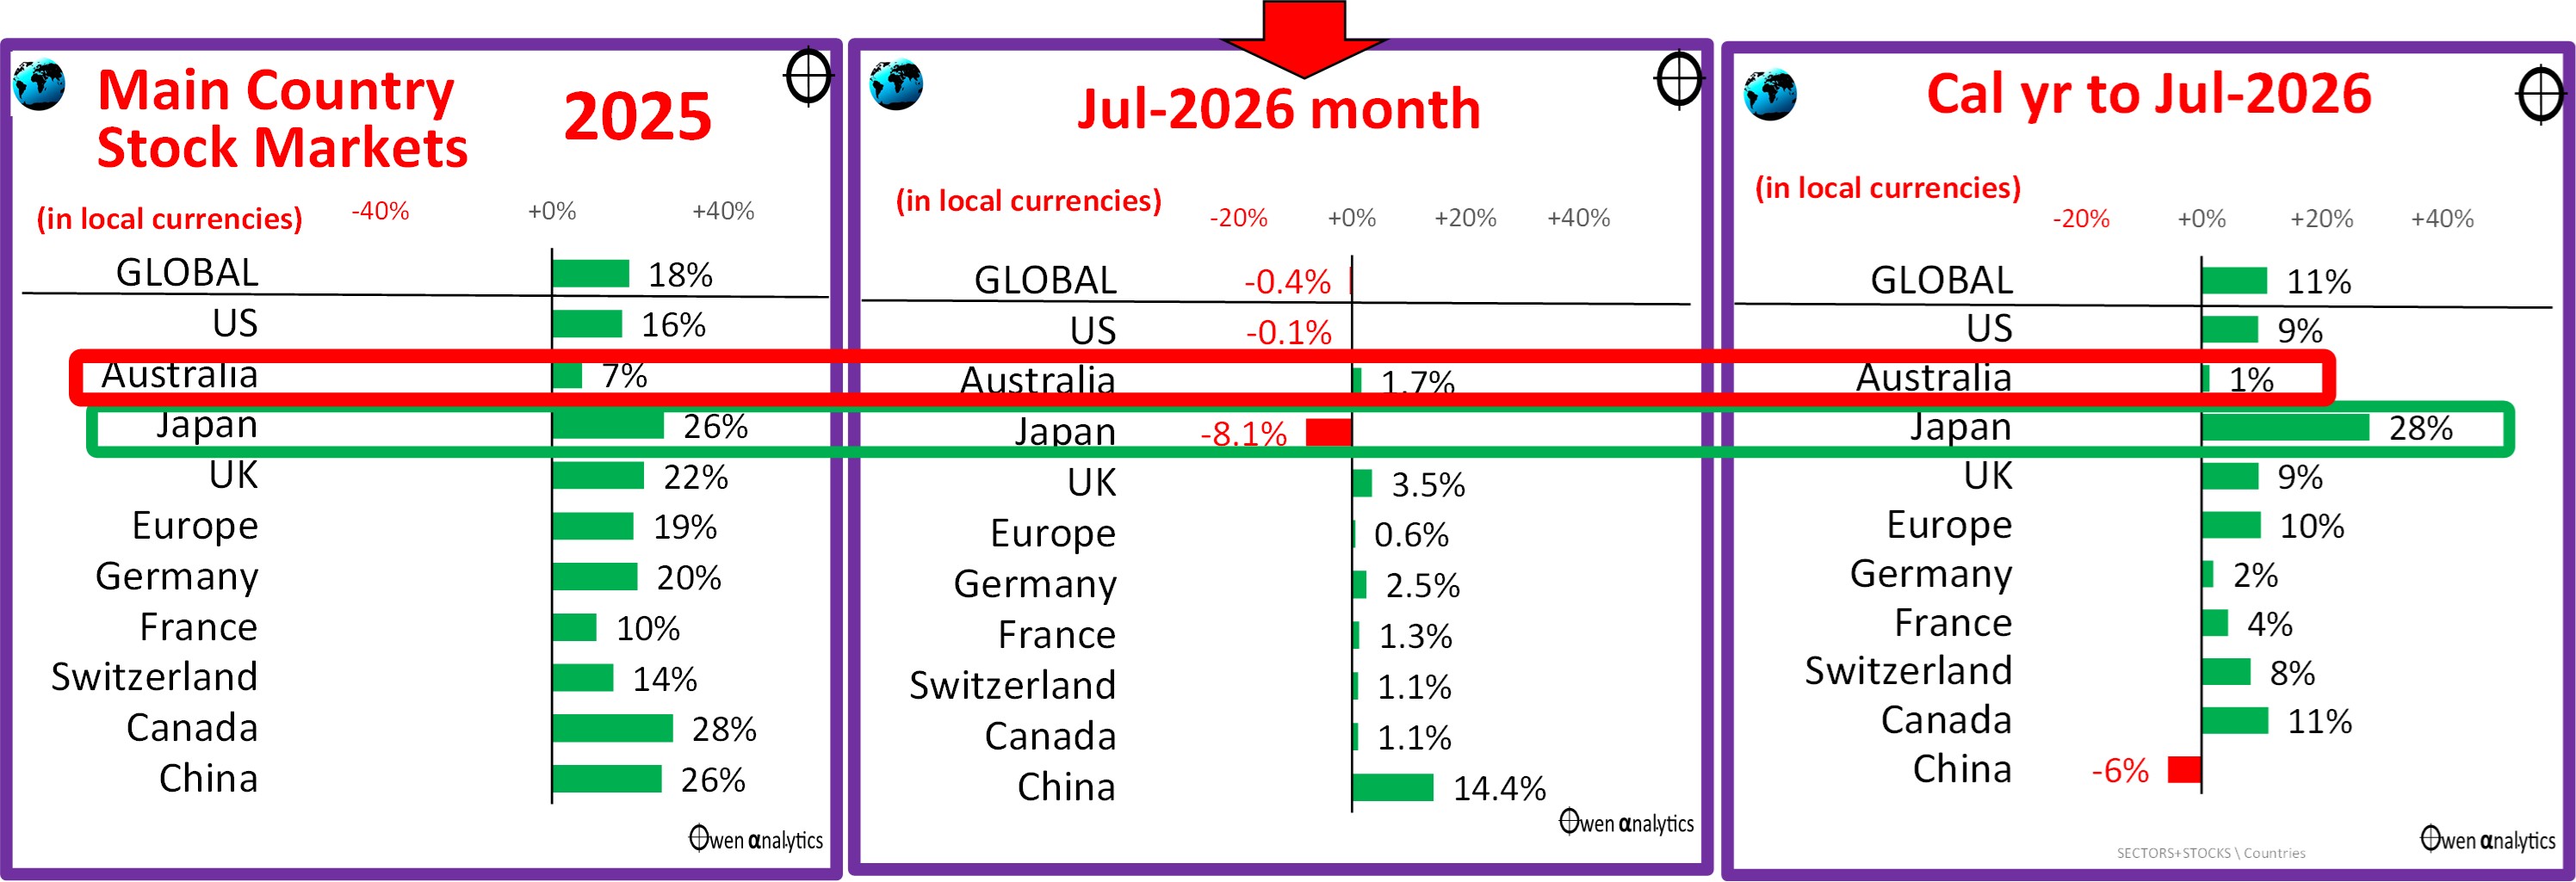
Most were up a fraction in July. The main exception was Japan (down -8%, mainly due to Softbank and Shin-Etsu Chemical).
Despite the recent ai/tech jitters, global share markets are ahead by 11% (in local currency terms) in calendar 2026 to date. If they hold up for the rest of the year it will be a fourth good year in a row in the current boom, following three very strong years averaging +20% per year in 2023, 2024 and 2025. Unless of course the recent tech wobbles turn into a major rout, which is entirely possible.
Share market pricing –
Share markets everywhere (not just US tech/ai stocks) are still vastly over-priced on a variety of measures – including and especially in Australia (despite its lower apparent headline pricing) - and we are well and truly due for a global correction. Refer to the above reports on share market pricing.
For a deep dive into share market over-pricing, take a look at my recent six-part series on pricing of global share markets to better understand their implications -
· Part 1: Share market Pricing per country – How does your country rate? (11 Aug 2025)
· Part 2: P/E ratios, Dividend Yields, Price-to-Book value (17 Aug 2025)
· Part 3: Forward P/E ratios and Earnings growth assumptions (20 Aug 2025)
· Part 4: Profit Margins & Returns on Equity – US highest, but it is sustainable? (26 Aug 2025)
· Part 5: Growth rates for Profits & Dividends (28 Aug 2025)
· Part 6: What’s a fair price for growth? – ‘PEG’ ratios & Buffett/Graham’s ‘8.5 rule’ (7 Sep 2025)
For more on US profits and pricing – see:
· US Shares: ambitious multiples on ambitious, accelerating profit forecasts – a double layer of over-confidence. But powering on regardless! (20 May 2025)
Australian shares
The local Australian share market continues to lag the rest of the world. The last all-time high for the All Ords was at the end of February immediately before the US started bombing Iran). The All Ords was up 2% in July, but is up just 1% the year to date (whereas the US market is up 9%).
Here are the main ASX stocks for July 2026 (middle chart), calendar year to date (right), compared to 2025 (left chart):
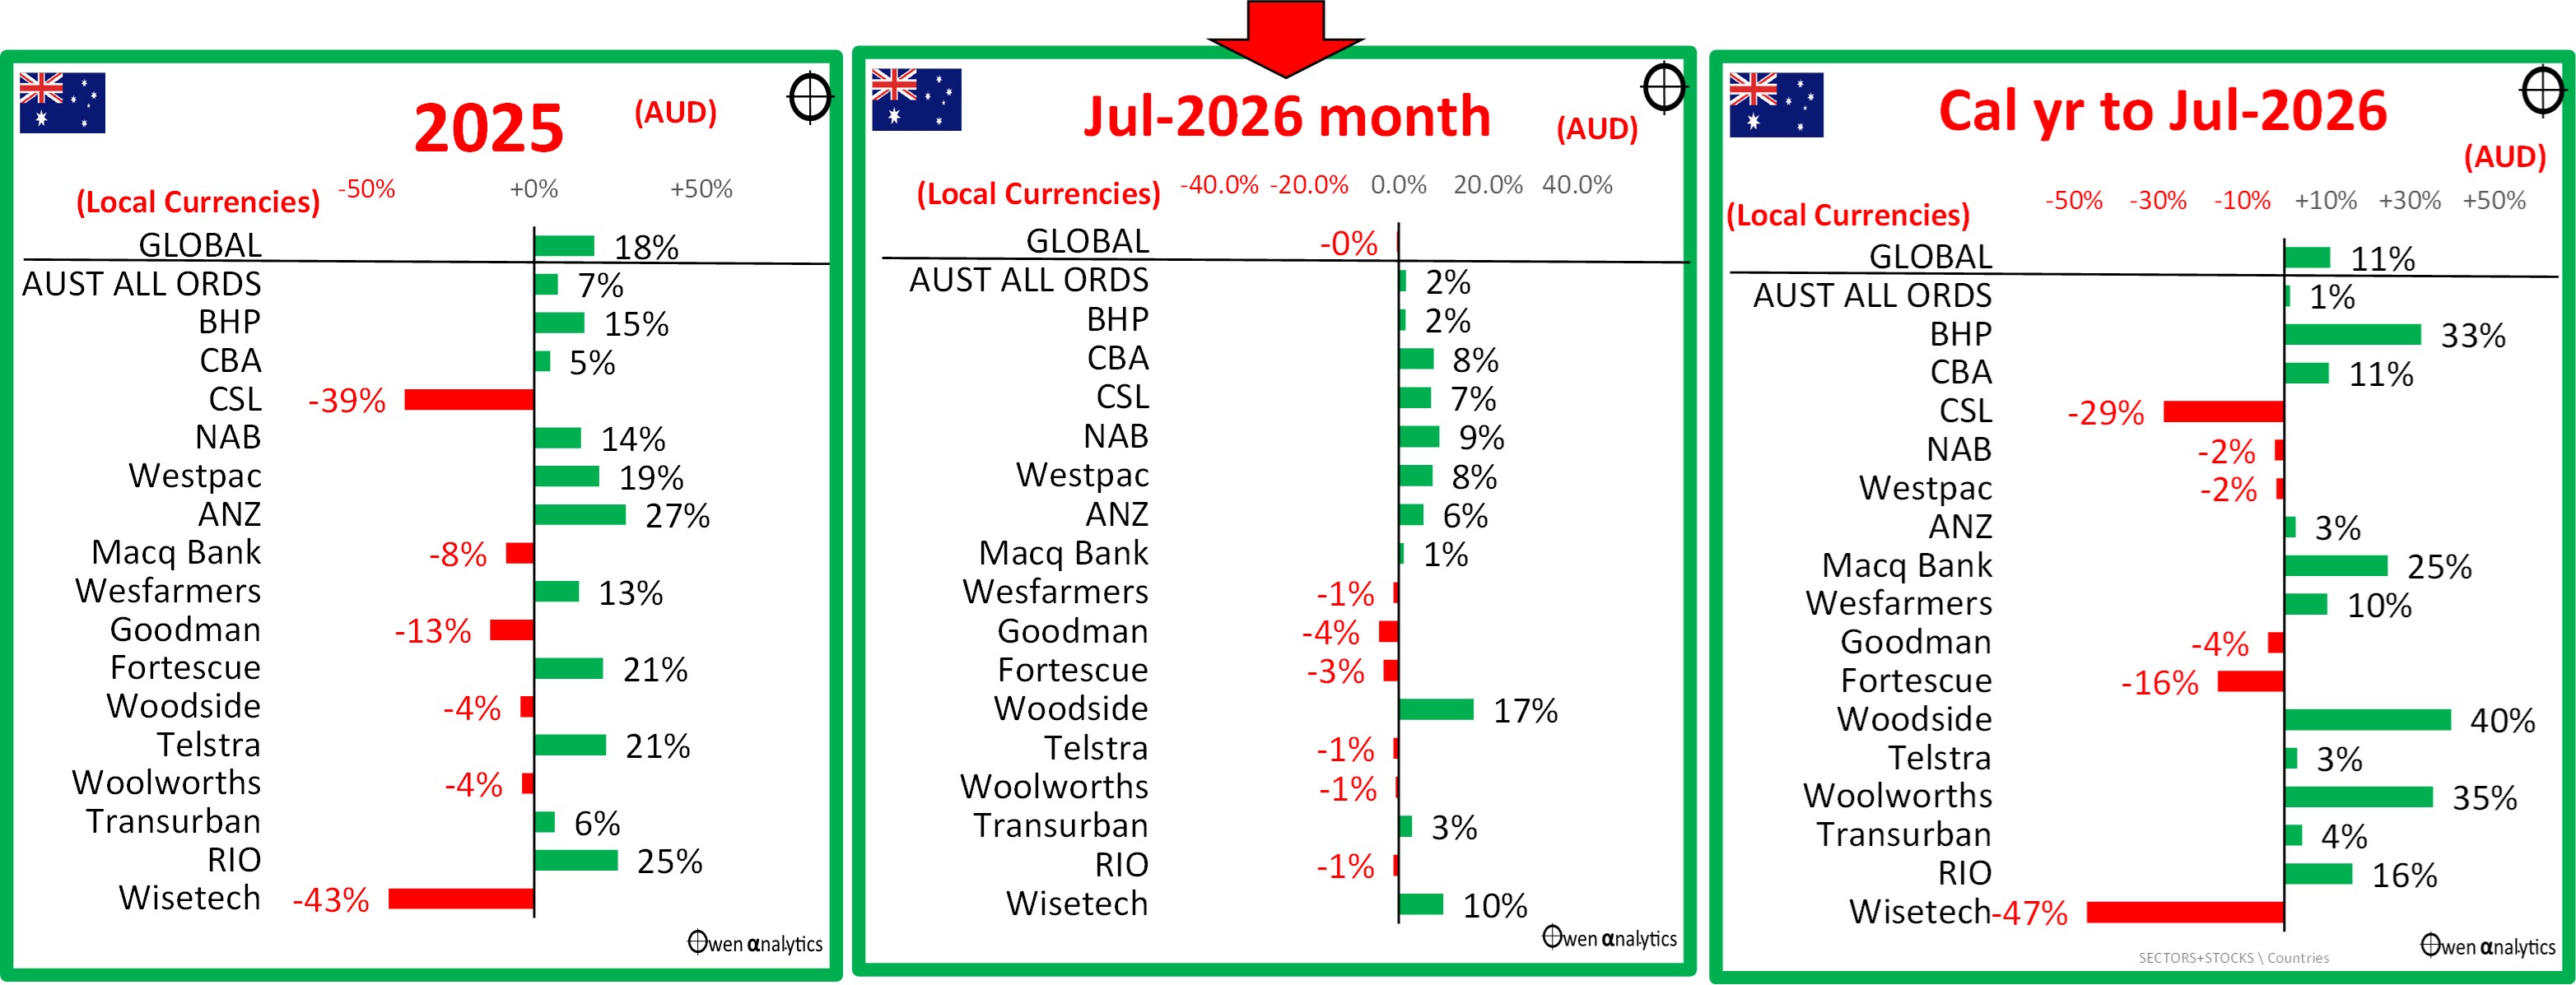
In July the main winners were Woodside, Santos, Ampol milking higher oil prices. Otherwise it was mainly a rotation out of lithium miners Pilbara Min, MinRes, IGO, and also Lynas (rare earths), and Iluka (minerals sands, rare earths) into the big banks.
So far this year, the main ASX winners have been fossil fuel producers (led by Woodside +40%, Santos +27%), and miners (BHP +33%, RIO +16%, South32 +28%), but gold miners have been hit by gold prices easing off a little this year.
Among the big banks, CBA has gained +10% for the year for some unknown reason (its fundamentals peaked in 2015!) but the other three big banks are flat, while Macquarie has done well (+25%) in the global ai/transaction boom.
The other sectors are mainly down – REITs, Comms, Health Care, Utilities and most Discretionaries, but Woollies +35% and Coles +12% have done well out of rising supermarket prices in the ‘cost-of-living’ squeeze.
Worst this year have been Health Care, which has been a sea of red ink: CSL (-29%), Cochlear (-54%), ProMedicus (-27%), ResMed (-17%), Sonic (-3%). Most of these have been own goals – with aggressive expansion adventures failing to live up to the hype.
Also hit hard this year have been several former tech stars for the same reason (overly ambitious expansions), plus also the threat of ‘ai’: eg Wisetech (-47%), Xero (–3%), Seek (-36%), REA (-12%).
Inflation & interest rates
The stalemate in the US/Iran war looking like a reasonably likely outcome, plus continued deficit spending by profligate governments everywhere, would mean above-target inflation lasting longer (after some possible short-term rises).
US inflation remains well above target on all key measures. The overall US economy remains rather robust. It is not just a narrow ai capex boom. US unemployment at 4.2% is still relatively low and inflationary.
Australia is the exception of course. The RBA was the first central bank in the world to switch from rate cuts after the 2021-3 inflation surge, back to rate HIKES. The RBA’s three hikes in February, March and May this year reversed its three unjustified cuts last year as inflation was, and still is, running well above target range. (following the RBA hikes this year, Europe and New Zealand have hiked rates once each.)
Governments and central bankers love to blame inflation on war. But even before the US/Iran war started, Australia already had the HIGHEST cash rate amongst its peers – because we have the highest inflation, the highest inflation expectations (treasury yields), the loosest/highest inflation target, and the lowest unemployment rate among our peers.
For the full story see –
· Why are Australian cash rates HIGHEST in the world? Five simple reasons (20-Apr-2026)
Australian Unemployment remained flat at 4.4% which is still too low (inflationary). Adding to the problem is the fact that most of the hiring in recent years has been in low-productivity government and non-market (government driven) sectors. Government hiring is making up for any ai-related job jobs.
Bond yields and bond markets
The picture on inflation and interest rates leads us directly to bond markets, in which every local and global institutional retirement/pension fund is required to hold huge allocations (but not mine fortunately!)
July was another shocker for bond investors, with yields rising across the board. Two main reasons: First is Trump’s war on Iran dragging on. Second is new Fed Chair Warsh appearing to go soft on inflation. US inflation has been well above target for five years but he refuses to raise rates.
US yields blew out most at the long end, with 30 year yields soaring well above 5%, the highest since the middle of 2006 before the GFC. 30-year yields are far more important in the US than Australia because most US mortgage rates are tied to the 30-year yield, not the cash rate as in Australia.
The next charts show changes in 10-year treasury yields for the month (top chart), in 2026 calendar year to date (middle), and last year for comparison (bottom):
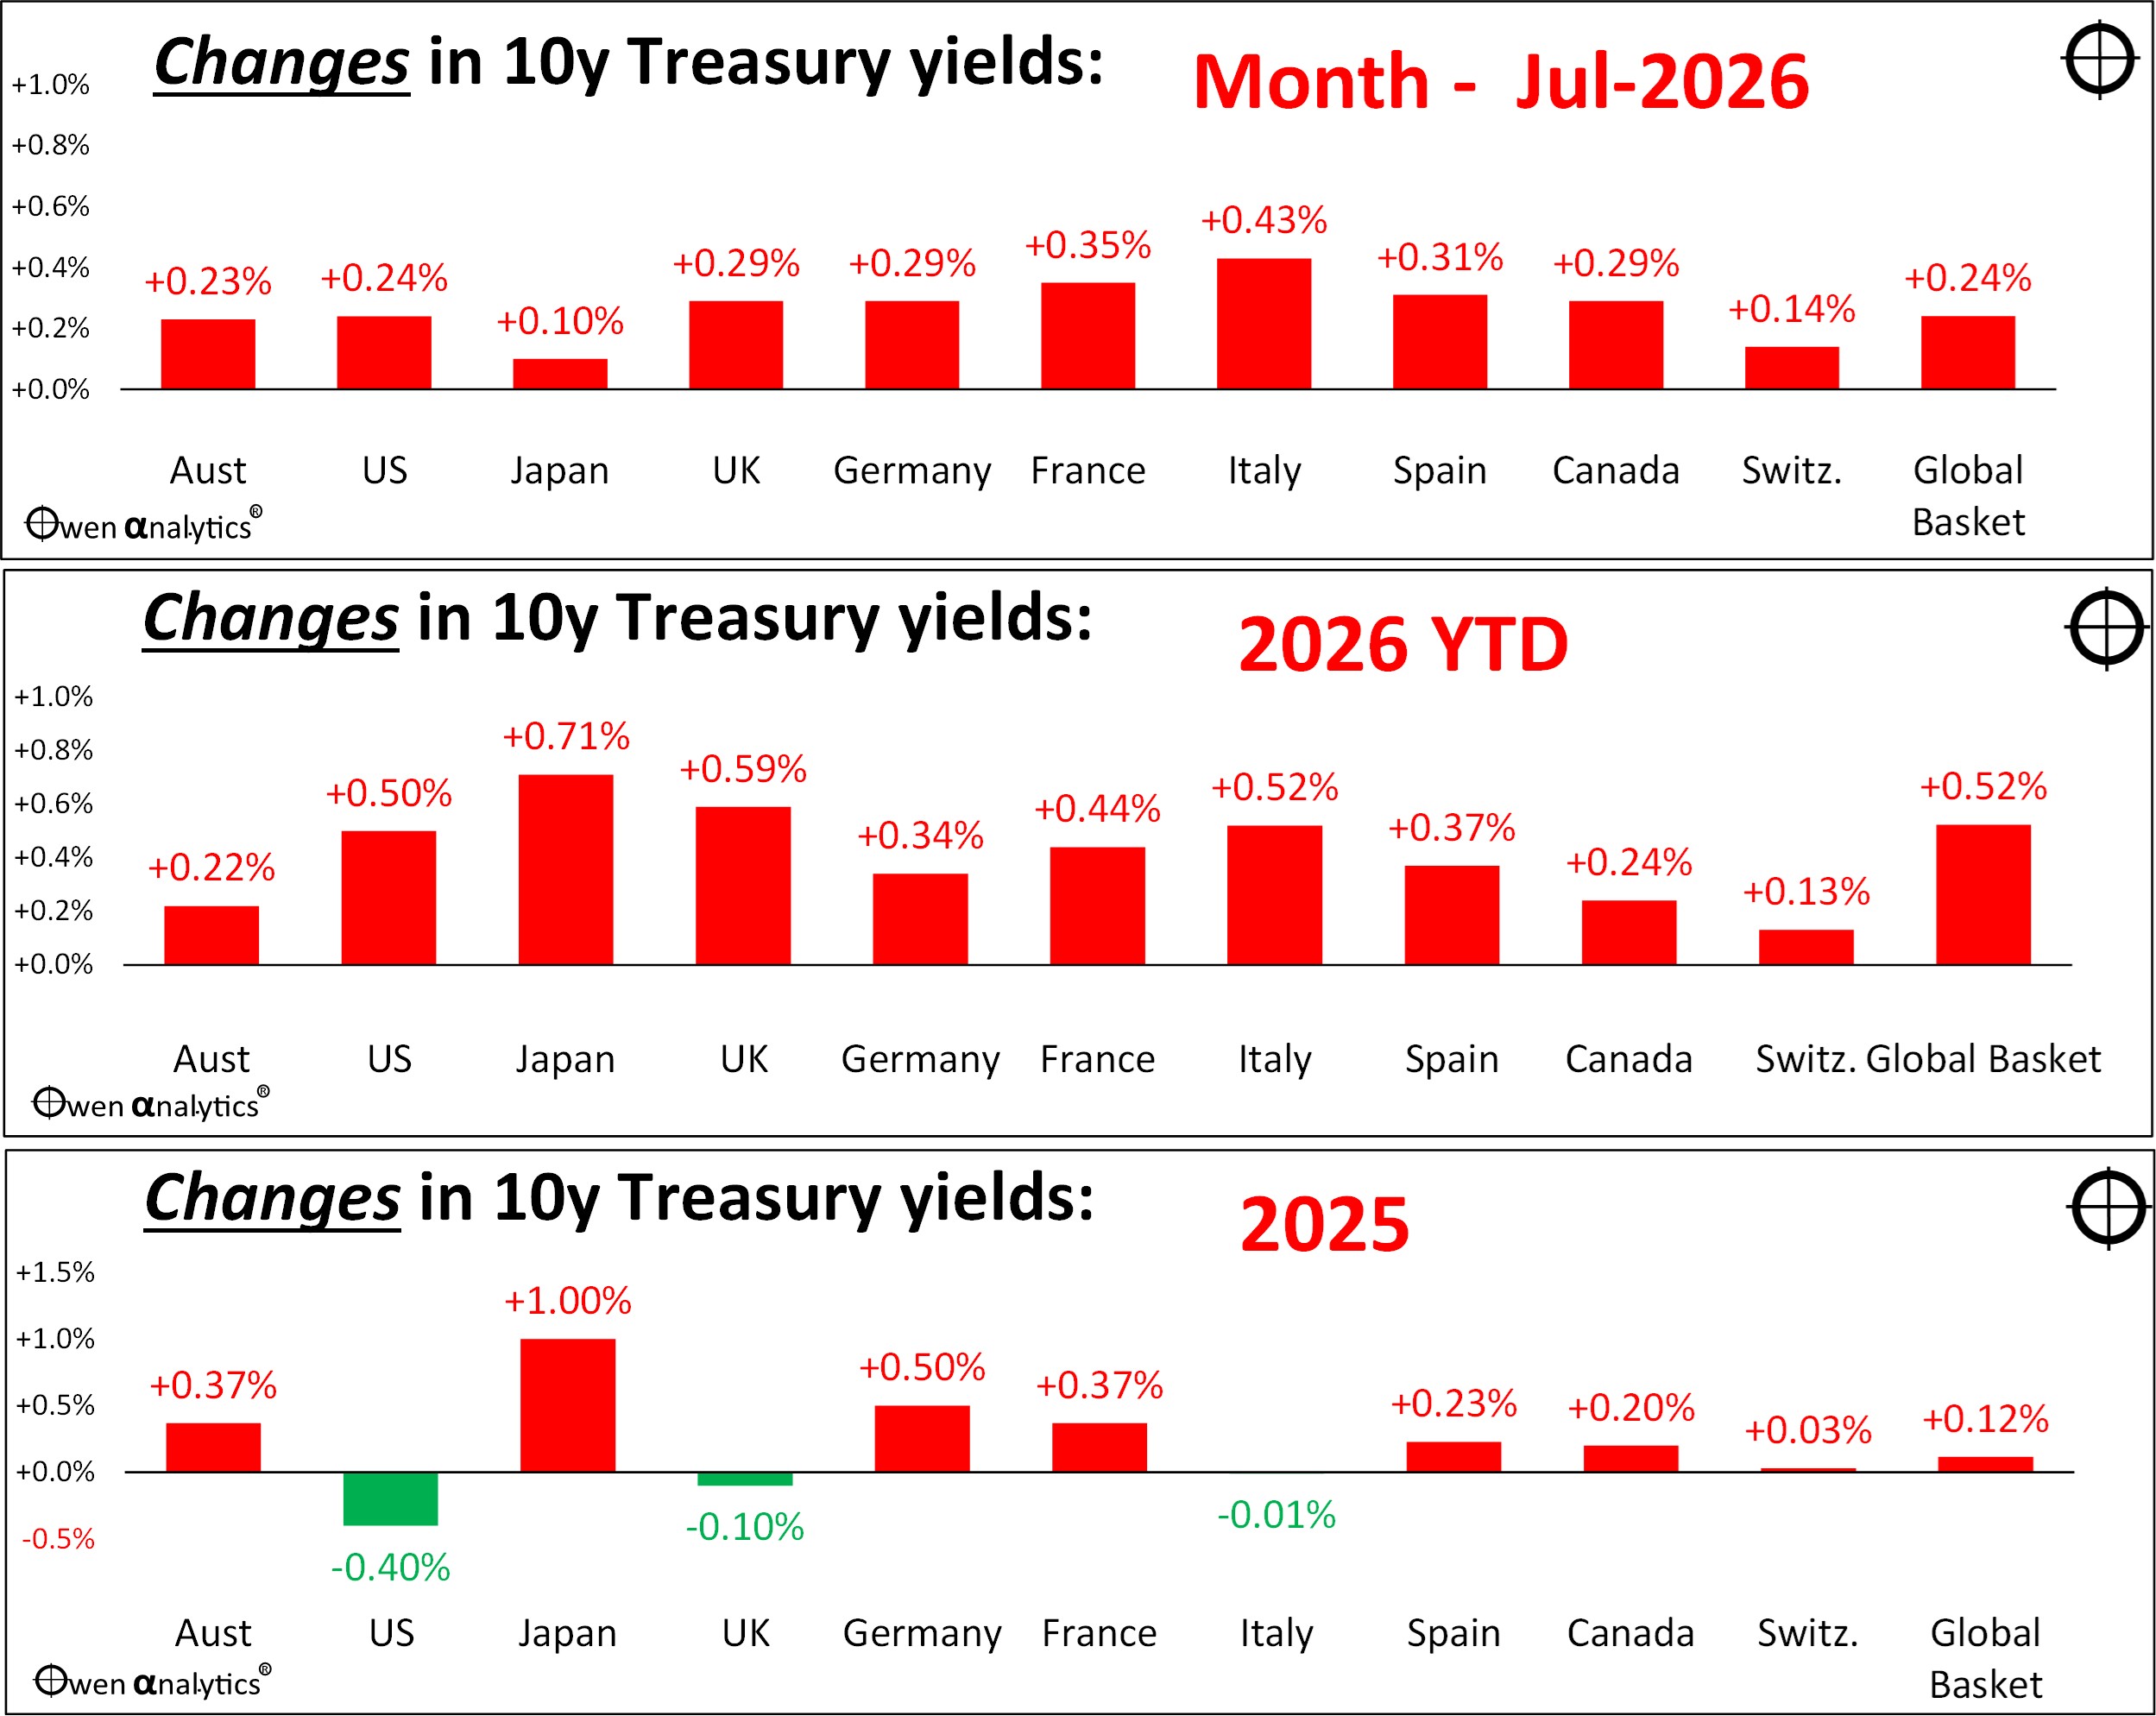
(In my charts of changes in bond yields, I show RISING yields in red as they mean LOWER bond prices & returns; and I show FALLING yields in green as they mean HIGHER bond prices & returns.)
Even worse than the US was Japan, with new-ish PM Sanae Takaichi announcing even more government deficit spending despite rising inflation.
The sea of red (rising yields) this year is bad for bond market returns.
Bond market returns
Last year (2025) turned out to be the fourth straight year of poor nominal and real returns from bonds, as yields rose virtually across the board with inflation remaining ‘sticky’. So far 2026 is looking like being a fifth straight year of poor nominal and negative real returns from bonds. We have not seen that since the 1970s.
Despite below average returns on bonds in 2025, at least 2025 was a better year for bonds than 2024 when yields rose by significantly more. Not nearly as bad as 2022, which was the worst year for US bonds in more than a century, and the worst year for Australian bonds since the 1931 Commonwealth debt default/restructure.
Now with the war in Iran and major oil/gas disruptions, yields are on the rise even further, meaning more losses (or poor returns at best) for bond markets.
Fortunately I have been out of fixed rate bonds in portfolios (advised, and my own) since 2021, due to fears that yields will remain elevated for at least the next few years, due to persistent inflation, with loose fiscal policy (governments running deficits and debts), and also loose monetary policy (central banks under enormous political pressure to keep rates too low).
It is not just the latest war in Iran. We have a host of longer-term inflationary pressures at work – including rising military spending everywhere, on-shoring of manufacturing, wage pressures from labour shortages resulting from reduced immigration, transitions to renewable energy sources, and increased supplies of bonds from profligate, populist, big spending governments here and around the world.
For the real story behind oil price spikes and inflation – see:
· Iran war hands politicians another free ticket to blame oil prices for inflation & rate hikes (14-Mar-2026_
Maybe I will take a look at fixed rate bonds again in a few years or so.
Exchange Rates
The Aussie dollar was stronger against the USD and other major currencies in July, as persistent inflation here raised the changes of RBA rate hikes. 2026 calendar year to date it is also up against all other major currencies, echoing the US global share boom this year:
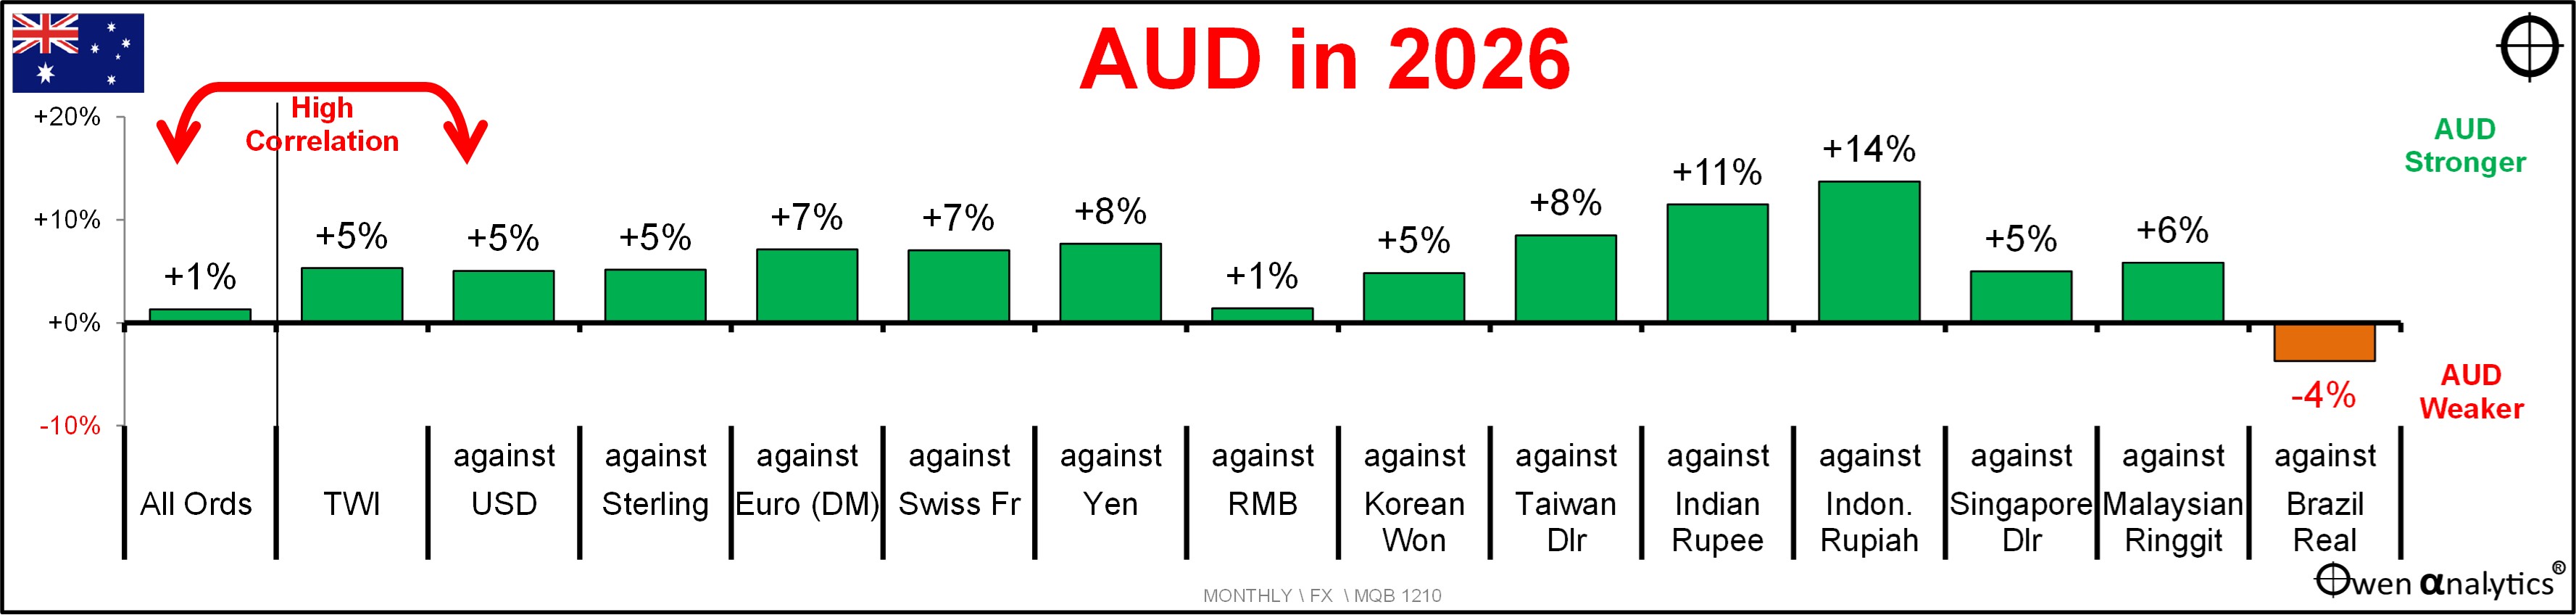
As the Aussie dollar is a ‘risk currency’, it always sells off in a global crisis, regardless of local conditions. In the March share sell-off the AUD fell against all major currencies, especially the US dollar (ie the usual pattern). This partially cushioned price falls on ‘unhedged’ foreign shares when converted back into Aussie dollars for portfolio reporting.
Then in April and May the AUD has rebounded along with the share rebound (also the usual pattern). Year to date is up strongly, as is the US/global share market.
Conversely, the US is the global ‘safe haven’ currency (and has been since WW1), so it (almost) always rises in global crises, even if the US is the cause of the panic (for example in the GFC). As global investors (ie primarily US investors) panic sold just about everything in March this y ear and retreated home, the US dollar strengthened against all other major currencies (the usual pattern).
To illustrate the high correlation between the AUD and the share market (both risk assets), here are the outcomes for 2008 (when the AUD fell heavily with shares in the GFC), and then 2009 (when the AUD rebounded strongly with shares):
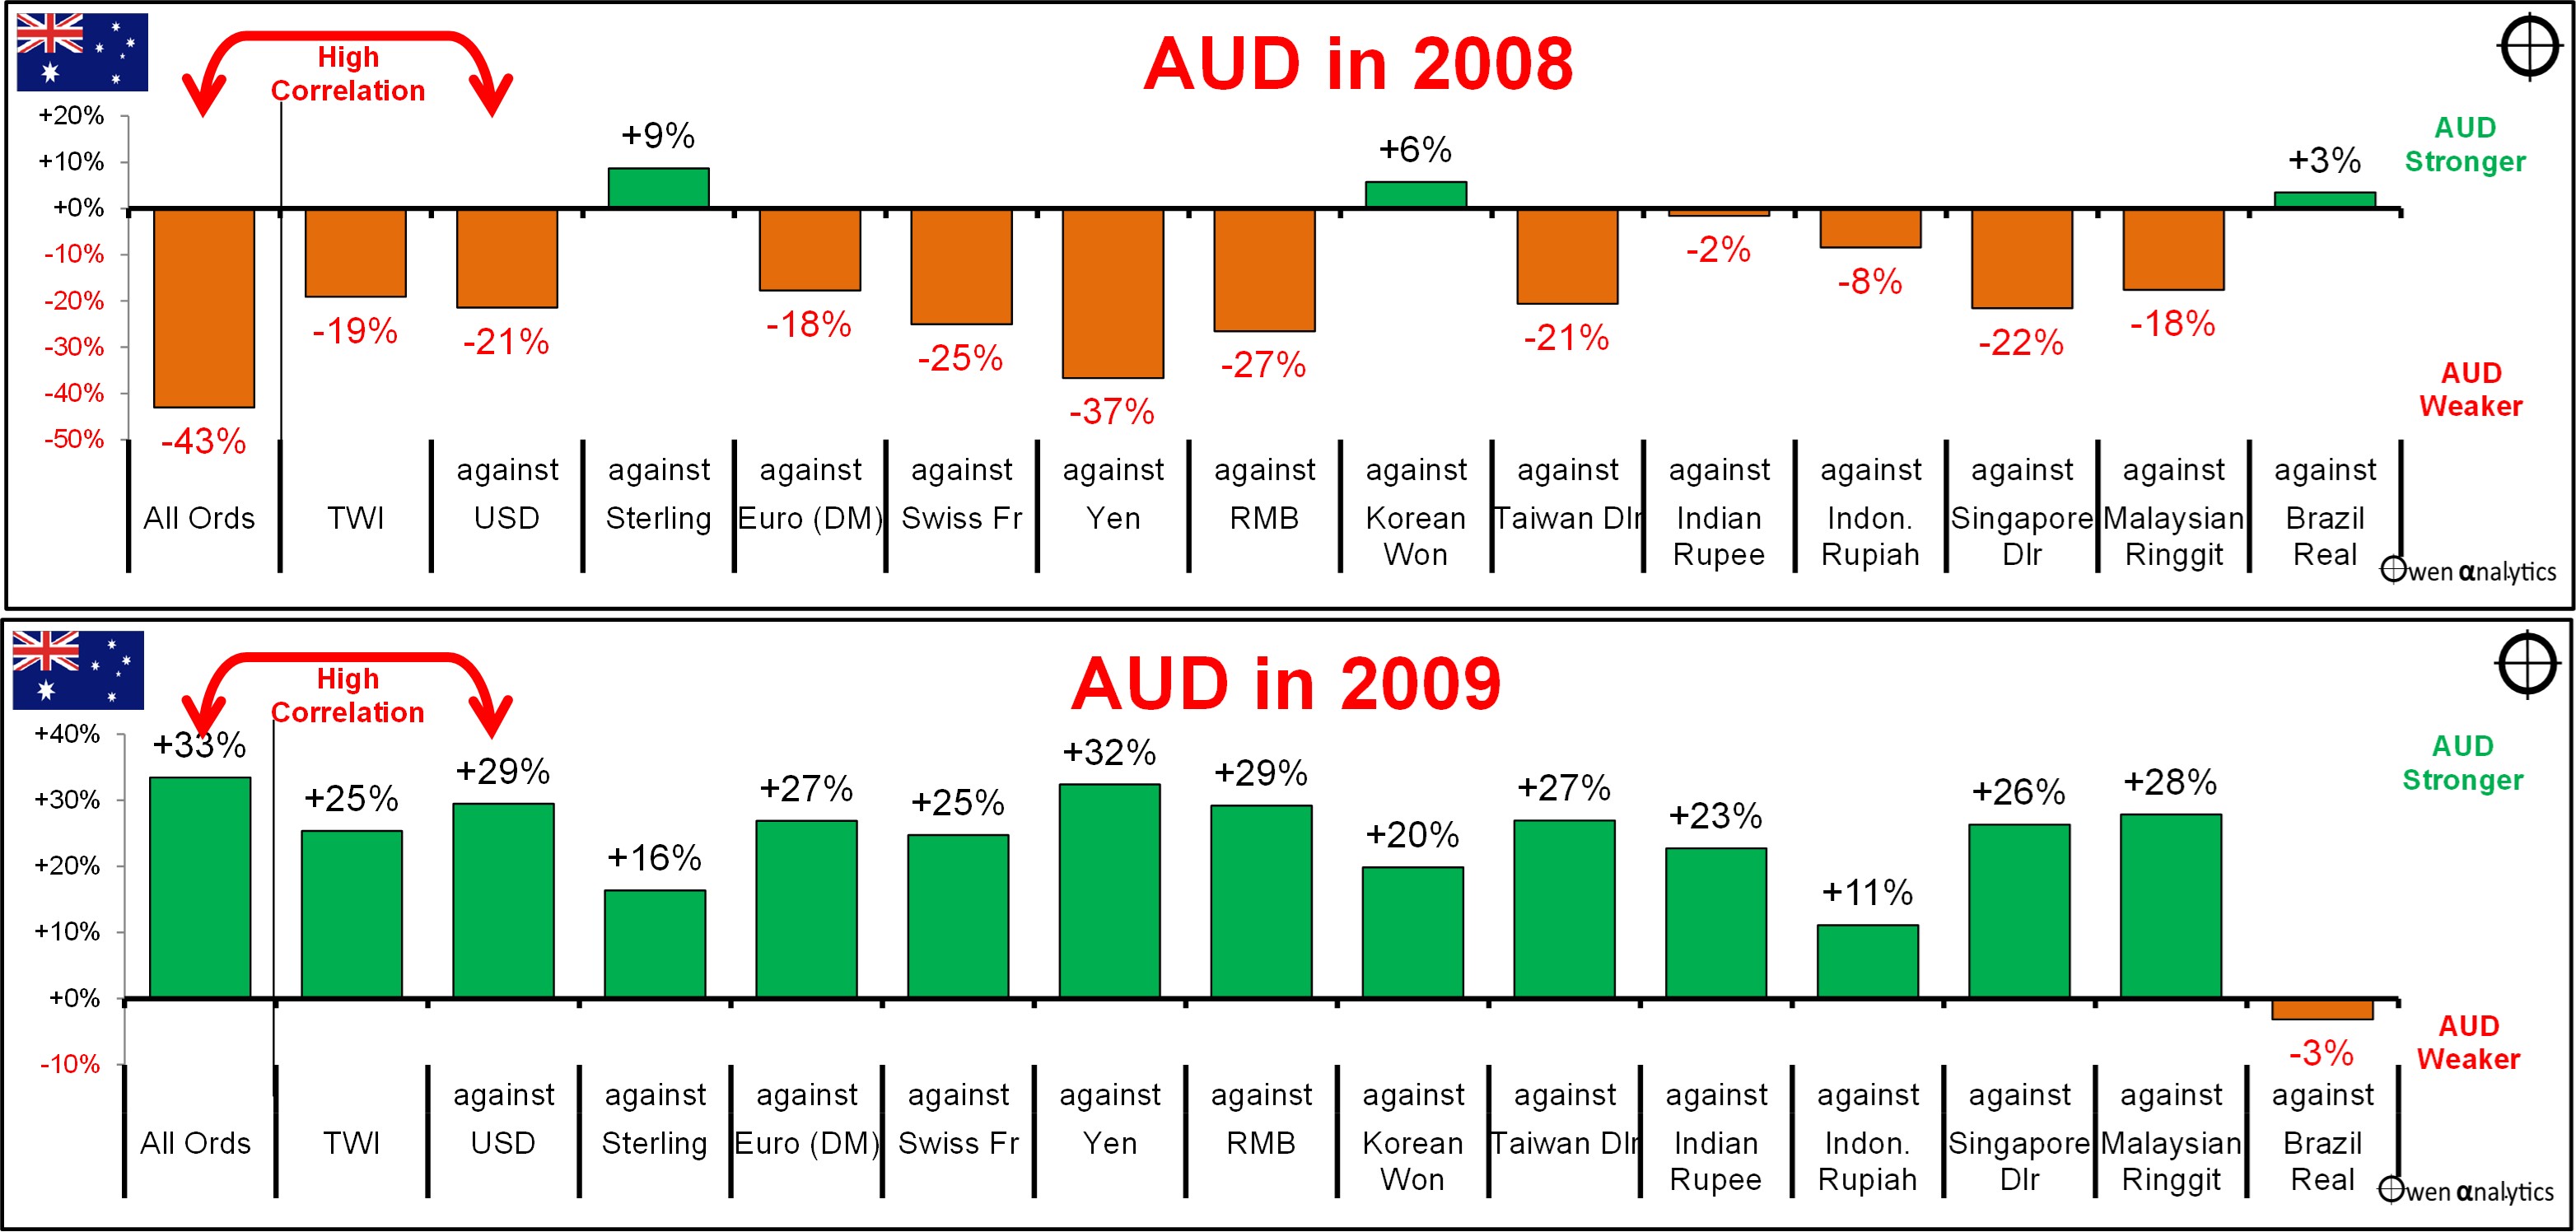
I have a 40% hedge ratio on international shares in my long-term portfolios, so I have profited from the general rise in the AUD over the past year (compared to many portfolios that have a policy of zero hedging), but also obtain a decent partial cushion in sell-offs.
Finally, continues to be a lot of nonsense in the populist media about the impending ‘end’ or ‘death’ or ‘decline’ or ‘demise’ of the US dollar. For the big picture on the strong US dollar and why Trump is understandably trying to talk it down, see:
· Is the US dollar in decline? or on its ‘last legs’? – Hardly! The problem is the dollar is too strong. Implications for Aussie investors (21-4-2025)
Commodities
Industrial commodities prices were mostly up in July (upper chart below), although iron remained weak and lithium fell back (driving the rotation out of miners into the banks). So far 2026 (lower chart) has been good for miners and fossil fuel producers in particular.
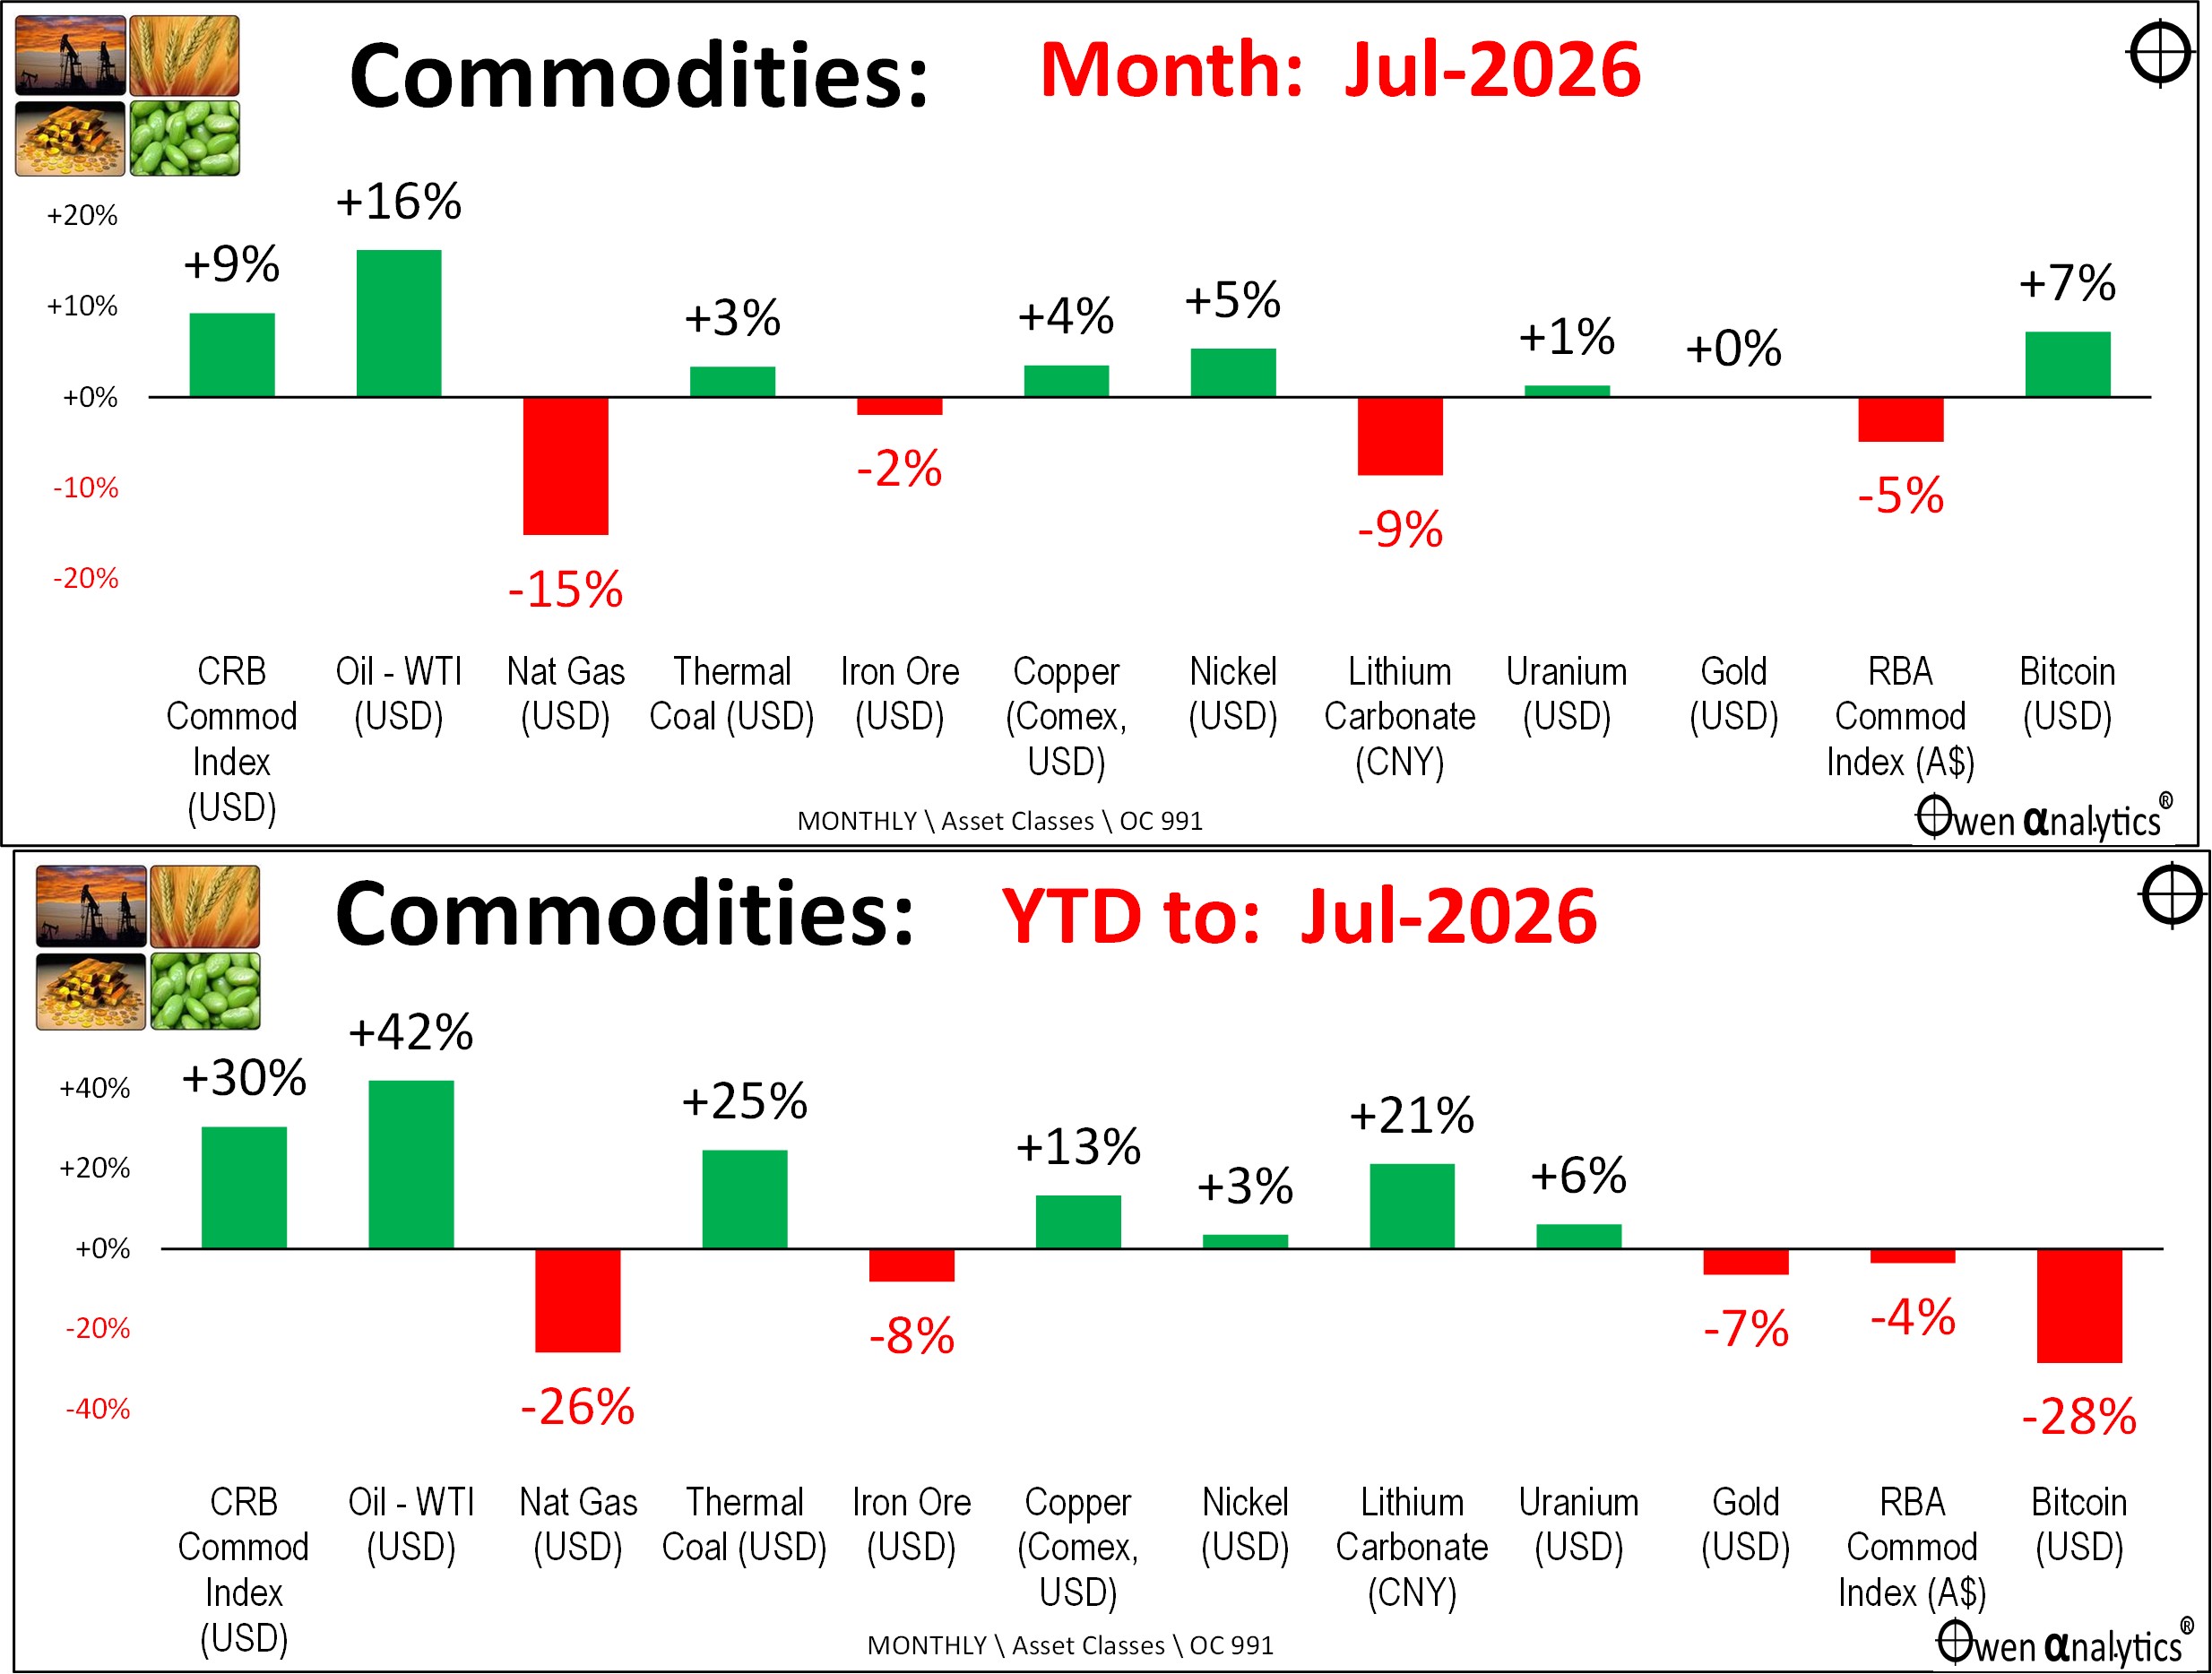
Just for a laugh I have included Bitcoin on this chart, at the far right). The Bitcoin price is basically just a bet on the US tech hype cycle, as I demonstrate here –
· Bitcoin is just a bet on the US tech hype cycle. Will it ever live up to its lofty ideals? (18 May 2026)
However it has lagged everything else over the past 12 months (lower chart above).
On iron ore - spot prices have been more or less flat for the past year. China has been trying to reduce over-production of steel and is also using its market power (which it should have done years ago) to strong-arm BHP, RIO and FMG on pricing.
The bigger problem is that ore grades in the Pilbara are declining, and new supply is now coming out of Simandou, Guinea (RIO), further putting pressure on Pilbara volumes and prices. On top of all that, the Aussie iron ore producers are being hit by rising operating costs: wages, fuel, compliance, red/black/green tape, and now a return to 1970s-style militant industrial action after Labor’s winding back of three decades of IR reforms.
Iron ore has been the stand-out windfall for Australia since 2003, but the days of peak Pilbara iron ore are behind us.
Meanwhile, seeing this trend, BHP has turned itself into primarily a copper play – with the growth and jobs mainly in Latin America. Likewise RIO in Mongolia.
On gold – I hold gold in my long-term ETF portfolios, and it doubled in the past couple of years, but is off -7% in 2026 to date. It the best performing holding by far.
Trump’s agenda?
I have not changed my views since March. Here is what I said in my end of March 2026 report:
The most important factor for the direction of short-term investment markets prices will be Trump’s twists and turns on the war front (or tariff front, or any of his other hobby horses du jour). Not even Trump knows what he will say or do one minute to the next, so it is pointless trying to guess.
However, I have two fairly sound reasons for being relatively positive for share markets in the coming months.
First - Trump probably has one central aim in the short term: to retain MAGA votes in the November mid-term elections. To do that he must (1) get oil prices down, and (2) minimise the number of Americans coming back in body bags.
This points to a relatively quick end to the war. Or at least an end to disruptions in oil/gas supplies, which means opening the Strait of Hormuz to restore normal shipping.
Second – in the event of a sharp economic recession, governments of all flavours in the US, Australia and just about everywhere else no longer have any notion of fiscal discipline. They have shown in the GFC and Covid that they will literally throw ‘free’ money at anything and everything in order to retain populist votes. Politicians no longer have the stomach nor the intellectual framework for ‘tough medicine’, ‘business cases’, trade-offs, or discipline.
The longer-term consequences and downsides will be even higher debts and widening intergenerational inequity, but it supports asset prices in the short-medium term. The current global tech/everything boom is being held up by hopes of endless monetary and fiscal profligacy.
This remains my Base Case scenario. Trump is desperate to get out but it must be with him ‘winning’. The problem is finding something to call a ‘win’. He is now reduced to a rather tiresome tirade of threats, then backdowns, then mysterious alleged ‘negotiations’ with nameless parties about so-called ‘deals’, then more threats, and more back-downs.
The most likely outcome is probably yet another humiliating US withdrawal dressed up as a ‘win’, but leaving a festering mess behind, like in Iraq, Afghanistan, Vietnam, Cuba, and numerous other foreign military misadventures.
What to do in portfolios?
Here I have also not changed my views. Here is what I wrote in my end of February 2026 monthly report, which was BEFORE the US started bombing Iran in the latest war:
“I see several themes driving markets in the medium term:
· Continued shift from rules-based order and win-win multi-lateral trade to power-based order and win-lose trade deals. Trump did not start this. The shift started in the 2010s with US/Europe letting Putin take Crimea in return for cheap gas for Germany/Europe, and US/Japan letting China militarise the South-China Sea. It has certainly accelerated under Trump. Lower cross-border trade & investment, more reliance on government subsidies & distortions, inflationary on-shoring of uneconomic industries.
· Sticky inflation - political pressure on central banks to keep rates low – populist pressure on governments to keep deficit spending. Tariffs + onshoring adding to costs/prices. Bond yields to stay elevated or even drift up further, risk of bond yield spikes, or sudden need for rate hikes, unsettling / breaking share markets.
· Share markets continue to be supported by good profit growth for now. Shares everywhere are expensive but buoyed by loose monetary & fiscal policies, plus a near certainty that governments will throw ‘free’/borrowed money at any problem.
· Commodities rally gathering pace – rising demand soaking up over-supply, ai / data centre boom (industrial metals, energy, water, land), global re-armament – especially Europe, Japan, Canada. This should support ASX market, as long as banks avoid a local recession.
· De-dollarisation fears are probably over-done, but is driving up gold, silver, but not bitcoin. US treasury yields not at risk for now (and even fell in February).
· The current boom will end one day of course. All markets everywhere, including and especially Australia, are over-priced on fundamentals, not just US-big tech. However, each boom is different and the triggers for the inevitable bust are different each time. See my recent 6-part series on share market over-pricing.
· I have not changed my asset allocation in portfolios (my own and for investment committees) and it has done rather well – beating Big Super by about 2% pa, thanks mainly to two themes - having Gold, and zero interest duration (no fixed rate bonds). A lot has happened in that time, and I have left it alone to do its work. That’s the point of an ‘all-weather’ portfolio – I don’t need to constantly worry and fiddle with it. When I get some time in the coming months, I will certainly take a look and see if I need any adjusting.”
Now, the question I posed in my end of March 2026 report – ‘Has the new war on Iran changed any of that?’
Probably not, except for two things. First, the war adds weight to my pre-existing medium-term inflation fears.
Second, the war and oil price spike just may be the trigger for the inevitably unwinding of the speculative tech boom. We know the boom will end of course, but we did not yet have a sufficient trigger.
The background for the big correction may be US/global slow-down caused in part by higher fuel prices / inflation / interest rates. The trigger may be a sudden realisation in the emptiness of the extraordinary hype over tech / ai profitability, probably accompanied by contagion withing the private credit / private equity funds that are holding mountains of unsustainable debt extended to tech / ai / data centre operators, perhaps leaking into / across the US banking sector – especially regional US banks and money centre banks lending to hedge funds and private credit.
It will be a big correction in the order of 40-60% crashes in share markets everywhere and trillions of dollars of debt written off as worthless. What we don’t know is when.
Meanwhile, life goes on. Looking beyond the daily noise and gyrations, I am sticking to my portfolio holdings, which is beating the vast majority of institutional super/pension funds without all of their fiddling & fudging –
· My ‘10-4 all-weather ETF portfolio’ doing well after two busy/lazy years, beating Big Super funds again by big margins (8-Jul-2026)
‘Till next time – safe investing and stay healthy!
Ps - I am happy to report that I completed my 12th and hopefully FINAL round of chemotherapy yesterday after the big cancer surgery in Januaury. Hopefully now cancer-free! (well hopefully for a while yet anyyway.)